Abstract
Dynamin is a master regulator of membrane fission in endocytosis. However, a function for dynamin immediately upon fusion has also been suspected from a variety of experiments that measured release of granule contents. The role of dynamin guanosine triphosphate hydrolase (GTPase) activity in controlling fusion pore expansion and postfusion granule membrane topology was investigated using polarization optics and total internal reflection fluorescence microscopy (pTIRFM) and amperometry. A dynamin-1 (Dyn1) mutant with increased GTPase activity resulted in transient deformations consistent with rapid fusion pore widening after exocytosis; a Dyn1 mutant with decreased activity slowed fusion pore widening by stabilizing postfusion granule membrane deformations. The experiments indicate that, in addition to its role in endocytosis, GTPase activity of dynamin regulates the rapidity of fusion pore expansion from tens of milliseconds to seconds after fusion. These findings expand the membrane-sculpting repertoire of dynamin to include the regulation of immediate postfusion events in exocytosis that control the rate of release of soluble granule contents.
🔬 Techniques
💻 Software
✨ Fluorophores
🧪 Sample Preparation
🔬 Cell Lines
🏭 Microscope Brands
🧪 Reagent Suppliers
📷 Detectors
🔎 Objectives
🎨 Filters
💻 Software Details
🏛️ Research Organizations (ROR)
Affiliated research institutions:
📋 Methods
Chromaffin cell preparation and transfection
Chromaffin cell preparation from bovine adrenal medulla and transient transfection were performed as previously described ( Wick et al. , 1993 ). Cells were plated onto 25-mm coverslips (refractive index 1.51) that had been coated with poly-d-lysine and calf skin collagen to promote cell adhesion. Cells were transfected with plasmid(s) by Ca 2+ phosphate precipitation. NPY-Cer was transfected alone or with hemagglutinin (HA)-tagged, human Dyn1 constructs ( Song et al. , 2004 ) in diI experiments. The parent NPY plasmid was a gift from Wolfhard Almers (Vollum Institute, Oregon Health and Science University, Portland, OR). NPY-Cer is a soluble lumenal marker of chromaffin granules that is released upon exocytosis. Human Dyn1 WT and Dyn1 mutant coexpression with NPY-Cer was determined with immunocytochemistry. HA-tagged Dyn1 constructs were visualized with the HA-11 anti-HA antibody at a 1:200 dilution (Covance, Princeton, NJ) and Alexa Fluor 568 goat anti–mouse immunoglobulin G (IgG; Invitrogen, Carlsbad, CA) secondary antibody (1:200 dilution). There was 90% coexpression of NPY and Dyn1 in transfected chromaffin cells. Experiments were performed 3–7 d after transfection.
Perfusion
Experiments were performed in a physiological salt solution (PSS) containing 145 mM NaCl, 5.6 mM KCl, 2.2 mM CaCl 2 , 0.5 mM MgCl 2, 5.6 mM glucose, 15 HEPES, pH 7.4 at ∼ 28°C. Individual cells were perfused through a pipette (100 μm inner diameter) using positive pressure from a computer-controlled perfusion system DAD-6VM (ALA Scientific Instruments, Westbury, NY). Generally, cells were perfused with PSS for 5 s, and then stimulated to secrete with elevated K + -containing solution (95 mM NaCl, 56 mM KCl, 5 mM CaCl 2 , 0.5 mM MgCl 2, 5.6 mM glucose, 15 mM HEPES, pH 7.4) for 60 s. diI was added directly to cells bathed in PSS at a 1:50 dilution. The cells were then quickly washed several times in PSS and used immediately. To detect endocytosis, cells transfected with rat vesicular monoamine transporter 2–pHL (VMAT2-pHL) were perfused for 15 s with pH 7.4 elevated K + PSS and then exposed to pH 5.5 PSS (with MES buffer substituted for HEPES) to quench the fluorescence of extracellular-facing pHL. Bafilomycin (Amersham Biosciences, Piscataway, NJ) was added to PSS to a final concentration of 1 μM to inhibit reacidification of granules that underwent endocytosis ( Fernandez-Alfonso and Ryan, 2004 ).
Show full methods section
Chromaffin cell preparation and transfection
Chromaffin cell preparation from bovine adrenal medulla and transient transfection were performed as previously described ( Wick et al. , 1993 ). Cells were plated onto 25-mm coverslips (refractive index 1.51) that had been coated with poly-d-lysine and calf skin collagen to promote cell adhesion. Cells were transfected with plasmid(s) by Ca 2+ phosphate precipitation. NPY-Cer was transfected alone or with hemagglutinin (HA)-tagged, human Dyn1 constructs ( Song et al. , 2004 ) in diI experiments. The parent NPY plasmid was a gift from Wolfhard Almers (Vollum Institute, Oregon Health and Science University, Portland, OR). NPY-Cer is a soluble lumenal marker of chromaffin granules that is released upon exocytosis. Human Dyn1 WT and Dyn1 mutant coexpression with NPY-Cer was determined with immunocytochemistry. HA-tagged Dyn1 constructs were visualized with the HA-11 anti-HA antibody at a 1:200 dilution (Covance, Princeton, NJ) and Alexa Fluor 568 goat anti–mouse immunoglobulin G (IgG; Invitrogen, Carlsbad, CA) secondary antibody (1:200 dilution). There was 90% coexpression of NPY and Dyn1 in transfected chromaffin cells. Experiments were performed 3–7 d after transfection.
Perfusion
Experiments were performed in a physiological salt solution (PSS) containing 145 mM NaCl, 5.6 mM KCl, 2.2 mM CaCl 2 , 0.5 mM MgCl 2, 5.6 mM glucose, 15 HEPES, pH 7.4 at ∼ 28°C. Individual cells were perfused through a pipette (100 μm inner diameter) using positive pressure from a computer-controlled perfusion system DAD-6VM (ALA Scientific Instruments, Westbury, NY). Generally, cells were perfused with PSS for 5 s, and then stimulated to secrete with elevated K + -containing solution (95 mM NaCl, 56 mM KCl, 5 mM CaCl 2 , 0.5 mM MgCl 2, 5.6 mM glucose, 15 mM HEPES, pH 7.4) for 60 s. diI was added directly to cells bathed in PSS at a 1:50 dilution. The cells were then quickly washed several times in PSS and used immediately. To detect endocytosis, cells transfected with rat vesicular monoamine transporter 2–pHL (VMAT2-pHL) were perfused for 15 s with pH 7.4 elevated K + PSS and then exposed to pH 5.5 PSS (with MES buffer substituted for HEPES) to quench the fluorescence of extracellular-facing pHL. Bafilomycin (Amersham Biosciences, Piscataway, NJ) was added to PSS to a final concentration of 1 μM to inhibit reacidification of granules that underwent endocytosis ( Fernandez-Alfonso and Ryan, 2004 ).
Polarized total internal reflection fluorescence microscopy
The specialized excitation system used to create the p-pol and s-pol 514-nm beams, superimpose their paths, and to further superimpose the 442-nm beam on that path is described in detail elsewhere ( Anantharam et al. , 2010b ). The system is programmed to step through a sequence of three shutter openings (one at a time for each beam), repeating the cycle without additional delay using a TTL triggering system. Objective-based TIRFM illumination was produced by directing the common beam path through a custom side port to a side-facing filter cube below the objective turret of an Olympus IX70 (inverted) microscope (Melville, NY). The filter cube contained these dichroic mirror/emission filter combinations: z442/514rpc and z442/514m for NPY-Cer/diI; and z442/561rdc and z442/561m for Dyn1-GFP/NPY-Cherry (Chroma Technology, Brattleboro, VT). The beam was focused on the periphery of the back focal plane of a 60× 1.49 NA, oil-immersion objective (Olympus) so that the laser beam was incident on the coverslip at ∼70 degrees from the normal, giving a decay constant for the evanescent field of approximately 110 nm. Concerning the emission path, a 1.5× internal magnifying lens of the Olympus microscope was used. For simultaneous imaging of GFP/Cherry, a DualView image splitter (Optical Insights, Tucson, AZ) was installed before the camera, containing dichroic mirror 560 dcxr and emission filters D510/80nm and BP620/60m (Chroma). Approximately 1% of the emission in the GFP (short wavelength) channel resulted from direct excitation of the Cherry fluorophore. Digital images were captured on a cooled EM CCD camera (Andor iXon, Andor Technology, South Windsor, CT). The camera takes an exposure synchronous with each shutter opening. Images were acquired at ∼30 Hz with 20 ms exposures and 100 gain (EM setting). At 30 Hz, the full cycle of three exposures had a period of approximately 100 ms.
Image analysis for pTIRFM Sequential
NPY-Cer, diI s-, and p-pol emission images were captured using IQ software (Andor). Normalized P/S ratios (see next paragraph) and P + 2S sums were calculated pixel by pixel for each image, and the transformations were aligned to the NPY-Cer images using custom software written in IDL (ITT, Boulder, CO). Exocytosis of individual granules was evident from the sudden and complete loss of NPY-Cer fluorescence. Changes in P/S and P + 2S were determined in a 292-nm region of interest (ROI) centered over localized increases in the P/S ratio at sites of exocytosis. When fusion occurred without an evident increase in P/S , the ROI was centered over the region of the fusing granule. P/S varies with the relative intensities of the p- and s-pol excitations, biases in the optical system, and interference fringes. To reduce these effects and allow comparisons with theory, P/S data from the diI emission were normalized to the ratio obtained with solution containing 10 mM rhodamine 6G (Invitrogen), which is predicted to be randomly oriented. The normalization was performed using the spatial mean of rhodamine 6G emission excited by each of the p- and s-pol 514-nm beams. For P + 2S , the amplitudes of p relative to s were also corrected for by the rhodamine 6G calibration. For the purposes of estimating noise in P/S and P + 2S , and to set a threshold above which changes are significant, the P/S and P + 2S of nonfusing granules within 3 ROIs of fusing granules was determined at the time of fusion of the neighboring granule. Changes in the P/S and P + 2S for the nonfusing granules had a standard deviation of 2% and 3%, respectively (28 granules). Changes observed near fusing granules greater than 6% were considered significant. Amperometry Perfusion solutions and conditions were identical to those used for imaging experiments. Chromaffin cells were transfected with NPY-GFP (to visualize granules) alone or with human Dyn1 constructs. Carbon-fiber electrodes (5 μm; ALA Scientific, Westbury, NY) were held at + 650 mV and positioned so that they touched the membrane of cells expressing fluorescent protein. Secretion was stimulated via local application of 56 mM K + for 60 s. Currents were collected using an Axopatch 200 A amplifier modified for extended voltage output (Axon Instruments, Foster City, CA), filtered at 2 kHz, and sampled at 4 kHz ( Lam et al. , 2008 ; Anantharam et al. , 2010b ). No digital filtering was applied. Currents were analyzed using an IGOR XOP (Wavemetrics, Portland, OR; Mosharov and Sulzer, 2005 ). Only spikes with amplitudes greater than 10 pA and rise times less than 5 ms were used in the spike analysis. PSF analysis was limited only to those PSFs with amplitudes greater than 1 pA and durations greater than 2.5 ms. To obtain a measure for the fusion pore open time, we followed the analysis of Meyer Jackson and colleagues ( Wang et al. , 2001 ). Because the transitions of fusion pores are stochastic (like ion channels), lifetime distributions were used to characterize their kinetics. The distributions were fit well by single exponentials (r 2 = 0.99), with time constants equal to the mean open time.
Confocal microscopy
Images of transfected cells displaying fluorescent signals were acquired on an Olympus Fluoview 500 confocal microscope with a 60× 1.42 NA oil objective. For imaging, an argon 488-nm laser with a 505- to 525-nm bandpass filter, an HeNe green 543-nm laser with a 560- to 600-nm bandpass filter, and a HeNe red (633-nm) laser with a longpass filter were used. Images were analyzed with ImageJ software ( http://rsb.info.nih.gov/ij/download.html ), and statistics were performed with Prism 5 software from Graphpad Prism Software (La Jolla, CA).
Immunocytochemistry
Chromaffin cells were plated on Lab-Tek II chambered coverslips (Nalge Nunc International, distributed by Thermo Fisher Scientific, Rochester, NY) that had been sequentially coated with poly-D-lysine and calf skin collagen to promote cell adhesion. Cells were cotransfected with NPY-Cherry and HA-tagged Dyn1 constructs. Four or five days after transfection, cells were fixed in glutaraldehyde, followed by permeabilization with methanol and exposure to antibodies. NPY was visualized directly by the intrinsic fluorescence of the Cherry fluorophore. For confocal imaging ( Figures 6 , 7 , and S4), HA-tagged Dyn1 constructs were visualized with a goat polyclonal anti-HA antibody (GenScript A00168, 1:200 dilution) and Alexa Fluor 647 donkey anti–goat IgG (Invitrogen/Molecular Probes) secondary antibody (1:300 dilution). Both endogenous dynamin 1 and the HA-tagged constructs were detected with a monoclonal anti-dynamin 1 antibody (Hudy 1, 1:100 dilution; Millipore, Billerica, MA) followed by Alexa Fluor 488 donkey anti–mouse IgG (1:300 dilution; Invitrogen/Molecular Probes).
Atomic Force Microscopy
Atomic force microscopy was used to measure surface elasticity of chromaffin cells with and without transfected Dyn1(T65A). Measurements were performed on a BioScope Catalyst Life Science Atomic Force Microscope (Veeco/Bruker Nano, Santa Barbara, CA) equipped with fluorescence imaging. Transfected chromaffin cells were detected by the presence of NPY-Cherry fluorescent secretory granules. Chromaffin cells are approximately 15-μm diameter, round cells; measurements were readily performed away from the edges of cells to minimize the influence of the glass substrate on surface measurements. An MLCT probe was used with a 20-nm diameter and a spring constant of ∼0.01 N/m. Tip deflections versus Z-distance curves were taken at user-defined locations under bright-field and fluorescence illumination. The maximum load on the cell surface was less than 1 nN to prevent damage to the cells. Multiple curves were taken at different locations on the same cell.
Supplementary Material [Supplemental Materials]
📊 Figures
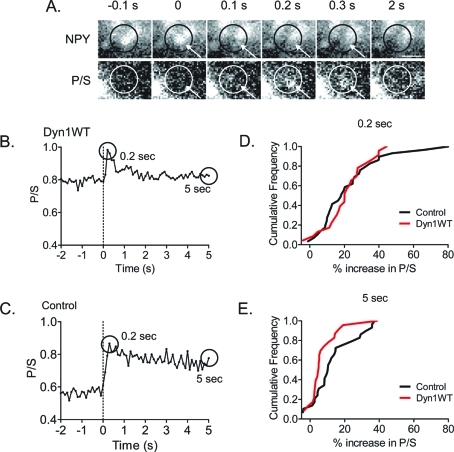
FIGURE 1:
Membrane deformations at the sites of granule fusion are more transient in cells with transfected Dyn1WT than without (control). (A) Images are shown of pTIRFM responses ( P/S ) to exocytosis in a cel...
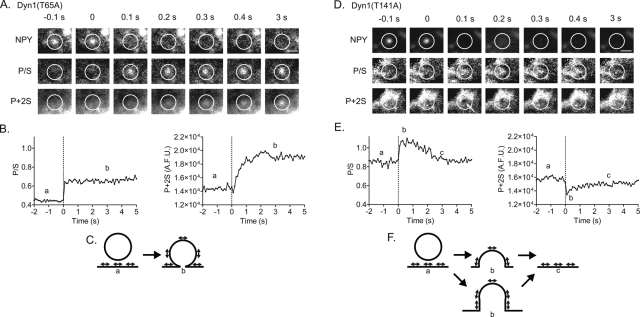
FIGURE 2:
Examples of membrane topological changes after fusion in cells expressing Dyn1 GTPase mutants. Chromaffin cells were cotransfected with NPY-Cer and either Dyn1(T65A) or Dyn1(T141A). (A) Images are sho...
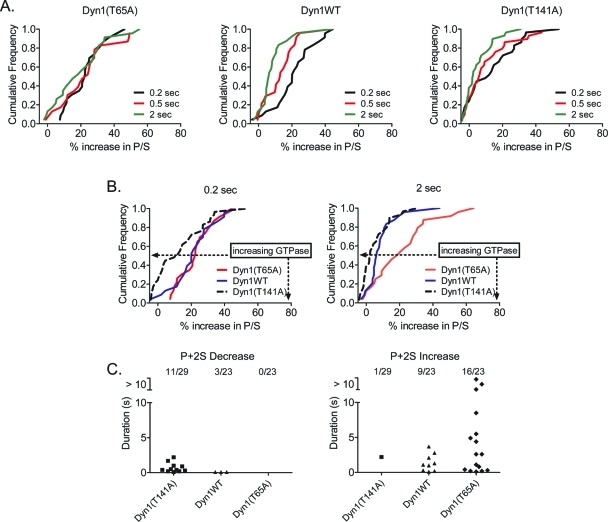
FIGURE 3:
Dyn1 GTPase activity regulates the dynamics of membrane deformations after fusion. (A) Cumulative frequency histograms were generated to compare the dynamics of the P/S change observed at 0.2, 0.5, an...
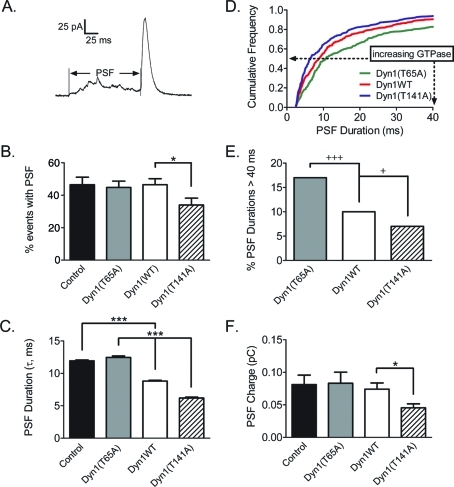
FIGURE 4:
Amperometry of individual catecholamine release events indicates that Dyn1 GTPase activity regulates early fusion pore expansion. (A) An example of an amperometric spike with a long PSF. (B) The avera...
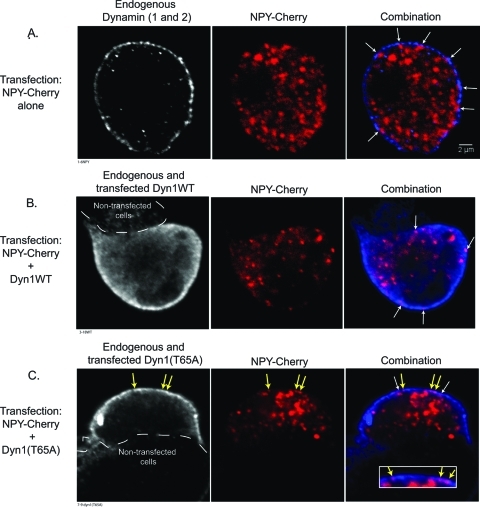
FIGURE 5:
Confocal imaging of chromaffin cells shows Dyn1 expression to be punctate and primarily localized to the plasma membrane. Chromaffin cells cultured on glass coverslips were transfected with a plasmid ...
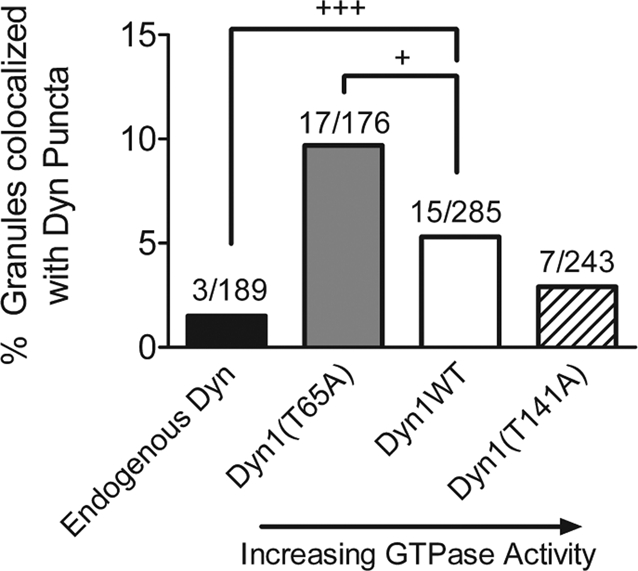
FIGURE 6:
Colocalization of granules with Dyn1 puncta. The percentage of granules showing overlapping expression with Dyn1 puncta (center of intensities within 70 nm, as shown in yellow arrows in Figure 5 ) is ...
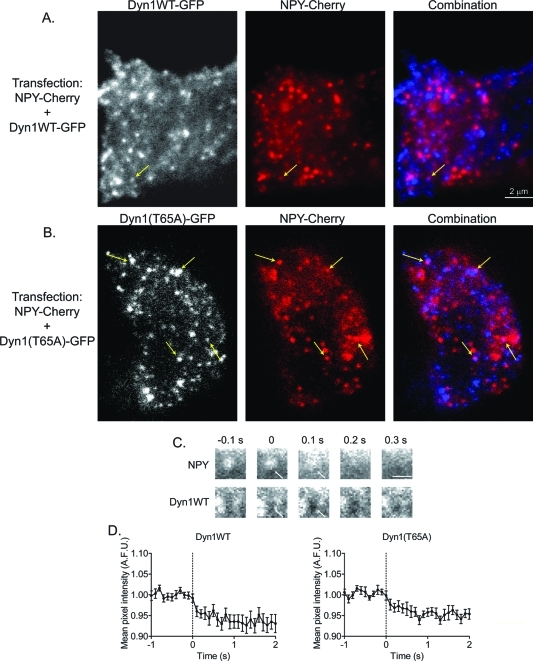
FIGURE 7:
Simultaneous imaging of Dyn1-GFP and NPY-Cherry with TIRFM. (A) Chromaffin cells were cotransfected with Dyn1WT-GFP (left panel) and NPY-Cherry (middle panel); the combination image is shown in the ri...
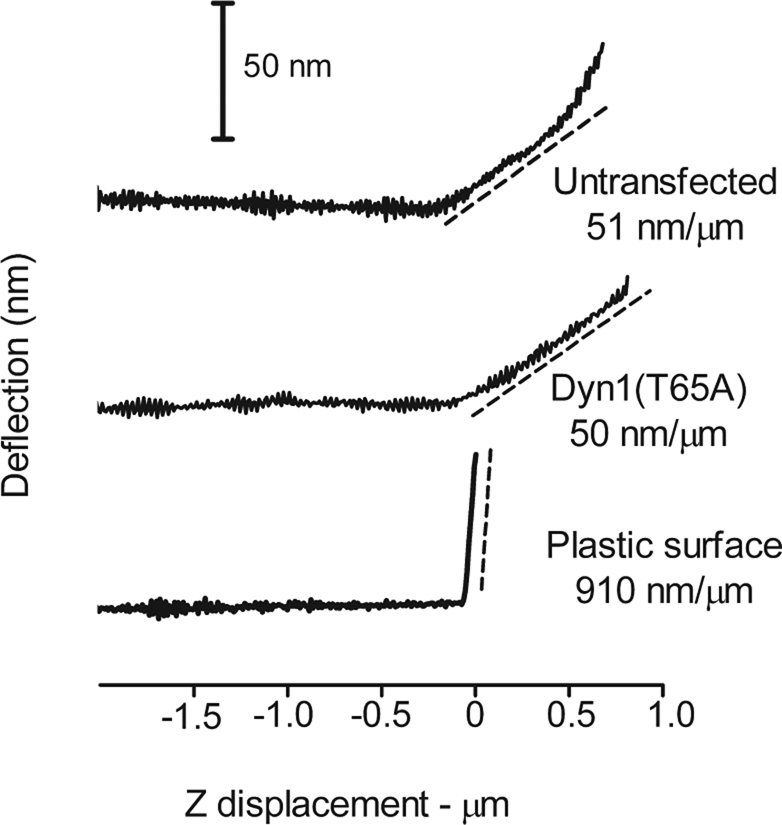
FIGURE 8:
Atomic force measurements of surface elasticity of untransfected cells and cells transfected with Dyn1(T65A). Representative probe deflections during approach to (A) a nontransfected cell, (B) a cell ...
Figure images are served from the NIH/NLM PubMed Central Open Access Subset or Europe PMC; copyright remains with the publishers and authors.
💬 Discussion
0 commentsNo comments yet. Be the first to start a discussion!
Leave a Comment