Abstract
AbstractRecent advances in thick tissue clearing are enabling high resolution, volumetric fluorescence imaging of complex cellular networks. Fluorescent proteins (FPs) such as GFP, however, can be inactivated by the denaturing chemicals used to remove lipids in some tissue clearing methods. Here, we solved the crystal structure of a recently engineered ultra-stable GFP (usGFP) and propose that the two stabilising mutations, Q69L and N164Y, act to improve hydrophobic packing in the core of the protein and facilitate hydrogen bonding networks at the surface, respectively. usGFP was found to dimerise strongly, which is not desirable for some applications. A point mutation at the dimer interface, F223D, generated monomeric usGFP (muGFP). Neurons in whole mouse brains were virally transduced with either EGFP or muGFP and subjected to Clear Lipid-exchanged Acrylamide-hybridized Rigid Imaging/Immunostaining/In situhybridization-compatible Tissue-hYdrogel (CLARITY) clearing. muGFP fluorescence was retained after CLARITY whereas EGFP fluorescence was highly attenuated, thus demonstrating muGFP is a novel FP suitable for applications where high fluorescence stability and minimal self-association are required.
🔬 Techniques
🔭 Microscopes
🧬 Organisms
✨ Fluorophores
🧪 Sample Preparation
🔬 Cell Lines
🏭 Microscope Brands
🧪 Reagent Suppliers
🔎 Objectives
🎨 Filters
💻 Software Details
💾 Data Repositories
🏛️ Research Organizations (ROR)
Affiliated research institutions:
📋 Methods
Protein expression and purification Residues 1–238 of sfGFP or usGFP with an N-terminal 6 × His tag were cloned into a custom vector based on pQE30 using BamHI and HindIII restriction sites. The F223D mutation was introduced into the pQE30-usGFP construct using the PrimeStar Mutagenesis kit (Takara, Shiga, Japan) and confirmed by sequencing. Proteins were expressed in E.coli BL21(DE3) cultured in LB medium at 20 °C for 16 h. Cells were harvested by centrifugation and resuspended in buffer (25 mM Tris-HCl, pH 7.5, 150 mM NaCl, 0.6% 3-[(3-cholamidopropyl)dimethylammonio]-1-propanesulfonate (CHAPS)) before lysis by sonication. Clarified lysate was applied to 3 mL TALON (Clontech) resin pre-equilibrated in 25 mM Tris, pH 7.5 and 150 mM NaCl and incubated at 4 °C for 1 h with gentle rocking. Resin was washed with 5 column volumes of wash buffer (25 mM Tris pH 7.5, 150 mM NaCl and 10 mM imidazole) and then eluted with elution buffer (equilibration buffer with 250 mM imidazole). GFP containing fractions were concentrated and applied to a Superdex™ 200 10/300 GL column (GE Healthcare Life Sciences) and eluted with 25 mM Tris, pH 7.5 and 150 mM NaCl. Purified proteins were concentrated for use in further analyses. Sedimentation velocity analytical ultracentrifugation Sedimentation velocity experiments were carried out in a Beckman-Coulter XL-I ultracentrifuge with UV-Vis scanning optics. 380 µL sample and 400 µL reference (20 mM Tris pH 7.5 and 150 mM NaCl) solutions were loaded into 12 mm charcoal-epon double sector cells with quartz windows and mounted in an An-60Ti 4-hole rotor. All GFP variants were centrifuged at concentrations of 1.3 mg mL −1 , 0.65 mg mL −1 and 0.33 mg mL −1 at 50,000 rpm (201,600 × g ) and 20 °C. Radial absorbance data were collected at 280 nm in continuous mode and were fitted to a continuous sedimentation coefficient distribution [c(s)] model using SEDFIT 33 and converted to standardised [c(s 20 , w )] distributions. SEDNTERP 34 was used to calculate buffer density (1.005 g mL −1 ), buffer viscosity (1.021 cp), and the partial specific volumes of sfGFP (0.732 g mL −1 ), usGFP (0.733 mL g-1), and muGFP (0.732 mL g −1 ). Crystallisation of usGFP and muGFP usGFP and muGFP were crystallised using the sitting drop vapour diffusion method. Crystals of usGFP were obtained from crystallant containing 0.2 M sodium nitrate, 20% (w/v) PEG 3350, 0.1 M bis-tris propane, pH 6.5 at 8 °C. Crystals were cryoprotected by brief soaking in crystallant supplemented with 7.5% v/v glycerol and 7.5% v/v ethylene glycol before flash cooling in liquid nitrogen. Crystals of muGFP were obtained from crystallant containing 0.2 M sodium chloride, 22% w/v PEG 8000, 4% v/v acetone, 0.1 M phosphate-citrate buffer pH 3.7 at 8 °C. Crystals were flash cooled with no additional cryoprotectant. X-ray diffraction data were collected at 100 K using the microfocus macromolecular crystallography (MX2) beam line of the Australian Synchrotron under the control of the BluIce software package 35 . Structure determination and refinement of usGFP and muGFP Diffraction data were indexed and integrated using the XDS package 36 , followed by analysis using POINTLESS 37 and merging using AIMLESS 38 from the CCP4 suite 39 . Initial phase estimates were obtained by molecular replacement using PHASER 40 . Molecular replacement for usGFP was performed using the sfGFP structure (PDB ID 2B3P 21 ); as the search model. Molecular replacement for muGFP was performed using the refined coordinates for usGFP as the search model. Structures were submitted to three cycles of simulated annealing using PHENIX 41 at an early stage of the refinement to minimise model bias. Structure refinement was carried out using REFMAC5 42 with iterative model building and addition of solvent performed using COOT 43 . Data processing and refinement statistics are shown in Table 1 . Small-angle X-ray scattering SAXS data were collected at the SAXS/WAXS beam line at the Australian Synchrotron using the method described previously 44 . Briefly, 50 µL purified GFP at approximately 50 mg mL −1 was loaded onto an in-line Superdex 75 10/300 GL size exclusion column (GE Healthcare) pre-equilibrated with 25 mM Tris pH 7.5 and 150 mM NaCl. The column was run at a flow rate of 0.2 ml min −1 and eluted directly into a 1.5 mm quartz capillary for data collection. 800 images (5 s exposures) were collected during elution with a Pilatus 1 M detector at a distance of 2.6 m from the capillary, giving a q range of 0.005 to 0.3 Å −1 where q is the magnitude of the momentum-transfer vector and q = (4πsinθ)/λ where the scattering angle is 2θ and λ is the X-ray wavelength (1.0322 Å). Radial averaging, normalisation and background subtraction were conducted using SCATTERBRAIN (Australian Synchrotron). 6 images (30 s exposure) at the elution peak were averaged for each sample, data were analysed using ATSAS 45 , and Guinier plots were linear for s·Rg < 1.3 (Supplementary Figure 4 ). The theoretical scattering curves for the GFP variants were calculated from the refined crystal structure coordinates using CRYSOL 46 . Experimental data were fitted to theoretical scattering curves calculated from the refined usGFP structure coordinates, as this was the most complete structural model.
Show full methods section
Protein expression and purification Residues 1–238 of sfGFP or usGFP with an N-terminal 6 × His tag were cloned into a custom vector based on pQE30 using BamHI and HindIII restriction sites. The F223D mutation was introduced into the pQE30-usGFP construct using the PrimeStar Mutagenesis kit (Takara, Shiga, Japan) and confirmed by sequencing. Proteins were expressed in E.coli BL21(DE3) cultured in LB medium at 20 °C for 16 h. Cells were harvested by centrifugation and resuspended in buffer (25 mM Tris-HCl, pH 7.5, 150 mM NaCl, 0.6% 3-[(3-cholamidopropyl)dimethylammonio]-1-propanesulfonate (CHAPS)) before lysis by sonication. Clarified lysate was applied to 3 mL TALON (Clontech) resin pre-equilibrated in 25 mM Tris, pH 7.5 and 150 mM NaCl and incubated at 4 °C for 1 h with gentle rocking. Resin was washed with 5 column volumes of wash buffer (25 mM Tris pH 7.5, 150 mM NaCl and 10 mM imidazole) and then eluted with elution buffer (equilibration buffer with 250 mM imidazole). GFP containing fractions were concentrated and applied to a Superdex™ 200 10/300 GL column (GE Healthcare Life Sciences) and eluted with 25 mM Tris, pH 7.5 and 150 mM NaCl. Purified proteins were concentrated for use in further analyses. Sedimentation velocity analytical ultracentrifugation Sedimentation velocity experiments were carried out in a Beckman-Coulter XL-I ultracentrifuge with UV-Vis scanning optics. 380 µL sample and 400 µL reference (20 mM Tris pH 7.5 and 150 mM NaCl) solutions were loaded into 12 mm charcoal-epon double sector cells with quartz windows and mounted in an An-60Ti 4-hole rotor. All GFP variants were centrifuged at concentrations of 1.3 mg mL −1 , 0.65 mg mL −1 and 0.33 mg mL −1 at 50,000 rpm (201,600 × g ) and 20 °C. Radial absorbance data were collected at 280 nm in continuous mode and were fitted to a continuous sedimentation coefficient distribution [c(s)] model using SEDFIT 33 and converted to standardised [c(s 20 , w )] distributions. SEDNTERP 34 was used to calculate buffer density (1.005 g mL −1 ), buffer viscosity (1.021 cp), and the partial specific volumes of sfGFP (0.732 g mL −1 ), usGFP (0.733 mL g-1), and muGFP (0.732 mL g −1 ). Crystallisation of usGFP and muGFP usGFP and muGFP were crystallised using the sitting drop vapour diffusion method. Crystals of usGFP were obtained from crystallant containing 0.2 M sodium nitrate, 20% (w/v) PEG 3350, 0.1 M bis-tris propane, pH 6.5 at 8 °C. Crystals were cryoprotected by brief soaking in crystallant supplemented with 7.5% v/v glycerol and 7.5% v/v ethylene glycol before flash cooling in liquid nitrogen. Crystals of muGFP were obtained from crystallant containing 0.2 M sodium chloride, 22% w/v PEG 8000, 4% v/v acetone, 0.1 M phosphate-citrate buffer pH 3.7 at 8 °C. Crystals were flash cooled with no additional cryoprotectant. X-ray diffraction data were collected at 100 K using the microfocus macromolecular crystallography (MX2) beam line of the Australian Synchrotron under the control of the BluIce software package 35 . Structure determination and refinement of usGFP and muGFP Diffraction data were indexed and integrated using the XDS package 36 , followed by analysis using POINTLESS 37 and merging using AIMLESS 38 from the CCP4 suite 39 . Initial phase estimates were obtained by molecular replacement using PHASER 40 . Molecular replacement for usGFP was performed using the sfGFP structure (PDB ID 2B3P 21 ); as the search model. Molecular replacement for muGFP was performed using the refined coordinates for usGFP as the search model. Structures were submitted to three cycles of simulated annealing using PHENIX 41 at an early stage of the refinement to minimise model bias. Structure refinement was carried out using REFMAC5 42 with iterative model building and addition of solvent performed using COOT 43 . Data processing and refinement statistics are shown in Table 1 . Small-angle X-ray scattering SAXS data were collected at the SAXS/WAXS beam line at the Australian Synchrotron using the method described previously 44 . Briefly, 50 µL purified GFP at approximately 50 mg mL −1 was loaded onto an in-line Superdex 75 10/300 GL size exclusion column (GE Healthcare) pre-equilibrated with 25 mM Tris pH 7.5 and 150 mM NaCl. The column was run at a flow rate of 0.2 ml min −1 and eluted directly into a 1.5 mm quartz capillary for data collection. 800 images (5 s exposures) were collected during elution with a Pilatus 1 M detector at a distance of 2.6 m from the capillary, giving a q range of 0.005 to 0.3 Å −1 where q is the magnitude of the momentum-transfer vector and q = (4πsinθ)/λ where the scattering angle is 2θ and λ is the X-ray wavelength (1.0322 Å). Radial averaging, normalisation and background subtraction were conducted using SCATTERBRAIN (Australian Synchrotron). 6 images (30 s exposure) at the elution peak were averaged for each sample, data were analysed using ATSAS 45 , and Guinier plots were linear for s·Rg < 1.3 (Supplementary Figure 4 ). The theoretical scattering curves for the GFP variants were calculated from the refined crystal structure coordinates using CRYSOL 46 . Experimental data were fitted to theoretical scattering curves calculated from the refined usGFP structure coordinates, as this was the most complete structural model.
FP characterisation
Absorption and fluorescence spectra of purified FPs were measured using a CLARIOstar plate reader (BMG Labtech, Ortenberg, Germany) with samples in clear bottom, black, non-binding 96 well plates (Greiner Bio One, Kremsmünster, Austria). Protein concentrations were determined using a Direct Detect spectrometer (Millipore) and absorbance measurements at 280 nm. Thermostability measurements were conducted as previously described 18 . Briefly, purified proteins were diluted to 10 µg mL −1 in 100 mM NaCl, 1% SDS, 50 mM Tris-HCl pH 7.5. Each protein was aliquoted into 96 well PCR plates (100 µL per well), and the samples were heated at specified temperatures using a gradient PCR thermocycler for 30 min and cooled to 10 °C. Plates were placed on ice, samples were transferred to black non-binding 96 well plates (Greiner one, Kremsmünster, Austria) and the residual fluorescence measured in a POLARstar OMEGA plate reader (BMG Labtech, Ortenberg, Germany) with excitation at 488/12 nm and emission at 520 nm. Fluorescence intensities were normalised to samples heated at 95 °C and unheated at 4 °C as 0% and 100% max fluorescence, respectively. Apparent melting temperatures (T m ) were determined by fitting the data to Boltzmann sigmoidal functions with Graphpad Prism 6. T m values indicated are the mean and SEM of three independent denaturation experiments. Fluorescence in the presence of fixatives sfGFP, usGFP, or muGFP were subcloned into pcDNA3.1+ (Life Technologies, Mulgrave, Australia) and transfected into HEK293 cells plated onto poly-lysine coated Nunc™ 96-well black-walled plates (Thermo Fisher Scientific, Victoria, Australia) using FuGENE ® HD reagent (Promega, Sydney, Australia), according to the manufacturer’s instructions. GFP protein was transiently expressed for 48 h and cells were treated with PBS or fixed for 20 min at 4 °C with paraformaldehyde (PFA) freshly prepared from 16% concentrated formaldehyde ampules (Thermo Fisher Scientific, Aus.), or PFA combined with common immunohistochemistry fixatives: gluteraldehyde (GA; 5% from 25% EM grade solution, Electron Microscopy Sciences, PA, USA) or 50% methanol (Me). Cells were washed 3 times with cold PBS before imaging. GFP expression in mammalian cells was imaged before and after fixation using the Operetta® High Content Imaging System (Perkin Elmer, USA). Images for each experiment were acquired on different days with independent transfections, from six locations across the well with a 20xNA objective in wide field mode using bright-field and standard GFP filter settings (ex. 460–490 nm and em. 500–550 nm). The mean GFP intensity was obtained for cells greater than 10 μm in size and greater than 200 fluorescence units from a 16-bit image. The mean fluorescence intensity range was between 2000–4000 units per cell, and data expressed as a mean (± sem) percentage of unfixed, PBS-treated cells. Where fixation led to the complete loss of fluorescence, a region of interest was assigned a background value of 200 mean fluorescent units.
Whole mouse brain clearing and imaging
The muGFP encoding gene was cloned into a rAAV vector (pAM-DCA-EcoRI-EGFP 47 ), by replacing the EGFP gene, making pAM-DCA-EcoRI-muGFP. The pAM-DCA-EcoRI-EGFP and pAM-DCA-EcoRI-muGFP viral vectors were packaged into rAAV mosaic serotype 1/2 capsids, and the resultant rAAV1/2 preparations were harvested, purified, and the viral titres assessed as described previously 47 . The combination of the CMV enhancer/chicken β-actin promoter with the AAV1/2 serotype has been previously shown to be highly effective for specific neuronal targeting 48 . Injection of rAAV1/2-EGFP and rAAV1/2-muGFP was performed as described previously 49 . Mice at postnatal age 4–6 weeks were anaesthetised with isoflurane (Delvet, Seven Hills, NSW, Australia). A total of 100 nL virus was injected in the primary somatosensory cortex at 0.5 mm, 1 mm and 1.5 mm from pia, and brains were harvested after two weeks. Uncleared/Sca l e: mice were deeply anaesthetised with sodium pentobarbitone (100 mg/kg; Virbac, Milperra, NSW, Australia) and transcardially perfused with 30 mL 0.1 M phosphate buffer (PB) followed by 25 mL 4% PFA in PB. Brains were postfixed for two days and sectioned with a vibratome. 100 μm sections were collected for the uncleared control, and a 2 mm section was cut from the same brain for Sca l eA2 clearing. Uncleared control samples were mounted in Antifade Gold (Thermofisher). Sca l eA2 samples were placed in Sca l eA2 medium (Olympus) and incubated for one week at 4 °C with daily medium changes. CLARITY: mice were deeply anaesthetised as above and placed on ice. Mice were then perfused transcardially with 30 mL ice-cold phosphate buffered saline (PBS) followed by 25 mL ice-cold CLARITY hydrogel 14 . Whole brains were rapidly extracted and immediately submerged in 25 mL ice-cold hydrogel solution and post-fixed for 1 week in the dark. To prepare 3 mm-thick coronal blocks of mouse brain for clearing of sectioned brains, brains were cut into 3 mm-thick blocks using a mouse brain matrix. Hydrogel polymerization was then initiated for both whole brains and 3 mm sections by increasing the hydrogel solution temperature to 37 °C for ∼3 h. Embedded tissue was gently extracted from the gel, followed by 2 × 24 h washes in 50 ml CLARITY clearing solution (4% SDS and 0.2 mM borate, both Sigma Aldrich, St. Louis, Missouri, USA; pH 8.5) at room temperature to wash-out excess monomers, PFA and initiator. Whole-brains and 3 mm thick sections were incubated (55 °C, shaking at 0.25 g) in 2 L or 1 L of CLARITY clearing solution, respectively, and CLARITY clearing solution was replaced weekly (for 4–5 weeks for whole brains and 3 weeks for 3 mm brain sections). Whole brains and 3 mm brain sections were rinsed in PBS with 0.1% Tween-20 (Sigma Aldrich) for several days and then immersed in 80% glycerol for 24 h prior to imaging. Quantification of the fluorescence intensities of EGFP and muGFP in pre- and post-cleared tissue sections was achieved by importing microscopy data from two mice for each sample group into Bitplane Imaris (version 8.4.1). Somata were detected using the Imaris FilamentTracer module and underwent subsequent mean sum intensity measurement with the Imaris MeasurementPro module. The FilamentTracer module detects and quantifies background fluorescence so that it can be excluded in filament tracing. Thus, background fluorescence subtraction was not necessary. In addition, background fluorescence levels of samples were manually confirmed to be comparable prior to completing filament detection and fluorescence quantification. 1.4 mm confocal stacks were acquired with 8 µm steps, using a Zeiss LSM 780 confocal microscope (Carl Zeiss AG, Oberkochen, Germany) using a 20x/0.8 air lens, or a 20x/1.0 NA water immersion objective with Sca l eA2 medium (Sca l e) or 80% glycerol (CLARITY) as the immersion medium. Stacks (Fig. 7E and F ) are coloured in an arbitrary way to differentiate between the bottom and top of the stack. All animal studies were performed in accordance with the Prevention of Cruelty to Animals Act (2004), under the guidelines of the National Health and Medical Research Council Code of Practice for the Care and Use of Animals for Experimental Purposes in Australia (2013) and approved by The Florey Animal Ethics Committee. All efforts were made to minimize animal suffering and reduce the number of animals used. Animal studies are reported in compliance with the ARRIVE guidelines.
Data availability
Coordinates and structure factors for usGFP and muGFP have been deposited in the PDB with accession codes 5JZK and 5JZL, respectively.
Electronic supplementary material Supplementary Information
📊 Figures
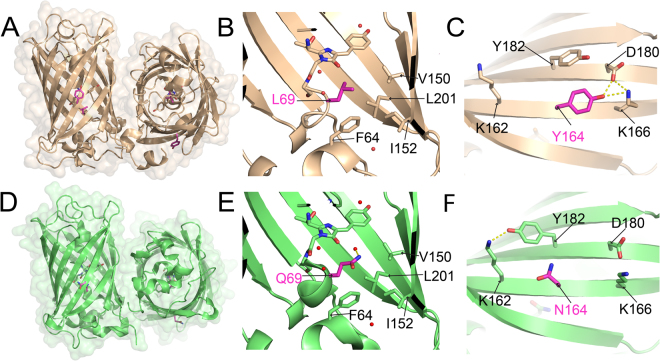
Figure 1
The crystal structures of sfGFP and usGFP. ( A ) Crystal structure of usGFP (orange; PDB ID: 5JZK) showing the dimeric crystallographic asymmetric unit. The chromophore is shown in stick representatio...
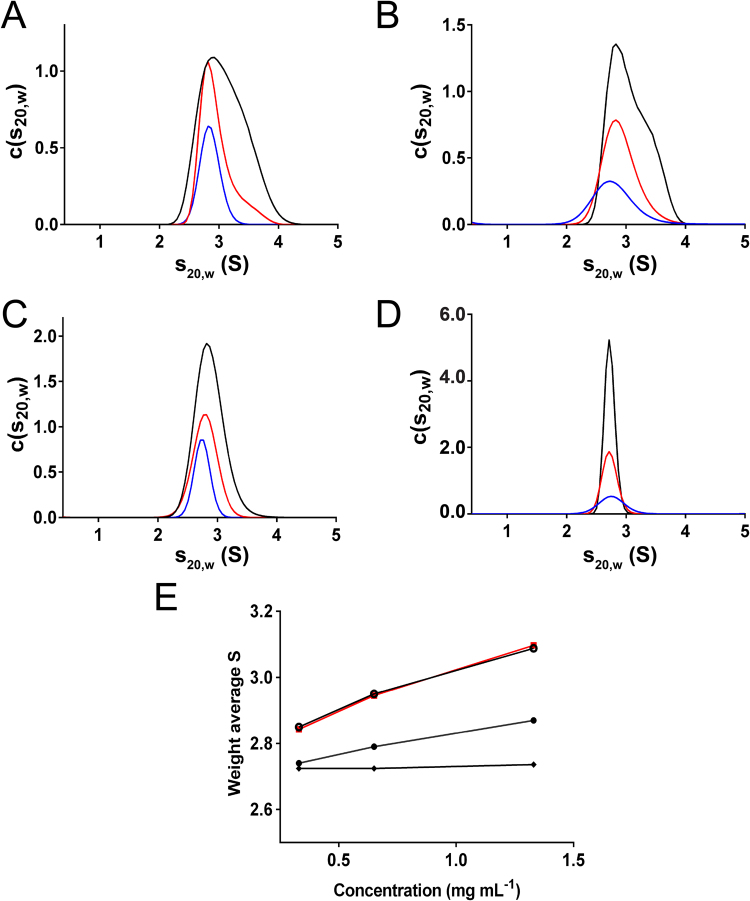
Figure 2
Sedimentation velocity analysis and concentration-dependent self-association of usGFP, sfGFP, EGFP and muGFP. Standardised continuous sedimentation coefficient [c(s 20 , w )] distributions for ( A ) u...
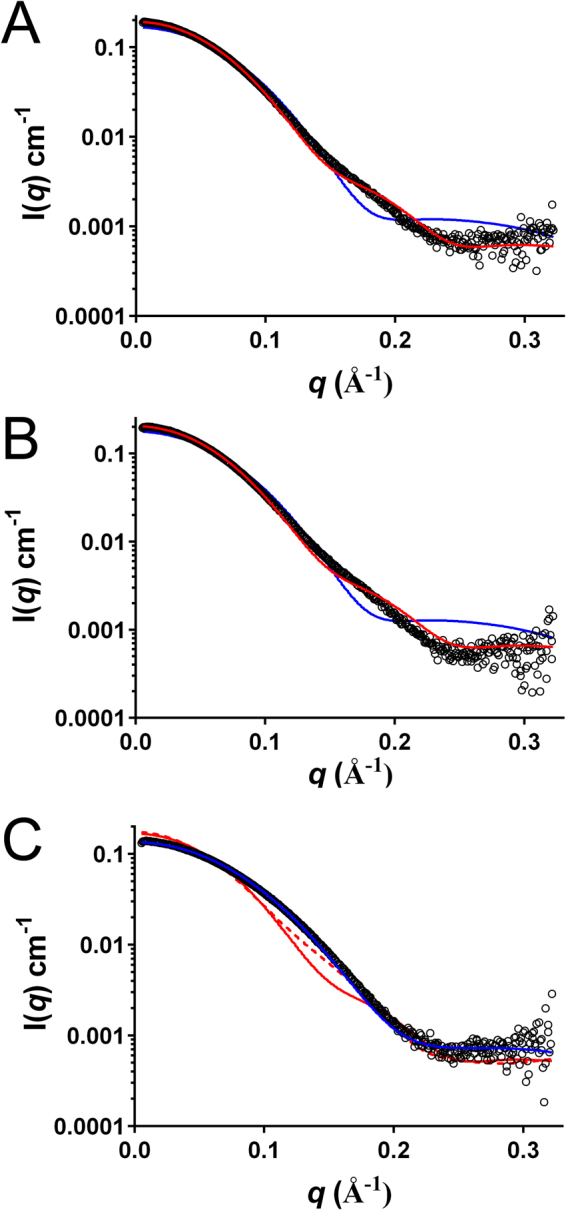
Figure 3
SAXS analysis of usGFP, sfGFP and muGFP. Experimental scattering data (open circles) for ( A ) usGFP ( B ) sfGFP and ( C ) muGFP are overlaid with fits to theoretical scattering profiles calculated wi...
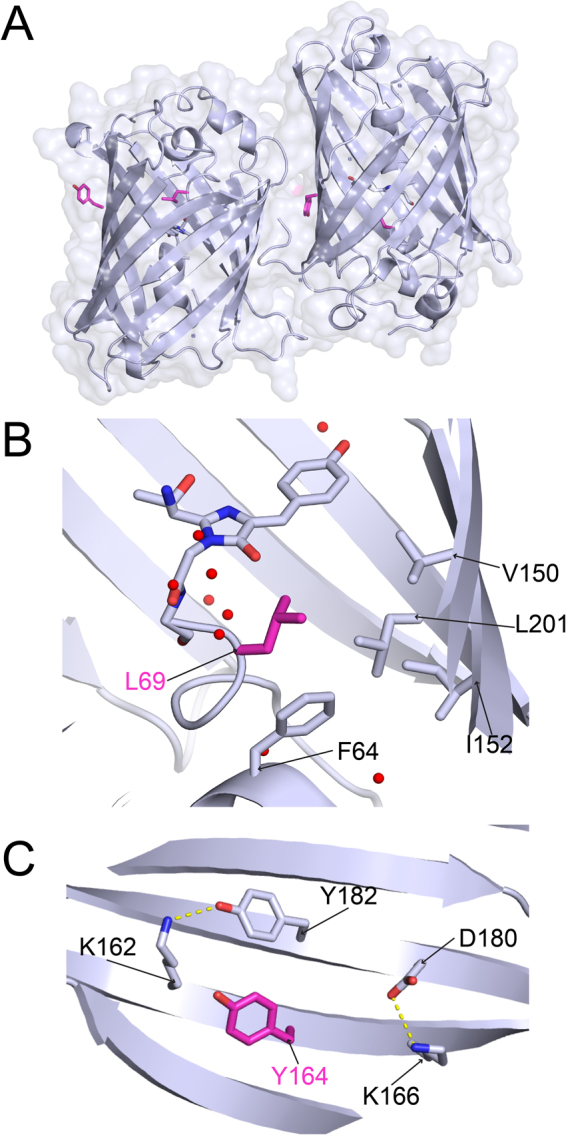
Figure 4
The crystal structure of muGFP. ( A ) The crystal structure of muGFP (PDB ID: 5JZL). The two molecules of the asymmetric unit were oriented with the u03b2-barrel axes approximately parallel to one ano...
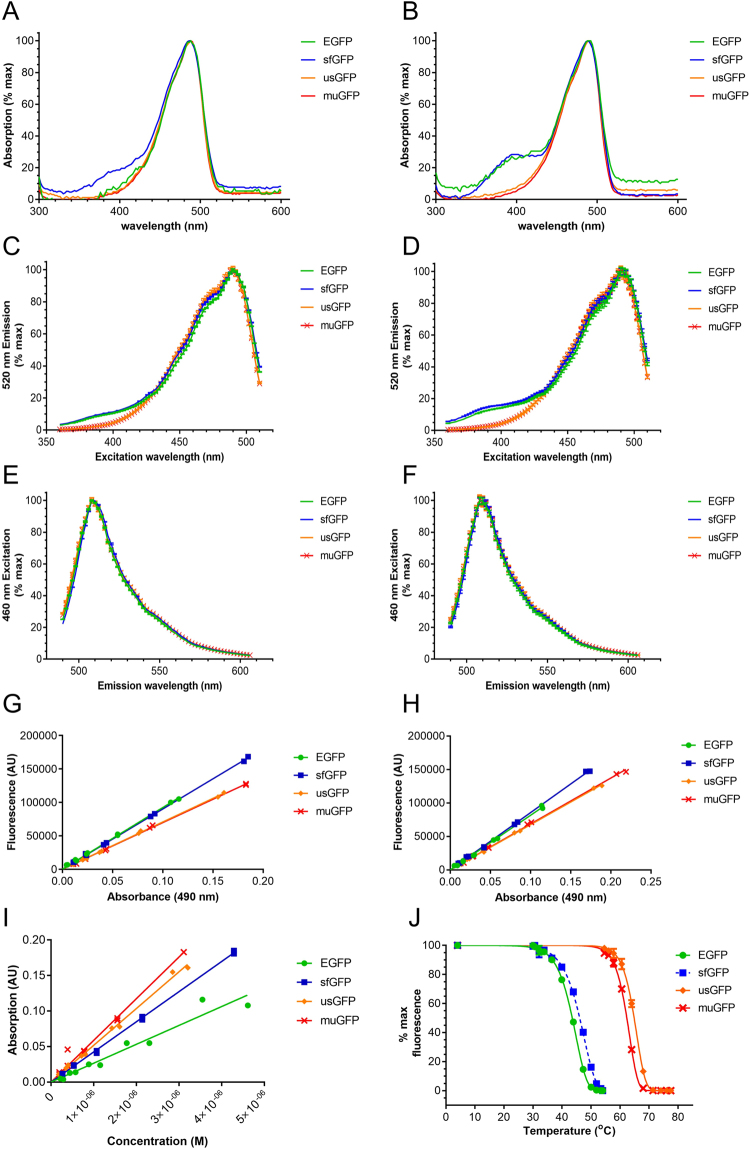
Figure 5
Spectral and stability characteristics of FPs. Purified EGFP (green symbols and lines), sfGFP (blue symbols and lines), usGFP (orange symbols and lines) and muGFP (red symbols and lines) were used to ...
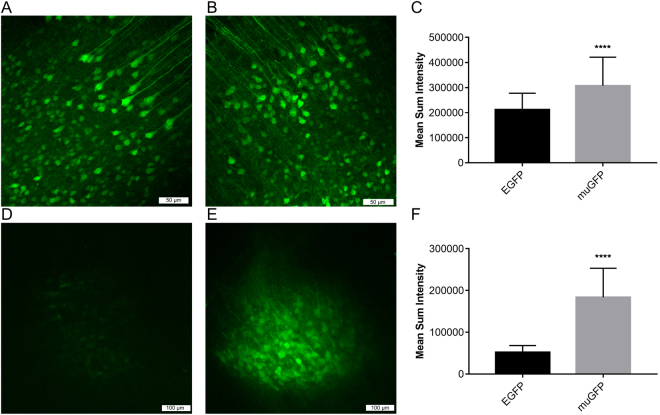
Figure 6
Confocal imaging and fluorescence intensity quantification of pre- and post-CLARITY cleared sections of mouse cortex expressing EGFP and muGFP. Neurons of the primary somatosensory cortex of four mice...
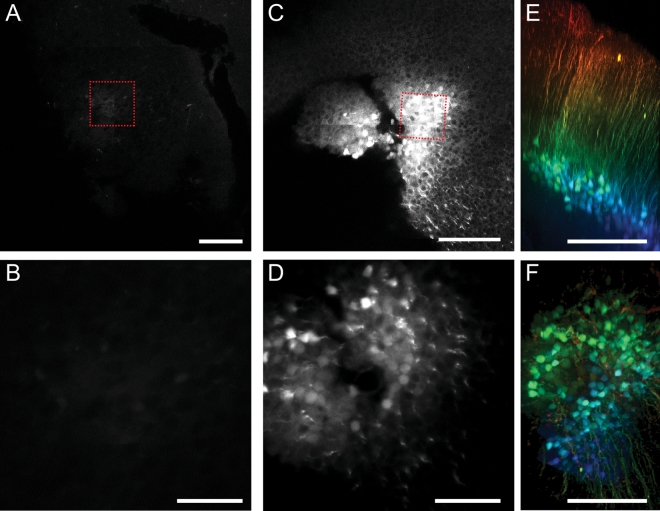
Figure 7
Confocal imaging of a representative CLARITY cleared whole mouse brain expressing EGFP and muGFP. The primary somatosensory cortex was virally transduced with EGFP in the left hemisphere ( A u2013 D )...
Figure images are served from the NIH/NLM PubMed Central Open Access Subset or Europe PMC; copyright remains with the publishers and authors.
💬 Discussion
0 commentsNo comments yet. Be the first to start a discussion!
Leave a Comment