Abstract
Fluoroquinolones (FQs) are one of the most important types of antibiotics in the clinical, poultry, and aquaculture industries, and their monitoring is required as the abuse has led to severe issues, such as antibiotic residues and antimicrobial resistance. In this study, we report a voltammetric electronic tongue (ET) for the simultaneous determination of ciprofloxacin, levofloxacin, and moxifloxacin in both pharmaceutical and biological samples. The ET comprises four sensors modified with three different customized molecularly imprinted polymers (MIPs) and a nonimprinted polymer integrated with Au nanoparticle-decorated multiwall carbon nanotubes (Au-fMWCNTs). MWCNTs were first functionalized to serve as a supporting substrate, while the anchored Au nanoparticles acted as a catalyst. Subsequently, MIP films were obtained by electropolymerization of pyrrole in the presence of the different target FQs. The sensors' morphology was characterized by scanning electron microscopy and transmission electron microscopy, while the modification process was followed electrochemically step by step employing [Fe(CN)6]3-/4- as the redox probe. Under the optimal conditions, the MIP(FQs)@Au-fMWCNT sensors exhibited different responses, limits of detection of ca. 1 μM, and a wide detection range up to 300 μM for the three FQs. Lastly, the developed ET presents satisfactory agreement between the expected and obtained values when used for the simultaneous determination of mixtures of the three FQs (R2 ≥0.960, testing subset), which was also applied to the analysis of FQs in commercial pharmaceuticals and spiked human urine samples.
🔬 Techniques
🧪 Sample Preparation
🏭 Microscope Brands
🧪 Reagent Suppliers
💻 Software Details
🏛️ Research Organizations (ROR)
Affiliated research institutions:
📋 Methods
Materials and Reagents
Graphite powder (particle size
📊 Figures
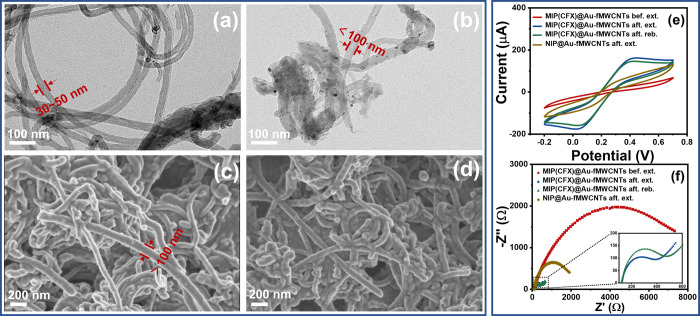
Figure 1
TEM imagesnof (a) fMWCNTs and (b) Au-fMWCNTs. SEM images of MIP(CFX)@Au-fMWCNTsnon GEC (c) before and (d) after the extraction of the template. Electrochemicalncharacterization of the different steps ...
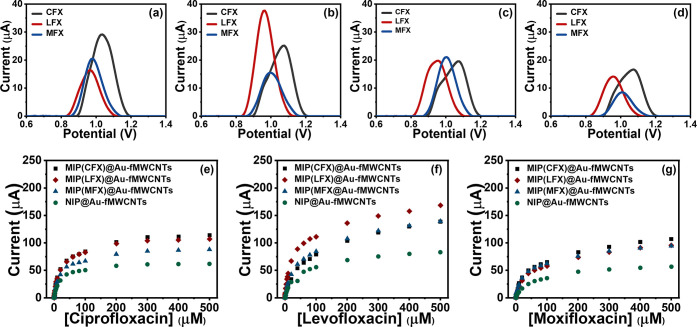
Figure 2
(au2013d) Baseline-correctednDPV curves of (a) MIP(CFX)@Au-fMWCNTs,n(b) MIP(LFX)@Au-fMWCNTs, (c) MIP(MFX)@Au-fMWCNTs, and (d) NIP@Au-fMWCNTsntoward 10 u03bcM solutions of: (black) CFX, (red) LFX, and ...
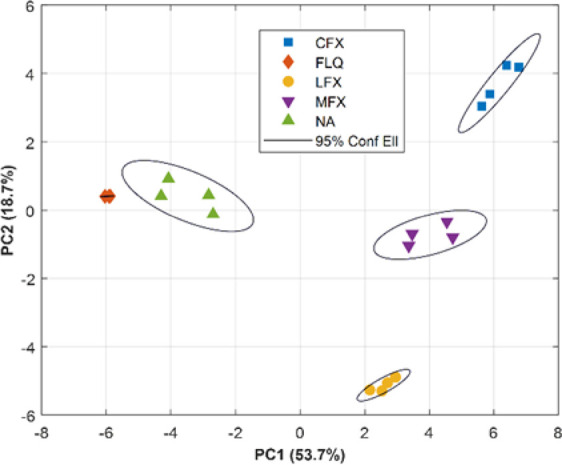
Figure 3
Score plot obtained from DCTu2013PCA of the voltammetricnresponsesnof the MIP-based ET toward five different FQs. Ellipses plotted correspondnto 95% confidence limits for each of the clusters.
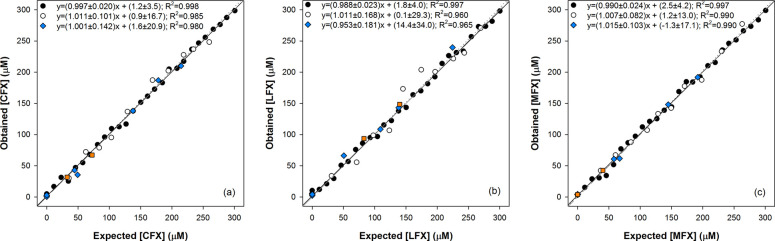
Figure 4
Modeling ability of DCTu2013ANN. Comparisonngraphs of obtainednversus expected concentrations for (a) CFX, (b) LFX, and (c) MFX,nfor both the training (solid circle, solid line) and testing (openncirc...
Figure images are served from the NIH/NLM PubMed Central Open Access Subset or Europe PMC; copyright remains with the publishers and authors.
💬 Discussion
0 commentsNo comments yet. Be the first to start a discussion!
Leave a Comment