Abstract
Antibody-functionalized nanoparticles (NPs) are commonly used to increase the targeting selectivity toward cells of interest. At a molecular level, the number of functional antibodies on the NP surface and the density of receptors on the target cell determine the targeting interaction. To rationally develop selective NPs, the single-molecule quantitation of both parameters is highly desirable. However, techniques able to count molecules with a nanometric resolution are scarce. Here, we developed a labeling approach to quantify the number of functional cetuximabs conjugated to NPs and the expression of epidermal growth factor receptors (EGFRs) in breast cancer cells using direct stochastic optical reconstruction microscopy (dSTORM). The single-molecule resolution of dSTORM allows quantifying molecules at the nanoscale, giving a detailed insight into the distributions of individual NP ligands and cell receptors. Additionally, we predicted the fraction of accessible antibody-conjugated NPs using a geometrical model, showing that the total number exceeds the accessible number of antibodies. Finally, we correlated the NP functionality, cell receptor density, and NP uptake to identify the highest cell uptake selectivity regimes. We conclude that single-molecule functionality mapping using dSTORM provides a molecular understanding of NP targeting, aiding the rational design of selective nanomedicines.
🔬 Techniques
🔭 Microscopes
💻 Software
✨ Fluorophores
🧪 Sample Preparation
🔬 Cell Lines
🏭 Microscope Brands
🧪 Reagent Suppliers
📷 Detectors
💻 Software Details
🏛️ Research Organizations (ROR)
Affiliated research institutions:
📋 Methods
Materials Fluorescent silica NPs (sicastar-greenF) with surface carboxylic acid groups (COOH) of 50, 100, and 150 nm radius were purchased from Micromod Partikeltechnologie GmbH. Cetuximab antibody (Erbitux, Merck) was kindly provided by Prof. Marteen Merkx (Eindhoven University of Technology).
Human EGFR protein
(Fc tag, ACROBiosystems EGR-H5252), Zeba desalting columns (7K MWCO), Alexa Fluor 647 NHS ester, DMEM (high glucose, no phenol red), Penicillin-Streptomycin, Fetal Bovine Serum (qualified), Trypsin-EDTA (0.5%), HEPES buffer (1 M), and Vybrant DiO solution and Nunc cell culture flasks were obtained from Thermo Fisher Scientific. Phosphate buffered saline tablets, 1-ethyl-3-(3-(dimethylamino)propyl)-carbodiimide (EDC), tris(hydroxymethyl)-amino-methane, bovine serum albumin (96% purity), cysteamine, catalase from bovine liver, glucose oxidase, and formaldehyde 37% were purchased from Sigma-Aldrich. Sodium bicarbonate was purchased from Merck. Sodium chloride was purchased from Sanal. MDA-MB-231 and MCF-7 cells were kindly provided by Prof. Jaap den Toonder (Eindhoven University of Technology). MDA-MB-468 cells were obtained from ATCC (HTB-132). Alexa Fluor 647 AffiniPure Goat Anti-Mouse antibody and plain AffiniPure Goat Antimouse antibody were purchased from Jackson Immunoresearch. μ-slide 8-well glass bottom chambered coverslips (#1.5H) were obtained from Ibidi. Poly(lactide- co -glycolide) AP082 (Mn 25000–35000) and Poly(lactide- co -glycolide)- b -poly(ethylene glycol)-carboxylic acid end-cap AI078 (PLGA-PEG-COOH, Mw 20:5 kDa) were purchased from Akina Inc. Poly(lactide- co -glycolide)-methoxy-poly(ethylene glycol) (Mw PLGA:PEG, 30:1 kDa, L:G in PLGA 50:50) was supplied from Biochempeg Scientific Inc.
Show full methods section
Materials Fluorescent silica NPs (sicastar-greenF) with surface carboxylic acid groups (COOH) of 50, 100, and 150 nm radius were purchased from Micromod Partikeltechnologie GmbH. Cetuximab antibody (Erbitux, Merck) was kindly provided by Prof. Marteen Merkx (Eindhoven University of Technology).
Human EGFR protein
(Fc tag, ACROBiosystems EGR-H5252), Zeba desalting columns (7K MWCO), Alexa Fluor 647 NHS ester, DMEM (high glucose, no phenol red), Penicillin-Streptomycin, Fetal Bovine Serum (qualified), Trypsin-EDTA (0.5%), HEPES buffer (1 M), and Vybrant DiO solution and Nunc cell culture flasks were obtained from Thermo Fisher Scientific. Phosphate buffered saline tablets, 1-ethyl-3-(3-(dimethylamino)propyl)-carbodiimide (EDC), tris(hydroxymethyl)-amino-methane, bovine serum albumin (96% purity), cysteamine, catalase from bovine liver, glucose oxidase, and formaldehyde 37% were purchased from Sigma-Aldrich. Sodium bicarbonate was purchased from Merck. Sodium chloride was purchased from Sanal. MDA-MB-231 and MCF-7 cells were kindly provided by Prof. Jaap den Toonder (Eindhoven University of Technology). MDA-MB-468 cells were obtained from ATCC (HTB-132). Alexa Fluor 647 AffiniPure Goat Anti-Mouse antibody and plain AffiniPure Goat Antimouse antibody were purchased from Jackson Immunoresearch. μ-slide 8-well glass bottom chambered coverslips (#1.5H) were obtained from Ibidi. Poly(lactide- co -glycolide) AP082 (Mn 25000–35000) and Poly(lactide- co -glycolide)- b -poly(ethylene glycol)-carboxylic acid end-cap AI078 (PLGA-PEG-COOH, Mw 20:5 kDa) were purchased from Akina Inc. Poly(lactide- co -glycolide)-methoxy-poly(ethylene glycol) (Mw PLGA:PEG, 30:1 kDa, L:G in PLGA 50:50) was supplied from Biochempeg Scientific Inc.
Labeling of Cetuximab and EGFR Protein
Prior to fluorescent labeling, cetuximab was buffer exchanged to sodium bicarbonate (pH 8.4 0.1M) using a Zeba desalting colum. Cetuximab and EGFR protein were incubated with Alexa Fluor 647 NHS ester at a 1:8 mol and 1:5 mol ratio protein/dye, respectively, for 2 h at 22 °C and 400 rpm in a ThermoMixer (Eppendorf). The reaction mixture was purified using two consecutive Zeba desalting columns rinsed with PBS buffer according to the manufacturer’s protocol. The UV–vis of the final products were measured to calculate the degree of labeling with using a NanoDrop One (Thermo) with PBS as the blank measurement. For cetuximab-AF647 and EGFR-AF647, degrees of labeling of 5.4 and 2.4 were obtained, respectively. Conjugation of Cetuximab to Silica-COOH NPs Cetuximab or cetuximab-AF647 was conjugated to silica-COOH NPs in MES buffer (50 mM, pH 5) via 1-ethyl-3-(3-(dimethylamino)propyl)-carbodiimide (EDC) coupling chemistry. First, NPs were washed in 500 μL of MES buffer and centrifuged 10 min at 16 000 g . NPs were resuspended in MES buffer (50 mM, pH 5) containing 2 mM EDC and incubated for 15 min at 22 °C and 400 rpm in a ThermoMixer. NPs were then sonicated for 5 min in a bath sonicator. Next, cetuximab antibody was added to the EDC activated NPs at the desired concentration and incubated for 2 h at 22 °C and 400 rpm in a ThermoMixer. To determine the unspecific cetuximab binding, the same reaction was performed without EDC activation. To conjugate cetuximab antibody to NPs of different sizes, the cetuximab/COOH and EDC/COOH ratio was kept constant (0.68 cetuximab/COOH and 1963 mol EDC/mol COOH). For the concentration range of antibodies, the ratio was kept between 8.6 and 3437 antibodies/NP and the 100 nm radius NPs were used (Table S5 in the Supporting Information ). As a control formulation, silica-COOH NPs of 100 nm radius were incubated with a goat antimouse antibody at low (8.6 antibodies/NP) and high (3437 antibodies/NP) concentrations. Unconjugated antibody was purified by washing with 25 mM HEPES buffer and centrifuging thrice at 16 000 g for 15 min. Silica-cetuximab NPs were resuspended at a final concentration of 1 mg/mL in 25 mM HEPES buffer and stored at 4 °C. Incubation of Silica-Cetuximab NPs with EGFR-AF647 Probe The functionality of cetuximab antibodies conjugated to silica NPs was studied by quantifying the number of EGFR-AF647 probes bound to each NP. Silica-cetuximab NPs were first sonicated in a bath sonicator for 10 min. Next, 25 μL of NPs (1 mg/mL) were incubated with 20 pmol of EGFR probe and 0.5% bovine serum albumin to block unspecific binding for 1 h at 25 °C and 400 rpm in a ThermoMixer. NPs were sonicated in a bath sonicator for 5 min to aid redispersion and imaged the same day. Optical Setup dSTORM imaging was performed with a Nikon N-STORM system configured for TIRF imaging and equipped with a perfect focus system. AF647-labeled proteins were illuminated using a 647 nm laser (170 mW), and sicastar-greenF NPs were illuminated using a 488 nm laser (90 mW) with an adjusted TIRF angle to maximize the signal-to-noise ratio. No UV activation was used. A Nikon 100X, 1.4 NA oil immersion objective was used to collect the fluorescence signal, which was passed through a quad-band-pass dichroic filter (97335, Nikon) and recorded on an Andor EMCCD camera (ixon3) with pixel size 160 nm and a region of interest of 256 × 256 pixels. dSTORM Imaging of NPs Coverslips (22 mm × 22 mm, #1.5) were sonicated in isopropanol for 20 min and dried under nitrogen flow, and microscope slides (76 mm × 26 mm, thickness 1 mm) were cleaned using an isopropanol-soaked tissue before each experiment. An imaging chamber was prepared by attaching one coverslip to a microscope slide using double-sided scotch tape. This created a chamber of approximately 20 μL volume. Silica-cetuximab or silica-cetuximab-EGFR NPs were incubated in the imaging chamber and allowed to adsorb for 20–30 min at room temperature. The imaging chamber was rinsed with 200 μL of HEPES buffer (25 mM) to remove nonattached NPs and subsequently rinsed with 100 μL of STORM buffer 49 (50 mM Tris pH 8, 10 mM NaCl, 10% w/v glucose, 50 mM cysteamine, 0.5 mg/mL glucose oxidase, 40 μg/mL catalase). Flow chambers were sealed with nail polish to prevent solvent evaporation. TIRF images of the 488 and 647 channel were acquired before dSTORM at 2% laser power and 100 ms exposure. For dSTORM, samples with cetuximab-AF647 and EGFR-AF647 were acquired for 30 000 frames at 30 ms exposure time and 100% laser power for the 647 channel. The fluorescent silica NPs were used to identify the NP position and drift correction of the final image by collecting one frame every 100 frames in the 488 channel at the same integration time and 5–10% laser power. A minimum of 100 NPs were imaged for each condition in 2 to 4 different fields of view. To estimate the number of blinks per cetuximab-647 or EGFR-647 protein, a calibration was performed under the same imaging conditions at very low protein concentration (8.76 pM and 4.32 pM, respectively) attached to a cover glass. dSTORM Analysis of NPs dSTORM images were analyzed with the Nikon NIS elements software (version 5.21.01). dSTORM localizations were detected by Gaussian fitting of the blinking dyes, with a minimum intensity height threshold of 400 for the 647 channel of cetuximab-AF647 NPs, 300 for the 647 channel of EGFR-AF647 NPs, and 150 for the 488 channel in both cases. Analysis was started at frame number 400 for cetuximab-AF647 imaging and 200 for EGFR-AF647 imaging to eliminate nonblinking behavior in the first instances of the sample illumination. Molecules detected in 5 consecutive frames were counted as a single fluorophore to prevent overcounting of blinks from the same dye. Molecules detected for more than 5 consecutive frames were discarded. A density filter of minimum 10 localization in a radius of 200 nm was applied to remove the background signal originating from free dye or labeled proteins attached to the cover glass. The dSTORM localization list was imported and run through a custom MATLAB script to quantify the number of localizations for each NP. The code is extensively reported elsewhere. 23 Briefly, a mean shift clustering algorithm was applied to cluster the 488 localizations from the silica NPs. The bandwidth was adjusted to 100 nm, and clusters with less than 20 localizations were discarded. Next, the number of 647 localizations were counted around each NP center. For 50, 100, and 150 nm radius NPs the maximum counting distance was a 130, 180, and 200 nm radius, respectively. Aggregates with an unrealistic size were filtered out. The analysis output provided the number of localizations in the 647 channel and the NP radius. The data were plotted in scatter plots or histograms using Origin 2020. Data histograms were fitted with the same software. For single protein calibration, localizations were clustered using the mean shift clustering algorithm 23 with a bandwidth of 100 nm and a minimum of 2 points per cluster separated in a maximum radius of 15 nm. The number of blinks per single protein were plotted in a histogram, and an exponential decay function was fitted to calculate the mean number of blinks per protein using the Origin 2020 software. Immunostaining of EGFR in Breast Cancer Cell Lines MCF-7, MDA-MB-231, and MDA-MB-468 cells were cultured in DMEM (high glucose, no phenol red) supplemented with 10% Fetal bovine serum and penicillin-streptomycin (100 U/mL) at 37 °C and 5% CO 2 . For imaging, cells were detached from culture flasks using trypsin and seeded at a density of 50 000 cells/well in Ibidi μ-slide 8-well glass bottom chambered coverslips. After 48 h, cells were washed once with warm PBS and fixated using 3.7% formaldehyde solution for 10 min at room temperature. After fixation, cells were washed thrice with PBS and blocked with 5% BSA solution in PBS overnight at 4 °C or 1 h at 22 °C. Primary antibody staining with cetuximab was performed for 2 h at room temperature using 10 μg/mL cetuximab and 5% BSA in a volume of 150 μL/well. Subsequently, cells were rinsed thrice with PBS and stained with a AF647 secondary antimouse antibody diluted 1:150 in PBS containing 5% BSA in a total volume of 150 μL/well and incubated for 1 h at room temperature. Cells were rinsed with PBS thrice and postfixated using 1% formaldehyde solution for 10 min at room temperature. Finally, cells were washed thrice with PBS and stored at 4 °C before imaging. As a control for unspecific binding, cells were incubated with AF647 secondary antimouse antibody only. To obtain isolated labeled EGFR receptors for STORM calibration MDA-MB-468 cells were stained at low cetuximab concentration (0.01 μg/mL), while secondary antibody concentration was maintained to be constant. dSTORM Imaging of Cells Before dSTORM imaging of cells, the PBS storage solution was substituted for STORM buffer (5% w/v glucose, 100 mM cysteamine, 0.5 mg/mL glucose oxidase, 40 μg/mL catalase in PBS). Cells were acquired for 20 000 frames at 16 ms exposure time and 100% laser power for the 647 channel. Between 10 and 11 cells were imaged for each cell type and between 3 and 6 cells for each control (secondary antibody only). dSTORM Analysis of Cells dSTORM images were analyzed with the Nikon NIS elements software (version 5.21.01). dSTORM localizations were detected by Gaussian fitting of the blinking dyes, with a minimum intensity height threshold of 150 for the 647 channel. Analysis was started at frame number 100 to eliminate nonblinking behavior in the first instances of the sample illumination. Molecules detected in 5 consecutive frames were counted as a single fluorophore to prevent overcounting of blinks from the same dye. Molecules detected for more than 5 consecutive frames were discarded. Drift correction was performed in the NIS elements software, based on an autocorrelation function. The dSTORM localization list was imported and run through a custom MATLAB script to quantify localizations’ density in each cell type. Ten ROIs were selected manually and stochastically per cell by drawing a polygonal area on the low-resolution fluorescent or bright field image. Finally, the density of dSTORM localizations in the defined areas were obtained. ROIs with an unrealistic number of localizations were excluded from the analysis. To determine the number of blinks per EGFR receptor, a low concentration of cetuximab staining (0.01 μg/mL) was performed on MDA-MB-468 cells to obtain isolated receptors. 39 The resulting dSTORM localizations from these samples were analyzed with a custom MATLAB script. Localizations were clustered using the mean shift clustering algorithm described for single-protein calibration using a bandwidth of 100 nm and a minimum of 2 points per cluster. Clusters bigger than a 100 nm radius were discarded from the analysis. The resulting localizations per cluster, corresponding to isolated receptors, were plotted in a histogram, and the distribution of localizations per receptor was fitted using an exponential decay function in the Origin 2020 software to extract the mean number of localizations per receptor. NP Uptake by Flow Cytometry MCF-7, MDA-MB-231, and MDA-MB-468 cells were in a 24-well plate at a density of 95 000 cells/well and incubated for 48 h at 37 °C and 5% CO 2 . Cells were washed once with PBS and incubated with different NP formulations at a final concentration of 150 μg/mL NPs in DMEM without FBS (final volume 500 μL/well) for 90 min at 37 °C and 5% CO 2 . For comparison, NP uptake was additionally performed in the presence of 10% FBS (Figure S15 in Supporting Information ). Cells were washed once with PBS before detachment and centrifuged at 300 g for 5 min. Cells were resuspended in 300 μL of BSA 1% in PBS and kept on ice before the flow cytometry measurement. For each condition, a minimum of 20 000 cells were measured on a BD FACSCanto II configured for FITC detection. Flow cytometry data were analyzed using FlowJo (version 10.7.1). The gating strategy used is shown in Figure S16 in the Supporting Information .
Materials Fluorescent silica NPs (sicastar-greenF) with surface carboxylic acid groups (COOH) of 50, 100, and 150 nm radius were purchased from Micromod Partikeltechnologie GmbH. Cetuximab antibody (Erbitux, Merck) was kindly provided by Prof. Marteen Merkx (Eindhoven University of Technology).
Human EGFR protein
(Fc tag, ACROBiosystems EGR-H5252), Zeba desalting columns (7K MWCO), Alexa Fluor 647 NHS ester, DMEM (high glucose, no phenol red), Penicillin-Streptomycin, Fetal Bovine Serum (qualified), Trypsin-EDTA (0.5%), HEPES buffer (1 M), and Vybrant DiO solution and Nunc cell culture flasks were obtained from Thermo Fisher Scientific. Phosphate buffered saline tablets, 1-ethyl-3-(3-(dimethylamino)propyl)-carbodiimide (EDC), tris(hydroxymethyl)-amino-methane, bovine serum albumin (96% purity), cysteamine, catalase from bovine liver, glucose oxidase, and formaldehyde 37% were purchased from Sigma-Aldrich. Sodium bicarbonate was purchased from Merck. Sodium chloride was purchased from Sanal. MDA-MB-231 and MCF-7 cells were kindly provided by Prof. Jaap den Toonder (Eindhoven University of Technology). MDA-MB-468 cells were obtained from ATCC (HTB-132). Alexa Fluor 647 AffiniPure Goat Anti-Mouse antibody and plain AffiniPure Goat Antimouse antibody were purchased from Jackson Immunoresearch. μ-slide 8-well glass bottom chambered coverslips (#1.5H) were obtained from Ibidi. Poly(lactide- co -glycolide) AP082 (Mn 25000–35000) and Poly(lactide- co -glycolide)- b -poly(ethylene glycol)-carboxylic acid end-cap AI078 (PLGA-PEG-COOH, Mw 20:5 kDa) were purchased from Akina Inc. Poly(lactide- co -glycolide)-methoxy-poly(ethylene glycol) (Mw PLGA:PEG, 30:1 kDa, L:G in PLGA 50:50) was supplied from Biochempeg Scientific Inc.
Supplementary Material nn1c08277_si_001.pdf
📊 Figures
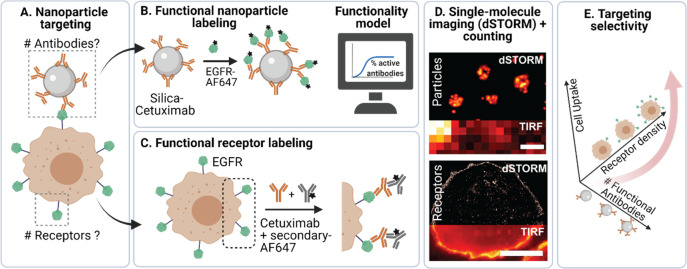
Figure 1
Schematic representationnof dSTORM imaging and quantification ofnfunctional silica-cetuximab NPs and cell surface EGFR. (A) To understandnNP targeting efficiency, information about the functional numb...
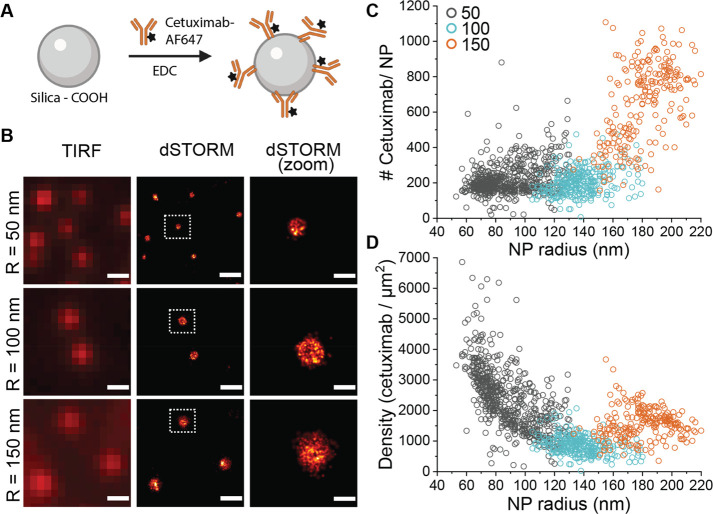
Figure 2
dSTORM imaging of cetuximab-AF647-conjugated silica NPs.n(A) Schematicnrepresentation of cetuximab-AF647 conjugation to silica-COOH NPs mediatednby EDC coupling chemistry. (B) dSTORM imaging of silica...
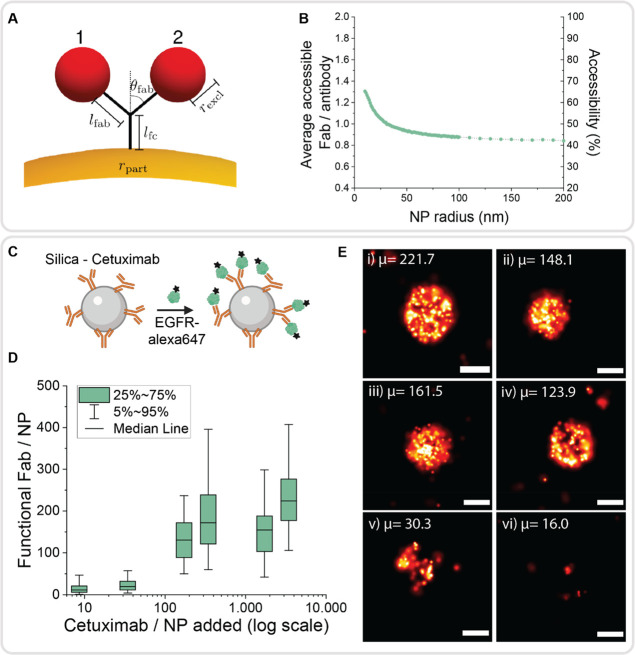
Figure 3
Functionality of silica-cetuximab NPs calculatednusing a geometricalnmodel (Au2013B) and measured experimentally using a labeled EGFRnprobe (Cu2013E). (A) Schematic representation of the geometricalnm...
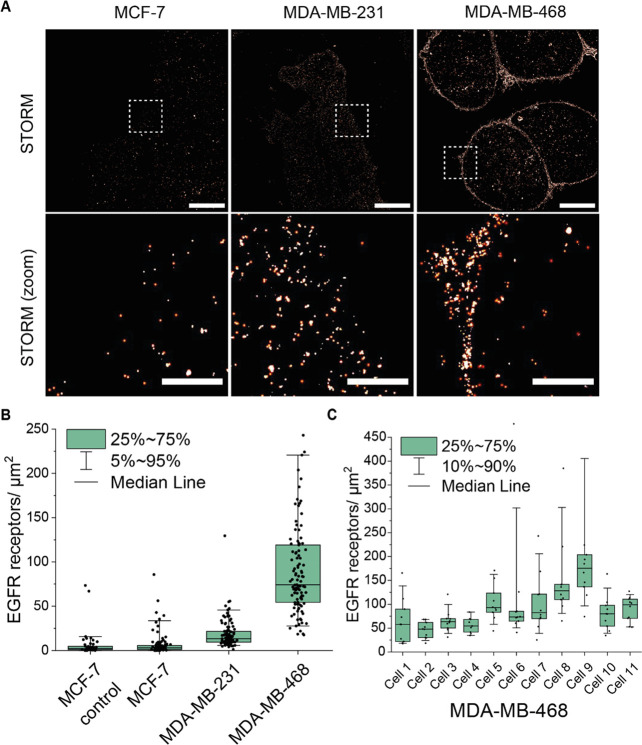
Figure 4
EGFR expression profilesnof breast cancer cell lines MCF-7, MDA-MB-231,nand MDA-MB-468. (A) Representative dSTORM images of EGFR receptorsnstained with cetuximab and antimouse-AF647 antibody of MCF-7,...
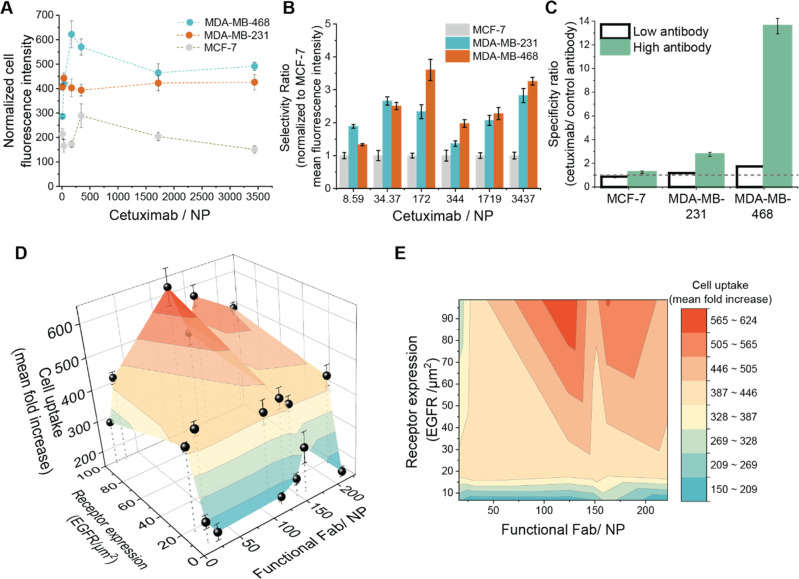
Figure 5
Targeting properties of silica-cetuximab NPs (100 nm radius) tonbreast cancer cell lines measured by flow cytometry. (A) Normalizedncell fluorescence intensity after 90 min of silica-cetuximab incubat...
Figure images are served from the NIH/NLM PubMed Central Open Access Subset or Europe PMC; copyright remains with the publishers and authors.
💬 Discussion
0 commentsNo comments yet. Be the first to start a discussion!
Leave a Comment