Abstract
Despite key roles in sister chromatid cohesion and chromosome organization, the mechanism by which cohesin rings are loaded onto DNA is still unknown. Here we combine biochemical approaches and cryoelectron microscopy (cryo-EM) to visualize a cohesin loading intermediate in which DNA is locked between two gates that lead into the cohesin ring. Building on this structural framework, we design experiments to establish the order of events during cohesin loading. In an initial step, DNA traverses an N-terminal kleisin gate that is first opened upon ATP binding and then closed as the cohesin loader locks the DNA against the ATPase gate. ATP hydrolysis will lead to ATPase gate opening to complete DNA entry. Whether DNA loading is successful or results in loop extrusion might be dictated by a conserved kleisin N-terminal tail that guides the DNA through the kleisin gate. Our results establish the molecular basis for cohesin loading onto DNA.
🔬 Techniques
🔭 Microscopes
🧬 Organisms
💻 Software
✨ Fluorophores
🧪 Sample Preparation
🔬 Cell Lines
🏭 Microscope Brands
🧪 Reagent Suppliers
📷 Detectors
💻 Software Details
💾 Data Repositories
🏛️ Research Organizations (ROR)
Affiliated research institutions:
📋 Methods
Key Resources Table REAGENT or RESOURCE SOURCE IDENTIFIER Antibodies
Mouse monoclonal anti-V5 Bio-Rad Cat# MCA1360
Mouse monoclonal anti-HA (12CA5) Sigma-Aldrich Cat# 11583816001 Mouse monoclonal anti-E2a (5E11) Abcam Cat# ab977 Rabbit polyclonal anti-Rad21 (fission yeast) BioAcademia Cat# 63-139 Anti-rabbit IgG (HRP-conjugated) GE Healthcare Cat# NA934-1ML Anti-mouse IgG (HRP-conjugated) GE Healthcare Cat# NA931 Chemicals, Peptides, and Recombinant Proteins Phenylmethylsulfonyl fluoride (PMSF) Sigma-Aldrich Cat# 11359061001 cOmplete EDTA-Free Protease Inhibitor Cocktail Sigma-Aldrich Cat# 11873580001 CLIP-Surface 547 New England BioLabs Cat# S9233S SNAP-Surface Alexa Fluor 647 New England BioLabs Cat# S9136S BC-NH2 New England BioLabs Cat# S9236S BG-NH2 New England BioLabs Cat# S9148S DTT Sigma-Aldrich Cat# 43815-5G BSA ThermoFisher Cat# AM2616 poly-dIdC:dIdC Sigma-Aldrich Cat# P4929-10UN biotin Sigma-Aldrich Cat# B4501-1G ATP Sigma-Aldrich Cat# A2383 ADP Sigma-Aldrich Cat# A2754 Beryllium sulrate tetrahydrate VWR international LTD Cat# 16104.14 Sodium fluoride 0.5 M Solution Sigma-Aldrich Cat# 67414-1ML-F Aluminum chloride Sigma-Aldrich Cat# 449598-5G Sodium Orthovanadate New England BioLabs Cat# P0758S InstantBlue Sigma-Aldrich Cat# ISB1L-1L SYBR Gold Nucleic Acid Gel Stain ThermoFisher Cat# S11494 Protease K TaKaRa Cat# 9034 AcTEV protease ThermoFisher Cat# 12575015 PstI-HF New England BioLabs Cat# R3140S T7 DNA polymerase New England BioLabs Cat# M0274S CloneAmp HiFi PCR Premix TaKaRa Cat# 639298 GoTaq Taq G2 DNA Polymerase Promega Cat# M7845 Deoxynucleotide Set Sigma-Aldrich Cat# DNTP100-1KT Aminoallyl-dUTP Stratech Scientific Ltd Cat# NU-803S-JEN-10ul SDAD (NHS-SS-Diazirine) ThermoFisher Cat# 26169 SDA (NHS-Diazirine) ThermoFisher Cat# 26167 Lysyl EndopeptidaseR (Lys-C) FUJIFILM Cat# 129-02541 Ammonium bicarbonate Sigma-Aldrich Cat# 09830-500G Fission yeast cohesin (Psm1-Psm3-Rad21-Psc3) Murayama and Uhlmann, 2014 N/A Fission yeast EQ-cohesin (Psm1E1161Q-Psm3E1128Q- Rad21-Psc3) Murayama and Uhlmann, 2015 N/A Fission yeast KKQQ cohesin (Psm1-Psm3K105Q/K106Q- Rad21-Psc3) Murayama and Uhlmann, 2015 N/A Fission yeast Mis4-Ssl3 Murayama and Uhlmann, 2014 N/A Fission yeast Mis4 N-191 Chao et al., 2015 N/A Fission yeast Pds5 Murayama and Uhlmann, 2015 N/A Fission yeast Wapl Murayama and Uhlmann, 2015 N/A Critical Commercial Assays SilverQuest Silver Staining Kit ThermoFisher Cat# LC6070 InFusion HD cloning kit TaKaRa Cat# 638910 Human IgG-Agarose Sigma-Aldrich Cat# A6284-5ML Glutathione Sepharose 4B GE Healthcare Cat# 17075601 Ni-NTA Superflow (25 ml) QIAGEN Cat# 30410 HiTrap Heparin HP 1 ml GE Healthcare Cat# 17040601 Superdex 200 Increase 10/300 GL GE Healthcare Cat# 28990944 Superdex 75 Increase 10/300GL GE Healthcare Cat# 29148721 Superose 6, 10/300 GL GE Healthcare Cat# 17517201 Amicon Ultra-4 centrifuge filter unit Sigma-Aldrich Cat# UFC810096 Slide-A-Lyzer MINI Dialysis Devices, 20K MWCO ThermoFisher Cat# 69555 Dynabeads M-280 Streptavidin ThermoFisher Cat#11206D Dynabeads Protein A ThermoFisher Cat#10002D ECL Prime Western Blotting Detection Regent GE Healthcare Cat# RPN2232 Zeba Spin Desalting Columns, 7K MWCO, 0.5 mL ThermoFisher Cat# 89882 MICROSPIN S-400 HR, 50 COLUMNS GE Healthcare Cat#GE27-5140-01 TLC PEI Cellulose F Merck Cat#105725 Experimental Models: Organisms/Strains All yeast strains used in this study are listed in Table S1 . Lab stock and this study N/A Escherichia coli : BL21 (DE3) codonPlus RIPL chemical competent cells Agilent Technologies Cat#230280 Oligonucleotides TH1:[bioteg]agcgcagcgagtcagtgagcgagg Sigma-Aldrich N/A TH2:cggtcgttcggctgcggcgagcgg Sigma-Aldrich N/A TH3: [bioteg]cggtcgttcggctgcggcgagcgg Sigma-Aldrich N/A TH4:agcgcagcgagtcagtgagcgagg Sigma-Aldrich N/A TH5:cctttttacggttcctggcc Sigma-Aldrich N/A Recombinant DNA pBluescript II KS(+) Murayama and Uhlmann, 2014 , 2015 , Murayama et al., 2018 N/A ssDNA of pBluescript II KS(+) Murayama et al., 2018 N/A M13KO7 Helper Phage New England BioLabs Cat# N0315S JM109 competent cells New England BioLabs Cat#E4107 Plasmid: pMis4-PA Murayama and Uhlmann, 2014 N/A Plasmid: pMis4-N191-PA Chao et al., 2015 N/A Plasmid: pSsl3 Murayama and Uhlmann, 2014 N/A Plasmid: pGEX-Wapl Murayama and Uhlmann, 2015 N/A Software and Algorithms Fiji ImageJ open source https://imagej.net/Fiji UCSF ChimeraX Resource for Biocomputing Visualization, and Informatics https://www.cgl.ucsf.edu/chimerax/ PyMOL Schrodinger https://pymol.org/2/ PEAKS X+ Bioinfomatics Solutions Inc. https://www.bioinfor.com/peaks-studio-x-plus/ xiVIEW Rappsilber lab https://xiview.org/xiNET_website/index.php CCBuilder 2.0 open source http://coiledcoils.chm.bris.ac.uk/ccbuilder2/builder Clustal Omega open source https://www.ebi.ac.uk/Tools/msa/clustalo/ Deposited Data Protein-protein crosslink mass spectrometry (CLMS) data PRIDE PXD018608 DNA-protein crosslink mass spectrometry (DPC-MS) PRIDE PXD018600 Negative stain EM map EMDB EMD-10870 cryo-EM map EMDB EMD-10930 cryo-EM atomic coordinates PDB 6YUF Unprocessed gel images presented in this manuscript can be found at https://data.mendeley.com/datasets/9bddfnc7wb/draft?a=41d6ea5b-4cba-4f3e-b9f3-a42dfb09eff4 N/A N/A Resource Availabilty Lead Contact Further information for resources and requests should be directed to and will be fulfilled by the Lead Contact, Frank Uhlmann ( frank.uhlmann@crick.ac.uk ).
Show full methods section
Key Resources Table REAGENT or RESOURCE SOURCE IDENTIFIER Antibodies
Mouse monoclonal anti-V5 Bio-Rad Cat# MCA1360
Mouse monoclonal anti-HA (12CA5) Sigma-Aldrich Cat# 11583816001 Mouse monoclonal anti-E2a (5E11) Abcam Cat# ab977 Rabbit polyclonal anti-Rad21 (fission yeast) BioAcademia Cat# 63-139 Anti-rabbit IgG (HRP-conjugated) GE Healthcare Cat# NA934-1ML Anti-mouse IgG (HRP-conjugated) GE Healthcare Cat# NA931 Chemicals, Peptides, and Recombinant Proteins Phenylmethylsulfonyl fluoride (PMSF) Sigma-Aldrich Cat# 11359061001 cOmplete EDTA-Free Protease Inhibitor Cocktail Sigma-Aldrich Cat# 11873580001 CLIP-Surface 547 New England BioLabs Cat# S9233S SNAP-Surface Alexa Fluor 647 New England BioLabs Cat# S9136S BC-NH2 New England BioLabs Cat# S9236S BG-NH2 New England BioLabs Cat# S9148S DTT Sigma-Aldrich Cat# 43815-5G BSA ThermoFisher Cat# AM2616 poly-dIdC:dIdC Sigma-Aldrich Cat# P4929-10UN biotin Sigma-Aldrich Cat# B4501-1G ATP Sigma-Aldrich Cat# A2383 ADP Sigma-Aldrich Cat# A2754 Beryllium sulrate tetrahydrate VWR international LTD Cat# 16104.14 Sodium fluoride 0.5 M Solution Sigma-Aldrich Cat# 67414-1ML-F Aluminum chloride Sigma-Aldrich Cat# 449598-5G Sodium Orthovanadate New England BioLabs Cat# P0758S InstantBlue Sigma-Aldrich Cat# ISB1L-1L SYBR Gold Nucleic Acid Gel Stain ThermoFisher Cat# S11494 Protease K TaKaRa Cat# 9034 AcTEV protease ThermoFisher Cat# 12575015 PstI-HF New England BioLabs Cat# R3140S T7 DNA polymerase New England BioLabs Cat# M0274S CloneAmp HiFi PCR Premix TaKaRa Cat# 639298 GoTaq Taq G2 DNA Polymerase Promega Cat# M7845 Deoxynucleotide Set Sigma-Aldrich Cat# DNTP100-1KT Aminoallyl-dUTP Stratech Scientific Ltd Cat# NU-803S-JEN-10ul SDAD (NHS-SS-Diazirine) ThermoFisher Cat# 26169 SDA (NHS-Diazirine) ThermoFisher Cat# 26167 Lysyl EndopeptidaseR (Lys-C) FUJIFILM Cat# 129-02541 Ammonium bicarbonate Sigma-Aldrich Cat# 09830-500G Fission yeast cohesin (Psm1-Psm3-Rad21-Psc3) Murayama and Uhlmann, 2014 N/A Fission yeast EQ-cohesin (Psm1E1161Q-Psm3E1128Q- Rad21-Psc3) Murayama and Uhlmann, 2015 N/A Fission yeast KKQQ cohesin (Psm1-Psm3K105Q/K106Q- Rad21-Psc3) Murayama and Uhlmann, 2015 N/A Fission yeast Mis4-Ssl3 Murayama and Uhlmann, 2014 N/A Fission yeast Mis4 N-191 Chao et al., 2015 N/A Fission yeast Pds5 Murayama and Uhlmann, 2015 N/A Fission yeast Wapl Murayama and Uhlmann, 2015 N/A Critical Commercial Assays SilverQuest Silver Staining Kit ThermoFisher Cat# LC6070 InFusion HD cloning kit TaKaRa Cat# 638910 Human IgG-Agarose Sigma-Aldrich Cat# A6284-5ML Glutathione Sepharose 4B GE Healthcare Cat# 17075601 Ni-NTA Superflow (25 ml) QIAGEN Cat# 30410 HiTrap Heparin HP 1 ml GE Healthcare Cat# 17040601 Superdex 200 Increase 10/300 GL GE Healthcare Cat# 28990944 Superdex 75 Increase 10/300GL GE Healthcare Cat# 29148721 Superose 6, 10/300 GL GE Healthcare Cat# 17517201 Amicon Ultra-4 centrifuge filter unit Sigma-Aldrich Cat# UFC810096 Slide-A-Lyzer MINI Dialysis Devices, 20K MWCO ThermoFisher Cat# 69555 Dynabeads M-280 Streptavidin ThermoFisher Cat#11206D Dynabeads Protein A ThermoFisher Cat#10002D ECL Prime Western Blotting Detection Regent GE Healthcare Cat# RPN2232 Zeba Spin Desalting Columns, 7K MWCO, 0.5 mL ThermoFisher Cat# 89882 MICROSPIN S-400 HR, 50 COLUMNS GE Healthcare Cat#GE27-5140-01 TLC PEI Cellulose F Merck Cat#105725 Experimental Models: Organisms/Strains All yeast strains used in this study are listed in Table S1 . Lab stock and this study N/A Escherichia coli : BL21 (DE3) codonPlus RIPL chemical competent cells Agilent Technologies Cat#230280 Oligonucleotides TH1:[bioteg]agcgcagcgagtcagtgagcgagg Sigma-Aldrich N/A TH2:cggtcgttcggctgcggcgagcgg Sigma-Aldrich N/A TH3: [bioteg]cggtcgttcggctgcggcgagcgg Sigma-Aldrich N/A TH4:agcgcagcgagtcagtgagcgagg Sigma-Aldrich N/A TH5:cctttttacggttcctggcc Sigma-Aldrich N/A Recombinant DNA pBluescript II KS(+) Murayama and Uhlmann, 2014 , 2015 , Murayama et al., 2018 N/A ssDNA of pBluescript II KS(+) Murayama et al., 2018 N/A M13KO7 Helper Phage New England BioLabs Cat# N0315S JM109 competent cells New England BioLabs Cat#E4107 Plasmid: pMis4-PA Murayama and Uhlmann, 2014 N/A Plasmid: pMis4-N191-PA Chao et al., 2015 N/A Plasmid: pSsl3 Murayama and Uhlmann, 2014 N/A Plasmid: pGEX-Wapl Murayama and Uhlmann, 2015 N/A Software and Algorithms Fiji ImageJ open source https://imagej.net/Fiji UCSF ChimeraX Resource for Biocomputing Visualization, and Informatics https://www.cgl.ucsf.edu/chimerax/ PyMOL Schrodinger https://pymol.org/2/ PEAKS X+ Bioinfomatics Solutions Inc. https://www.bioinfor.com/peaks-studio-x-plus/ xiVIEW Rappsilber lab https://xiview.org/xiNET_website/index.php CCBuilder 2.0 open source http://coiledcoils.chm.bris.ac.uk/ccbuilder2/builder Clustal Omega open source https://www.ebi.ac.uk/Tools/msa/clustalo/ Deposited Data Protein-protein crosslink mass spectrometry (CLMS) data PRIDE PXD018608 DNA-protein crosslink mass spectrometry (DPC-MS) PRIDE PXD018600 Negative stain EM map EMDB EMD-10870 cryo-EM map EMDB EMD-10930 cryo-EM atomic coordinates PDB 6YUF Unprocessed gel images presented in this manuscript can be found at https://data.mendeley.com/datasets/9bddfnc7wb/draft?a=41d6ea5b-4cba-4f3e-b9f3-a42dfb09eff4 N/A N/A Resource Availabilty Lead Contact Further information for resources and requests should be directed to and will be fulfilled by the Lead Contact, Frank Uhlmann ( frank.uhlmann@crick.ac.uk ).
Materials Availability
All reagents generated in this study are available from the Lead Contact without restriction.
Data and Code Availability
The negative stain map is available in EMDB, entry EMD-10870. The cryo-EM map and atomic coordinates are available in EMDB, entry EMD-10930 and PDB, entry 6YUF, respectively. The CLMS data have been deposited to the ProteomeXchange Consortium via the PRIDE partner repository with the dataset identifier PXD018608. The DPC-MS data have been deposited to the ProteomeXchange Consortium via the PRIDE partner repository with the dataset identifier PXD018600. Unprocessed gel images presented in this manuscript can be found at https://data.mendeley.com/datasets/9bddfnc7wb/draft?a=41d6ea5b-4cba-4f3e-b9f3-a42dfb09eff4 Experimental Model and Subject Details Yeast Strains All fission yeast cohesin tetramer complexes and Pds5 were expressed in W303 background budding yeast strains. Strains were cultured at 30°C in YP medium (2% peptone and 1% yeast extract) containing 2% raffinose until the optical density at 600 nm reached 1.0. Protein expression was induced by addition of 2% galactose for 4 h. Fission yeast Mis4-Ssl3 protein or Mis4-N191 protein was expressed in fission yeast strains. Fission yeast cells were cultured in EMM minimal medium supplemented with 30 μM thiamine at 30°C until the optical density at 595 nm reached 1.5, and protein expression was induced in EMM minimal medium lacking thiamine for 15 h. Genotypes of all strains used are listed in Table S1 . Bacteria Fission yeast Wapl was expressed in the E. coli strain BL21-CodonPlus (DE3)-RIPL (Agilent Technologies). The genotype is: E. coli B F- ompT hsdS(rB- mB-) dcm+ Tetr gal λ(DE3) endA Hte [argU proL Camr] [argU ileY leuW Strep/Specr] . Method Details Cloning of cohesin and its variants for protein purification For construction of Head FRET wild-type and EQ-cohesin, SNAP-tag and CLIP-tag encoding sequences were fused to Psm1 C terminus and Psm3 C terminus in the shuttle vector YIplac211-Psm1/Psm3 or YIplac211-Psm1 E1161Q /Psm3 E1128Q that were constructed previously ( Murayama and Uhlmann, 2014 , 2015 ). The YIplac211-Psm1-SNAP/Psm3-CLIP vector and a YIplac128-Rad21/Psc3 expression vector were sequentially integrated into budding yeast at the URA3 and LEU2 loci, respectively. For construction of the Kleisin-N FRET cohesin complex, SNAP-tag and CLIP-tag sequences were fused to Rad21 N terminus in the YIplac128-Rad21-Psc3 integration vector and Psm3 N terminus in the YIplac211-Psm1-Psm3 vector. Both vectors were integrated into budding yeast genome as before. Kleisin-N FRET Walker B motif mutant (EQ) and signature motif mutant (SQ) complexes were generated by site-directed mutagenesis on the YIplac211-Psm1/CLIP-Psm3 vector. For construction of the kleisin circle construct, SNAP and CLIP-tag sequences were fused to Rad21 C terminus and N terminus in the YIplac128-Rad21-Psc3 integration vector. The first of the two separase recognition sequence in Rad21 was replaced with a tobacco etch virus (TEV) protease-recognition sequence. The YIplac128-CLIP-Rad21-SNAP/Psc3 expression vector was integrated into budding yeast harboring YIplac211-Psm1/Psm3. For construction of SMC circle construct, SNAP-tag sequences were integrated into the Psm1 hinge region (between R593 and G594) and the Psm3 C terminus. CLIP-tag sequences were integrated into the Psm3 hinge region (between S631 and N632) and fused to the Psm1 C terminus in the YIplac211-Psm1/Psm3 vector. The expression vector was integrated into budding yeast harboring YIplac128-Rad21/Psc3. For construction of N-terminally truncated N17-Rad21, a partial coding sequence (amino acids 18-646) was amplified by PCR, which replaced the full-length Rad21 gene in the YIplac128-Rad21/Psc3 vector by In-Fusion cloning. The YIplac128-N17-Rad21/Psc3 and YIplac211-Psm1-Psm3 vectors were integrated into budding yeast. Protein expression, purification, labeling, and crosslinking Fission yeast cohesin tetramer complexes including wild-type, walker B mutant (Psm1 E1161Q, Psm3 E1128Q, denoted as EQ-cohesin), Psm3 acetyl-acceptor site mutant, Rad21 N-terminal truncated mutant (Rad21 amino acids 18-646, denoted N17-cohesin), Kleisin-circle complex, SMC circle complex, Mis4-Ssl3, Mis4- N191(amino acids 192-1587), Pds5 and Wapl were expressed and purified following previously described methods ( Chao et al., 2015 ; Murayama and Uhlmann, 2014 , 2015 ) All fission yeast cohesin complexes for FRET measurement (Head FRET wild-type and EQ-cohesin, Kleisin-N FRET wild-type, EQ and SG cohesin) were expressed and purified by sequential steps on IgG-Sepharose and heparin columns as described ( Murayama and Uhlmann, 2014 ). The peak fractions from the heparin elution in R buffer (20 mM Tris/HCl, pH 7.5, 0.5 mM TCEP, 10% (v/v) glycerol) containing approximately 600 mM NaCl were concentrated to 500 μl by ultrafiltration. Cohesin was supplemented with 2 μM BG-surface Alexa 647, 1 mM DTT and 0.003% Tween20 and incubated at 25°C for 1 h. Now the labeling reaction was supplemented with 4 μM BC-surface Dy547 and incubated at 4°C for 16 h to complete the labeling. The labeled cohesin was applied to a Superose 6 10/300 GL gel filtration column that was developed in R buffer containing 200 mM NaCl and 0.003% Tween20. The peak fractions were concentrated to 500 μl by ultrafiltration. To prepare head-crosslinked cohesin, Head FRET wild-type cohesin was expressed and purified by IgG-Sepharose chromatography as described above. Once loaded onto the heparin column, R buffer containing 100 mM NaCl and 4 μM SC-Cy5 crosslinker was injected and incubated at 25°C for 1 h, resulting mainly in SNAP tag coupling. After this incubation, the column was washed clear of crosslinker and heparin-bound cohesin was eluted and further incubated overnight at 4°C to allow CLIP tag coupling with SC-Cy5. The peak fractions of heparin purification step were concentrated to 500 μL by ultrafiltration and applied to a Superose 6 10/300 GL gel filtration column that was developed in R buffer containing 200 mM NaCl. The peak fractions were concentrated to 500 μL by ultrafiltration.
Topological cohesin loading assay
Topological cohesin loading onto DNA was performed in standard reactions (15 μl final volume) as previously described ( Murayama and Uhlmann, 2014 ) with minor modifications. Cohesin (100 nM), Mis4-Ssl3 (100 nM) and pBluescript dsDNA were mixed on ice in reaction buffer (35 mM Tris-HCl pH 7.5, 0.5 mM TCEP, 25 mM NaCl, 1 mM MgCl 2 , 15% (w/v) glycerol and 0.003% (w/v) Tween 20). The reactions were initiated by addition of 0.5 mM ATP and incubated at 32°C for 120 min. The reactions were terminated by addition of 500 μL of ice-chilled Washing buffer A (35 mM Tris-HCl pH 7.5, 0.5 mM TCEP, 750 mM NaCl, 0.35% (w/v) Triton X-100. Anti-Pk antibody adsorbed to protein A conjugated magnetic beads was added to the terminated reactions and rocked at 4°C overnight. The beads were one time washed with Washing buffer A and three times with Washing buffer B (35 mM Tris-HCl pH 7.5, 0.5 mM TCEP, 500 mM NaCl and 0.1% (w/v) Triton X-100) and once with Washing buffer C (35 mM Tris-HCl pH 7.5, 0.5 mM TCEP, 50 mM NaCl and 0.1% (w/v) Triton X-100). The cohesin-bound DNA was eluted in 15 μl of elution buffer (10 mM Tris-HCl pH 7.5, 1 mM EDTA, 50 mM NaCl, 0.75% SDS and 1 mg/ml protease K) by incubation at 50°C for 20 min. The recovered DNA was separated by 0.8% agarose gel electrophoresis in TAE buffer and stained with SYBR gold. Gel images were captured using a Typhoon FLA 9500 biomolecular imager and band intensities quantified using ImageJ.
Bulk FRET measurement
All fluorescence measurements were carried out at room temperature in reaction buffer (35 mM Tris-HCl pH 7.5, 0.5 mM TCEP, 25 mM NaCl, 1 mM MgCl 2 , 15% (w/v) glycerol and 0.003% (w/v) Tween 20). 40 μL of reaction mixtures containing 10 nM Dy547 and Alexa 647-labeled cohesin, 100 nM Mis4-Ssl3 and 3 nM DNA substrate were mixed and the reaction was started by addition of 0.5 mM ATP. Alternatively, 0.5 mM ADP or 0.5 mM ADP and 0.5 mM BeF 2 , 0.5 mM BeSO 4 + 10 mM NaF, 0.5 mM AlCl 3 + 10 mM NaF, or 0.5 mM Na 3 VO 4 were included instead of ATP. The reactions were incubated at 32°C for 20 min. The samples were applied to a 384-well plate and fluorescence spectra of the cohesin complex were collected on a CLARIOstar high performance plate reader. Samples were excited at 525 nm and emitted light was recorded between 560 - 700 nm in 0.5 nm increments. To evaluate FRET changes caused by cohesin’s conformational changes across different experimental conditions, we report relative FRET efficiency, I A /(I D + I A ), where I D is the donor emission signal intensity at 565 nm resulting from donor excitation at 525 nm and I A is the acceptor emission signal intensity at 665 nm resulting from donor excitation at 525 nm. DNA gripping experiments For DNA gripping analyses, we immobilized DNA on magnetic beads. A 3 kb linear DNA substrate was prepared by PCR amplification with 5′-biotinylated oligonucleotide TH1 and unmodified TH2 using pBluescript dsDNA as the template. The 3 kb DNA loop substrate was made by PCR amplification with a pair of both 5′-biotinylated oligonucleotides TH1 and TH3 using pBluescript dsDNA as the template. Streptavidin conjugated magnetic beads were washed with DNA binding buffer, DBB (10 mM Tris-HCl pH 7.5, 2 M NaCl, 1 mM EDTA, 0.03% Tween20) and resuspended in 2 volumes of DBB. 100 ng biotin-labeled DNA was mixed with 20 μL beads and incubated at room temperature for 1 h. Beads were washed 3 times with reaction buffer (35 mM Tris-HCl pH 7.5, 0.5 mM TCEP, 25 mM NaCl, 1 mM MgCl 2 , 15% (w/v) glycerol and 0.003% (w/v) Tween 20) and resuspended in reaction buffer supplemented with 1 mg/ml BSA and 2.5 mU poly-dIdC:dIdC. After 30 min incubation, DNA-beads were washed 3 times with reaction buffer. The standard reaction volume was 15 μl, containing 100 nM cohesin, 100 nM Mis4-Ssl3, 100 nM Mis4-N191, 100 nM Pds5 and 100 nM Wapl in reaction buffer. The reaction mixture was added to the DNA beads (containing 3.3 nM dsDNA molecules) on ice. The reactions were started by addition of 0.5 mM ATP, or 0.5 mM ADP and 0.5 mM BeSO 4 + 10 mM NaF, and incubated at 32°C for 20 min. After the incubation, beads were washed three times with Washing buffer C (35 mM Tris-HCl pH 7.5, 0.5 mM TCEP, 50 mM NaCl and 0.1% (w/v) Triton X-100) or Washing buffer D (35 mM Tris-HCl pH 7.5, 0.5 mM TCEP, 135 mM NaCl and 0.1% (w/v) Triton X-100) and once with Washing buffer C. The beads were divided into two for detection of protein and DNA. Protein samples were eluted with SDS-sample buffer (50 mM Tris-HCl pH 6.8, 2% SDS, 10% Glycerol, 50 mM DTT, 0.02% Bromophenol Blue) and boiled for 5 min. The DNA sample was eluted in buffer containing 3 mM biotin and incubated overnight at room temperature. DNA-bound proteins were separated by SDS-PAGE and analyzed by immunoblotting using the indicated antibodies. The recovered DNA was analyzed by 0.8% agarose gel electrophoresis as described above. EM sample preparation of cohesin in the gripping state For EM sample preparation, we used a 125 bp linear dsDNA substrate that was generated by PCR amplification with a pair of oligonucleotides TH1 and TH5 using pBluescript dsDNA as the template. 200 nM cohesin, 200 nM Mis4-Ssl3, 200 nM 125bp dsDNA were mixed in reaction buffer on ice. The reaction was started by addition of 0.5 mM ADP and 0.5 mM BeSO 4 + 10 mM NaF and incubated at 32°C for 20 min. After incubation, an equal volume of 2 x Washing buffer D (35 mM Tris-HCl pH 7.5, 0.5 mM TCEP, 135 mM NaCl and 0.1% (w/v) Triton X-100) was added for further incubation at 4°C for 10 min. The reaction mixture of a total volume of 50 μL was loaded onto 20–50% (weight/volume) linear sucrose gradients prepared in EM buffer (20 mM HEPES-KOH pH 7.5, 25 mM NaCl, 0.5 mM TCEP). Centrifugation was in a MLS-50 rotor (Beckman) at 37,000 rpm for 16 h at 4°C. 50 μL fractions were collected from top to bottom and protein and DNA in each fraction were analyzed by SDS-PAGE followed by silver-staining or agarose gel electrophoresis to identify peak fractions containing the cohesin-loader-DNA complex. Sucrose in the peak fractions was removed by passing three times through spin desalting columns before application to EM grids. Negative stain EM data acquisition and image processing A 300-mesh, continuous carbon copper grid (EM Resolutions, C300Cu100) was glow-discharged at 45 mA for 30 s. A 4 μL sample was applied and incubated for 1 min, followed by blotting of excess volume and grid staining in four 50 μL droplets of 2% uranyl acetate for 5, 10, 15, 20 s respectively. The grid was subsequently blotted dry. Micrographs were collected at x30,000 nominal magnification (3.45 Å pixel size) with a defocus range of −0.5 to −2.5 μm using a FEI Tecnai LaB6 G2 Spirit electron microscope operated at 120 kV and equipped with a 2K x 2K GATAN UltraScan 1000 CCD camera. Contrast transfer function parameters were estimated using Gctf v1.06 ( Zhang, 2016 ) and particles were picked semi-automatically with e2boxer in EMAN2 v2.07 ( Tang et al., 2007 ). Subsequent image processing was performed in RELION v3.0.4 ( Zivanov et al., 2018 ). Particles were initially extracted with a box size of 128 pixels and sorted by reference-free 2D classification with CTF-correction using the additional argument --only_flip_phases. To allow visualization of extended Psm1-Psm3 coiled coils, selected cohesin particles were re-extracted with a box size of 192 pixels and processed through one additional round of 2D classification. A reference-free initial 3D model was also created in RELION and used as an input for 3D refinement using particles with the larger box size. Cryo-EM data acquisition and image processing A 400-mesh lacey copper grid with a layer of ultra-thin carbon (Agar Scientific) was glow-discharged at 45 mA for 1 min. A 4 μL sample was applied and incubated for 2 min, followed by blotting of excess volume for 0.5 s using a Vitrobot Mark IV (FEI ThermoFisher) operated at room temperature and 100% humidity. To increase particle concentration, two additional 4 μL samples were applied to the grid for 2 min each, with 0.5 s blotting in between. After a final blot of 3 s the grid was plunge-frozen into liquid ethane. High-resolution cryo-EM data were acquired on a FEI Titan Krios electron microscope operated at 300 kV and equipped with Falcon 3EC Direct Electron Detector. Micrographs were collected at x75,000 nominal magnification (1.09 Å pixel size) as 30-frame movies with a total electron dose of 33.8 e - /Å 2 and a defocus range of −2.0 to −4.0 μm. A second dataset was collected with a phase plate using a GATAN K2 Summit direct electron detector operated in counting mode. Micrographs were collected at x130,000 nominal magnification (1.09 Å pixel size) as 40-frame movies with a total electron dose of 49 e - /Å 2 and −0.5 μm defocus. For the first dataset (no phase-plate), 30-frame movies were corrected for beam-induced movement using 5 × 5 patch alignment with all frames in MotionCor2 ( Zheng et al., 2017 ). Contrast transfer function parameters were estimated on non-dose-weighted micrographs using Gctf v1.06 and particles were picked with crYOLO ( Wagner et al., 2019 ). Subsequent image processing was performed in RELION v3.0.4 and cryoSPARC v2.14.2. Initially 883,184 particles were extracted from 12,085 micrographs in RELION using a box size of 360 pixels. After reference-free 2D classification in cryoSPARC 792,173 cohesin particles were selected and utilized to reconstruct an ab-initio 3D model, which was subsequently used as a starting model for non-uniform refinement. Following 3D refinement in RELION the particle subset was subjected to two rounds of 3D classification using a mask encompassing the cohesin core only. Ultimately 255,148 particles were selected and refined in cryoSPARC using non-uniform refinement followed by local non-uniform refinement of the cohesin core, resulting in a structure at 3.9 Å resolution. The final half-maps were used to produce a density modified map using the Phenix’s tool ResolveCryoEM ( Terwilliger et al., 2020 ). This map showed significant improvements in side chain density and overall interpretability. For the second dataset (phase-plate), 40-frame movies were corrected for beam-induced movement using 5 × 5 patch alignment using all frames in MotionCor2. Contrast transfer function parameters were estimated on non-dose-weighted micrographs using CTFFIND v4.1.10 ( Rohou and Grigorieff, 2015 ) and particles were picked with crYOLO. Subsequent image processing was performed in RELION v3.0.4 and cryoSPARC v2.14.2. Initially 330,024 binned-by-2 particles were extracted from 5,972 micrographs in RELION using a box size of 276 pixels (2.18 Å/pixel). After reference-free 2D classification in cryoSPARC 227,159 cohesin particles were selected and utilized to reconstruct an ab-initio 3D model, which was subsequently used as a starting model for non-uniform refinement. The particles were re-extracted with a smaller box size of 180 pixels (2.18 Å/pixel) and 3D refined in RELION, which revealed a flexible element connected to the cohesin core. To further characterize this peripheral element, particles were 3D-classified without image alignment using a mask encompassing only this density region. 80,325 particles were selected and 3D-autorefined in RELION without a mask. To increase the resolution of the flexible element and assess the conformational changes sampled in the cohesin complex, multibody refinement ( Nakane et al., 2018 ) was performed using masks encompassing either the core or the flexible region. The two signal-subtracted particle stacks generated during multibody refinement in RELION were then exported for non-uniform refinement in cryoSPARC. Although the flexible region could not be resolved to subnanometer resolution, a defined, rigid body could be identified, into which a homology model of Psc3 could be unambiguously docked using the Fit-in map command in UCSF Chimera ( Pettersen et al., 2004 ). The homology model was generated with SWISS-MODEL ( Waterhouse et al., 2018 ) and based on PDB entry 6H8Q ( Li et al., 2018 ). See also Table S2 for the image processing workflow for the cryo-EM core structure as well as the multibody refinement workflow that led to the Identification of a separate rigid body identified as Psc3.
Model building and validation
SWISS-MODEL was used to obtain homology models for Psm1, Psm3, Rad21 (PDB entries 4UX3 and 1W1W) ( Gligoris et al., 2014 ; Haering et al., 2004 ), and Mis4, PDB entry 5T8V ( Kikuchi et al., 2016 ). These models were docked into the cryo-EM map using the Fit in Map command in USCF Chimera ( Pettersen et al., 2004 ). These models were refined against the map using Namdinator ( Kidmose et al., 2019 ) and the resulting model was used as a starting point for manual adjustments in Coot ( Emsley et al., 2010 ). The resulting model was then subjected to an iterative process of real space-refinement using Phenix.real_space_refinement ( Adams et al., 2010 ) with geometry and secondary structure restraints followed by manual inspection and adjustments in Coot. Residues 552-583 from Rad21(chain B) and 209-302 from Mis4 (chain D) were docked into the map by rigid-body fitting of the corresponding homology models. The geometries of the atomic model were evaluated by MolProbity ( Williams et al., 2018 ). Cryo-EM data acquisition, 3D reconstruction information and atomic model refinement statistics are summarized in Table S3 . Figures were prepared with UCSF Chimera and ChimeraX ( Goddard et al., 2018 ).
SDA-based protein-protein crosslink mass spectrometry
(CLMS) analysis Sample preparation Protein crosslinking of the cohesin complex was performed in two conditions. An initial state contained all components except nucleotide. The DNA gripping state was achieved by addition of ADP and BeSO 4 + NaF. All materials (cohesin, loader and DNA) were dialyzed in SDA crosslinking buffer (35 mM HEPES-KOH pH 7.5, 0.5 mM TCEP, 25 mM NaCl, 1 mM MgCl 2 , 15% (w/v) glycerol and 0.003% (w/v) Tween 20) at 4°C for 3 h. Cohesin (200 nM), Mis4-Ssl3 (200 nM) and 125 bp dsDNA (200 nM) were mixed on ice in SDA crosslinking buffer. The reaction in each condition was started in the absence of nucleotide or in the presence of 0.5 mM ADP and 0.5 mM BeSO 4 + 10 mM NaF at 32°C. After 20 min incubation, SDA was added to 50 μg of the cohesin complex at increasing crosslinker weight ratios. (Protein: SDA = 1:1.3, 1:1.9 and 1: 3.8). The diazirine group in SDA was photo-activated using UV irradiation at 365 nm from an ultraviolet crosslinker (Spectrum). Samples were mounted in a 96-well plate, placed on ice at a distance of 5 cm from the UV-A lamp and irradiated for 20 min. After UV irradiation, the sample was further incubated on ice for 2 h to allow further time for NHS crosslinking. The reaction mixtures from the three protein: crosslinker ratios were combined and quenched with 50 mM ammonium bicarbonate. 4 sample volumes of cold acetone were added and incubated at −20°C for 1 h. Precipitated proteins were collected by centrifugation and dried in a vacuum concentrator.
CLMS sample analysis
Both samples were resolubilized in 100 μl digestion buffer (8M urea in 100 mM ammonium bicarbonate) to an estimated protein concentration of 1 mg/ml. Dissolved protein sample was reduced by addition of 0.5 μL 1M dithiothreitol (DTT) at room temperature for 30 min. The free sulfhydryl groups in the sample were then alkylated by adding 3 μl 500 mM iodoacetamide and incubation at room temperature for 20 min in the dark. After alkylation, 0.5 μL 1M DTT was added to quench excess of iodoacetamide. Next, protein samples were digested with LysC (at a 50:1 (m/m) protein to protease ratio) at room temperature for four h. The sample was then diluted with 100 mM ammonium bicarbonate to reach a urea concentration of 1.5 M. Trypsin was added at a 50:1 (m/m) protein to protease ratio to further digest proteins overnight (~15 h) at room temperature. Resulting peptides were desalted using C18 StageTips ( Rappsilber et al., 2007 ). For each sample, resulting peptides were fractionated using size exclusion chromatography in order to enrich for crosslinked peptides ( Leitner et al., 2014 ). Peptides were separated using a Superdex Peptide 3.2/300 column (GE Healthcare) at a flow rate of 10 μl/minute. The mobile phase consisted of 30% (v/v) acetonitrile and 0.1% trifluoroacetic acid. The earliest six peptide-containing fractions (50 μL each) were collected. Solvent was removed using a vacuum concentrator. The fractions were then analyzed by LC-MS/MS. LC-MS/MS analysis was performed using an Orbitrap Fusion Lumos Tribrid mass spectrometer (Thermo Fisher Scientific), connected to an Ultimate 3000 RSLCnano system (Thermo Fisher Scientific). Each size exclusion chromatography fraction was resuspended in 1.6% v/v acetonitrile 0.1% v/v formic acid and analyzed with replicated LC-MS/MS acquisitions. Peptides were injected onto a 50 cm EASY-Spray C18 LC column (Thermo Scientific) that is operated at 50°C column temperature. Mobile phase A consists of water, 0.1% v/v formic acid and mobile phase B consists of 80% v/v acetonitrile and 0.1% v/v formic acid. Peptides were loaded and separated at a flowrate of 0.3 μl/min. Peptides were separated by applying a gradient ranging from 2% to 45% B over 90 min. The gradient was optimized for each fraction. Following the separating gradient, the content of B was ramped to 55% and 95% within 2.5 min each. Eluted peptides were ionized by an EASY-Spray source (Thermo Scientific) and introduced directly into the mass spectrometer. The MS data were acquired in the data-dependent mode with the top-speed option. For each three-second acquisition cycle, the full scan mass spectrum was recorded in the Orbitrap with a resolution of 120,000. The ions with a charge state from 3+ to 7+ were isolated and fragmented using higher-energy collisional dissociation (HCD). For each isolated precursor, one of three collision energy settings (26%, 28% or 30%) was selected for fragmentation using a data-dependent decision tree based on the m/z and charge of the precursor. The fragmentation spectra were then recorded in the Orbitrap with a resolution of 50,000. Dynamic exclusion was enabled with single repeat count and 60 s exclusion duration. MS2 peak lists were generated from the raw mass spectrometric data files using the MSConvert module in ProteoWizard (version 3.0.11729). The default parameters were applied, except that Top MS/MS Peaks per 100 Da was set to 20 and the denoising function was enabled. Precursor and fragment m/z values were recalibrated. Identification of crosslinked peptides was carried out using xiSEARCH software ( https://www.rappsilberlab.org/software/xisearch ) (version 1.7.0) ( Mendes et al., 2019 ). The “initial state” and “gripping state” samples were processed separately. For each sample, peak lists from all LC-MS/MS acquisitions were searched against the sequence and the reversed sequence of cohesin and loader subunits (Psm1, Psm3, Rad21, Psc3, Mis4 and Ssl3). The following parameters were applied for the search: MS accuracy = 4 ppm; MS2 accuracy = 10 ppm; enzyme = trypsin (with full tryptic specificity); allowed number of missed cleavages = 2; missing monoisotopic peak = 2; crosslinker = SDA (the reaction specificity for SDA was assumed to be for lysine, serine, threonine, tyrosine, and protein N-termini on the NHS ester end and any amino acids for the diazirine end); fixed modifications = carbamidomethylation on cysteine; variable modifications = oxidation on methionine and SDA loop link. Identified crosslinked peptide candidates were filtered using xiFDR ( Fischer and Rappsilber, 2017 ). A false discovery rate of 1% on residue-pair level was applied with “boost between” option selected. A list of identified crosslinked residue pairs is reported in Table S4 .
DNA-protein crosslink mass spectrometry
(DPC-MS) analysis Sample preparation For DNA-protein crosslinking, we prepared two types of dsDNA probes. A 125 bp linear dsDNA was amplified by PCR with 5′-biotinylated oligonucleotide TH1 and non-modified oligonucleotide TH5 using pBluescript dsDNA as the template. PCR reaction mixtures contained 5 ng/ml template DNA, 0.3 μM of each primer, 0.2 mM each of dATP, dCTP and dGTP, 0.02 mM dTTP, 0.18 mM aminoallyl-dUTP and 0.025 unit/μl Go-taq DNA polymerase in 1x Go-taq buffer (Promega). A 3 kb circular dsDNA was prepared by primer extension on single stranded DNA. 5′-biotinylated TH1 oligonucleotide primer was annealed to single strand DNA templates of pBluescript, prepared using M13KO7 helper phage ( Murayama et al., 2018 ). For second strand synthesis, the primer-template mix was incubated in 20 mM Tris-HCl (pH 7.5), 10 mM MgCl 2 , 1 mM DTT, 0.4 mM each of dATP, dCTP, dGTP and aminoallyl-dUTP, 0.1 mg/ml BSA and 0.04 unit/μl T7 DNA polymerase (New England Biolabs) at 37°C for 3 h. After synthesis, the buffer of the DNA samples was exchanged to SDAD crosslinking buffer (100 mM NaHCO 3 pH 8.3) using MicroSpin S400 columns (GE Healthcare). 1 μg of dsDNA was incubated with 2 mM SDAD crosslinker in 25 μL of SDAD crosslinking buffer at 25°C overnight. The diazirin-decorated dsDNA (SDAD-DNA) probe was dialyzed in DNA dialysis buffer (10 mM Tris-HCl pH 7.5, 0.1 mM EDTA). For DNA-protein crosslinking 200 nM cohesin, 200 nM Mis4-Ssl3, 20 ng/μl linear 125 bp or circular 3 kb SDAD-DNA probe were mixed in reaction buffer, and the DNA gripping reaction was initiated by addition of 0.5 mM ADP and 0.5 mM BeSO 4 + 10 mM NaF at 32°C for 30 min. An equal volume of 2 x Washing buffer D (35 mM Tris-HCl pH 7.5, 0.5 mM TCEP, 135 mM NaCl and 0.1% (w/v) Triton X-100) was added to the reaction mixture and incubated at 4°C for 10 min. The sample was mounted on a 96-well plate, placed on ice at a distance of 5 cm from the UV-A lamp and irradiated for 10 min, as described above for SDA protein-protein crosslinking. After UV irradiation, the buffer of the samples was exchanged with Protease buffer (100 mM ammonium bicarbonate pH 8.0) using MicroSpin S400 columns. Lys-C protease was added (1:20 (m/m) protease to protein ratio) and incubated at 37°C overnight. To remove non-crosslinked peptide from the DNA, an equal volume of 2 x RIPA buffer (100 mM Tris-HCl pH 8, 100 mM NaCl, 0.2% SDS) was added to the sample, followed by incubation at 50°C for 30 min. The DNA with crosslinked peptides was purified by Superdex75 size exclusion chromatography developed with 20 mM Tris-HCl pH 7.5, 200 mM NaCl. The recovered DNA-peptide complexes in the void fraction were supplemented with NaCl to 1 M final concentration and 0.1% (w/v) Tween-20. The biotinylated DNA was recovered using streptavidin M280 magnetic beads (Invitrogen) at 25°C for 1 h. DNA-beads were washed three times with 1 x RIPA buffer and five times with peptide elution buffer (20 mM Tris-HCl pH 7.5, 200 mM NaCl). DNA-crosslinked peptides were now eluted by addition of peptide elution buffer containing 25 mM DTT and incubation at 37°C for 30 min. In the experiment comparing cohesin’s initial binding state and the gripping state, the incubation and crosslinking were performed as above without or with 0.5 mM BeSO 4 + 10 mM NaF. After the 32°C incubation, the sample was directly mounted on a 96-well plate without washing buffer addition and the plate was UV irradiated on ice for 10 min. The irradiated sample was then treated as described above.
DPC-MS sample analysis
Peptide solutions in the DTT peptide elution buffer were transferred into Total Recovery vials (Waters) for injection without further clean-up or concentration. Samples were analyzed by online nanoflow LC-MS/MS using an Orbitrap Fusion Lumos mass spectrometer (Thermo Scientific) coupled to an Ultimate 3000 RSLCnano (Thermo Scientific). 15 μl of sample was loaded via autosampler into a 20 μl sample loop and pre-concentrated onto an Acclaim PepMap 100 75 μm x 2 cm nanoviper trap column with loading buffer, 2% v/v acetonitrile, 0.05% v/v trifluoroacetic acid, 97.95% water (Optima grade, Fisher Scientific) at a flow rate of 7 μl/min for 6 min in the column oven held at 40°C. Peptides were gradient eluted and separated with a C 18 75 μm x 50 cm, 2 μm particle size, 100 Å pore size, reversed phase EASY-Spray analytical column (Thermo Scientific) at a flow rate of 275 nl/min and with the column temperature held at 40°C, with a spray voltage of 2100 V using the EASY-Spray Source (Thermo Scientific). Gradient elution buffers were A 0.1% v/v formic acid, 5% v/v DMSO, 94.9% v/v water and B 0.1% v/v formic acid, 5% v/v DMSO, 20% v/v water, 74.9% v/v acetonitrile (all Optima grade, Fisher Scientific aside from DMSO, Honeywell Research Chemicals). The gradient elution profile used was 8% B to 40% B over 60 min. The instrument method used an MS1 Orbitrap scan resolution of 120,000 at FWHM m/z 200, quadrupole isolation, mass range 375-1500 m/z, RF Lens 40%, AGC target 4e5, maximum injection time 50 ms and spectra were acquired in profile. Monoisotopic Peak Determination was set to the peptide mode, and only precursors with charge states 2-6 were permitted for selection for fragmentation. Dynamic Exclusion was enabled to exclude after n = 1 times for 20 s with high and low ppm mass tolerances of 10 ppm. MS2 scans were acquired in the ion trap following HCD fragmentation with fixed collision energy of 32% and was performed on all selected precursor masses using a cycle time based on data-dependent mode of acquisition set to 3 s. The parameters used for the HCD MS2 scan were quadrupole isolation with an isolation window width of 1.2 m/z, first mass 110 m/z, AGC target 2e3, maximum injection time 300 ms and the scan data were acquired in centroid mode at the rapid scan rate. A FASTA database containing only the sequences of the six subunits of the cohesin complex and loader was used for the PEAKS search conducted within PEAKS Studio (Bioinformatics Solutions Inc). A modification corresponding to the diazirine moiety after reduction (C 7 H 13 NOS, 159.07178) was created and considered as a variable modification along with the oxidation of methionine residues. Other parameters of the search were digestion enzyme LysC with a maximum of 2 missed cleavages, peptide mass tolerance 5ppm and fragment mass tolerance 0.6 Da. SC-Cy5 crosslinking experiments The SC-Cy5 crosslinker was synthesized as previously described ( Gautier et al., 2009 ). Using crosslinkable cohesin complexes (kleisin-circle or SMC-circle) and a DNA-loop substrate, we performed DNA gripping assay as described above. Following the DNA gripping reaction, DNA-beads were washed 3 times with Washing buffer D (35 mM Tris-HCl pH 7.5, 0.5 mM TCEP, 135 mM NaCl and 0.1% (w/v) Triton X-100), and supplemented with 4 μM SC-Cy5 and 1 mM DTT in Washing buffer D. Crosslinking was carried out at 32°C for 60 min. DNA-beads were then divided into three parts. One part was immediately eluted with SDS sample buffer containing 3 mM biotin and served as the input sample. The second sample was washed 5 times with Washing buffer D. The third sample was washed 5 times with SDS buffer (35 mM Tris-HCl pH 7.5, 0.5 mM TCEP, 100 mM NaCl and 0.1% SDS). The second and third samples were then supplemented with SDS sample buffer containing 3 mM biotin and boiled for 10 min to elute DNA and protein. Samples were analyzed by SDS-PAGE, followed by in-gel detection of Cy5 or immunoblotting with indicated antibodies. To further evaluate topological DNA entrapment by the circularized kleisin, beads following SDS washes were divided into two, equilibrated with DNA digestion buffer (35 mM Tris-HCl pH 7.5, 0.5 mM TCEP, 100 mM NaCl, 10 mM MgCl 2 , 0.1 mg/ml BSA, 0.1% Triton X-100) and treated without or with 1 U/μl restriction enzyme PstI in DNA digestion buffer. Alternatively, the sample was equilibrated with TEV digestion buffer (50 mM Tris-HCl pH 8.0, 100 mM NaCl, 0.5 mM EDTA, 1 mM DTT) and treated without or with 0.25 U/μl TEV protease in TEV digestion buffer. After a 20 min incubation at 32°C, the beads and supernatant fractions were separated, SDS sample buffer containing 3 mM biotin added to each and samples boiled for 10 min. ATPase assay Cohesin (150 nM) and Mis4-Ssl3 (100 nM) were mixed with pBluescript dsDNA in reaction buffer (15 μL in final volume). The reactions were initiated by addition of 0.25 mM ATP, spiked with [γ-33P]-ATP, and incubated at 32°C. Aliquots (2 μl) were taken after 0, 15, 30, and 60 min and terminated by addition of 6 μL of 0.5 M EDTA pH 8.0. The products were separated by thin layer chromatography on TCL polyethylenimine cellulose F sheets (Merck), developed with 400 mM LiCl in 1 M formic acid. Plates were analyzed using a Typhoon FLA 9500 Phosphor-imager (GE Healthcare).
Quantification and Statistical Analysis Bulk FRET analysis
The fluorescent signals of proteins were detected using a CLARIOstar high performance plate reader and the FRET efficiency calculated as described in Method Details . The experiments were repeated at least three times. The results from all individual experiments are shown, together with their means and standard deviations. Cohesin loading and DNA gripping experiments Immunoblots were developed using ECL reagents (GE Healthcare). The chemiluminescent signals were detected using an Amersham Imager 600 (GE Healthcare) or Amersham Hyperfilm ECL (GE Healthcare). In-gel fluorescent signals of labeled proteins were detected using a Typhoon FLA9500 imager (GE Healthcare). Recovered DNAs were separated by agarose-gel electrophoresis and stained by SYBR gold. The DNA signals were also detected by the Typhoon FLA9500 imager and signal intensities were quantified using ImageJ software. The graphs depict means and the error bars represent standard deviations from three independent experiments.
ATPase Assay
Reaction products containing radioisotope were separated by thin layer chromatography and quantified using the Typhoon FLA9500 imager. The signal intensities were quantified in ImageJ. The graphs depict means and the error bars represent standard deviations from three independent experiments.
Materials Availability
All reagents generated in this study are available from the Lead Contact without restriction.
Experimental Model and Subject Details Yeast Strains
All fission yeast cohesin tetramer complexes and Pds5 were expressed in W303 background budding yeast strains. Strains were cultured at 30°C in YP medium (2% peptone and 1% yeast extract) containing 2% raffinose until the optical density at 600 nm reached 1.0. Protein expression was induced by addition of 2% galactose for 4 h. Fission yeast Mis4-Ssl3 protein or Mis4-N191 protein was expressed in fission yeast strains. Fission yeast cells were cultured in EMM minimal medium supplemented with 30 μM thiamine at 30°C until the optical density at 595 nm reached 1.5, and protein expression was induced in EMM minimal medium lacking thiamine for 15 h. Genotypes of all strains used are listed in Table S1 . Bacteria Fission yeast Wapl was expressed in the E. coli strain BL21-CodonPlus (DE3)-RIPL (Agilent Technologies). The genotype is: E. coli B F- ompT hsdS(rB- mB-) dcm+ Tetr gal λ(DE3) endA Hte [argU proL Camr] [argU ileY leuW Strep/Specr] .
Method Details Cloning of cohesin and its variants for protein purification For construction of Head FRET wild-type and EQ-cohesin, SNAP-tag and CLIP-tag encoding sequences were fused to Psm1 C terminus and Psm3 C terminus in the shuttle vector YIplac211-Psm1/Psm3 or YIplac211-Psm1 E1161Q /Psm3 E1128Q that were constructed previously ( Murayama and Uhlmann, 2014 , 2015 ). The YIplac211-Psm1-SNAP/Psm3-CLIP vector and a YIplac128-Rad21/Psc3 expression vector were sequentially integrated into budding yeast at the URA3 and LEU2 loci, respectively. For construction of the Kleisin-N FRET cohesin complex, SNAP-tag and CLIP-tag sequences were fused to Rad21 N terminus in the YIplac128-Rad21-Psc3 integration vector and Psm3 N terminus in the YIplac211-Psm1-Psm3 vector. Both vectors were integrated into budding yeast genome as before. Kleisin-N FRET Walker B motif mutant (EQ) and signature motif mutant (SQ) complexes were generated by site-directed mutagenesis on the YIplac211-Psm1/CLIP-Psm3 vector. For construction of the kleisin circle construct, SNAP and CLIP-tag sequences were fused to Rad21 C terminus and N terminus in the YIplac128-Rad21-Psc3 integration vector. The first of the two separase recognition sequence in Rad21 was replaced with a tobacco etch virus (TEV) protease-recognition sequence. The YIplac128-CLIP-Rad21-SNAP/Psc3 expression vector was integrated into budding yeast harboring YIplac211-Psm1/Psm3. For construction of SMC circle construct, SNAP-tag sequences were integrated into the Psm1 hinge region (between R593 and G594) and the Psm3 C terminus. CLIP-tag sequences were integrated into the Psm3 hinge region (between S631 and N632) and fused to the Psm1 C terminus in the YIplac211-Psm1/Psm3 vector. The expression vector was integrated into budding yeast harboring YIplac128-Rad21/Psc3. For construction of N-terminally truncated N17-Rad21, a partial coding sequence (amino acids 18-646) was amplified by PCR, which replaced the full-length Rad21 gene in the YIplac128-Rad21/Psc3 vector by In-Fusion cloning. The YIplac128-N17-Rad21/Psc3 and YIplac211-Psm1-Psm3 vectors were integrated into budding yeast. Protein expression, purification, labeling, and crosslinking Fission yeast cohesin tetramer complexes including wild-type, walker B mutant (Psm1 E1161Q, Psm3 E1128Q, denoted as EQ-cohesin), Psm3 acetyl-acceptor site mutant, Rad21 N-terminal truncated mutant (Rad21 amino acids 18-646, denoted N17-cohesin), Kleisin-circle complex, SMC circle complex, Mis4-Ssl3, Mis4- N191(amino acids 192-1587), Pds5 and Wapl were expressed and purified following previously described methods ( Chao et al., 2015 ; Murayama and Uhlmann, 2014 , 2015 ) All fission yeast cohesin complexes for FRET measurement (Head FRET wild-type and EQ-cohesin, Kleisin-N FRET wild-type, EQ and SG cohesin) were expressed and purified by sequential steps on IgG-Sepharose and heparin columns as described ( Murayama and Uhlmann, 2014 ). The peak fractions from the heparin elution in R buffer (20 mM Tris/HCl, pH 7.5, 0.5 mM TCEP, 10% (v/v) glycerol) containing approximately 600 mM NaCl were concentrated to 500 μl by ultrafiltration. Cohesin was supplemented with 2 μM BG-surface Alexa 647, 1 mM DTT and 0.003% Tween20 and incubated at 25°C for 1 h. Now the labeling reaction was supplemented with 4 μM BC-surface Dy547 and incubated at 4°C for 16 h to complete the labeling. The labeled cohesin was applied to a Superose 6 10/300 GL gel filtration column that was developed in R buffer containing 200 mM NaCl and 0.003% Tween20. The peak fractions were concentrated to 500 μl by ultrafiltration. To prepare head-crosslinked cohesin, Head FRET wild-type cohesin was expressed and purified by IgG-Sepharose chromatography as described above. Once loaded onto the heparin column, R buffer containing 100 mM NaCl and 4 μM SC-Cy5 crosslinker was injected and incubated at 25°C for 1 h, resulting mainly in SNAP tag coupling. After this incubation, the column was washed clear of crosslinker and heparin-bound cohesin was eluted and further incubated overnight at 4°C to allow CLIP tag coupling with SC-Cy5. The peak fractions of heparin purification step were concentrated to 500 μL by ultrafiltration and applied to a Superose 6 10/300 GL gel filtration column that was developed in R buffer containing 200 mM NaCl. The peak fractions were concentrated to 500 μL by ultrafiltration.
Topological cohesin loading assay
Topological cohesin loading onto DNA was performed in standard reactions (15 μl final volume) as previously described ( Murayama and Uhlmann, 2014 ) with minor modifications. Cohesin (100 nM), Mis4-Ssl3 (100 nM) and pBluescript dsDNA were mixed on ice in reaction buffer (35 mM Tris-HCl pH 7.5, 0.5 mM TCEP, 25 mM NaCl, 1 mM MgCl 2 , 15% (w/v) glycerol and 0.003% (w/v) Tween 20). The reactions were initiated by addition of 0.5 mM ATP and incubated at 32°C for 120 min. The reactions were terminated by addition of 500 μL of ice-chilled Washing buffer A (35 mM Tris-HCl pH 7.5, 0.5 mM TCEP, 750 mM NaCl, 0.35% (w/v) Triton X-100. Anti-Pk antibody adsorbed to protein A conjugated magnetic beads was added to the terminated reactions and rocked at 4°C overnight. The beads were one time washed with Washing buffer A and three times with Washing buffer B (35 mM Tris-HCl pH 7.5, 0.5 mM TCEP, 500 mM NaCl and 0.1% (w/v) Triton X-100) and once with Washing buffer C (35 mM Tris-HCl pH 7.5, 0.5 mM TCEP, 50 mM NaCl and 0.1% (w/v) Triton X-100). The cohesin-bound DNA was eluted in 15 μl of elution buffer (10 mM Tris-HCl pH 7.5, 1 mM EDTA, 50 mM NaCl, 0.75% SDS and 1 mg/ml protease K) by incubation at 50°C for 20 min. The recovered DNA was separated by 0.8% agarose gel electrophoresis in TAE buffer and stained with SYBR gold. Gel images were captured using a Typhoon FLA 9500 biomolecular imager and band intensities quantified using ImageJ.
Bulk FRET measurement
All fluorescence measurements were carried out at room temperature in reaction buffer (35 mM Tris-HCl pH 7.5, 0.5 mM TCEP, 25 mM NaCl, 1 mM MgCl 2 , 15% (w/v) glycerol and 0.003% (w/v) Tween 20). 40 μL of reaction mixtures containing 10 nM Dy547 and Alexa 647-labeled cohesin, 100 nM Mis4-Ssl3 and 3 nM DNA substrate were mixed and the reaction was started by addition of 0.5 mM ATP. Alternatively, 0.5 mM ADP or 0.5 mM ADP and 0.5 mM BeF 2 , 0.5 mM BeSO 4 + 10 mM NaF, 0.5 mM AlCl 3 + 10 mM NaF, or 0.5 mM Na 3 VO 4 were included instead of ATP. The reactions were incubated at 32°C for 20 min. The samples were applied to a 384-well plate and fluorescence spectra of the cohesin complex were collected on a CLARIOstar high performance plate reader. Samples were excited at 525 nm and emitted light was recorded between 560 - 700 nm in 0.5 nm increments. To evaluate FRET changes caused by cohesin’s conformational changes across different experimental conditions, we report relative FRET efficiency, I A /(I D + I A ), where I D is the donor emission signal intensity at 565 nm resulting from donor excitation at 525 nm and I A is the acceptor emission signal intensity at 665 nm resulting from donor excitation at 525 nm. DNA gripping experiments For DNA gripping analyses, we immobilized DNA on magnetic beads. A 3 kb linear DNA substrate was prepared by PCR amplification with 5′-biotinylated oligonucleotide TH1 and unmodified TH2 using pBluescript dsDNA as the template. The 3 kb DNA loop substrate was made by PCR amplification with a pair of both 5′-biotinylated oligonucleotides TH1 and TH3 using pBluescript dsDNA as the template. Streptavidin conjugated magnetic beads were washed with DNA binding buffer, DBB (10 mM Tris-HCl pH 7.5, 2 M NaCl, 1 mM EDTA, 0.03% Tween20) and resuspended in 2 volumes of DBB. 100 ng biotin-labeled DNA was mixed with 20 μL beads and incubated at room temperature for 1 h. Beads were washed 3 times with reaction buffer (35 mM Tris-HCl pH 7.5, 0.5 mM TCEP, 25 mM NaCl, 1 mM MgCl 2 , 15% (w/v) glycerol and 0.003% (w/v) Tween 20) and resuspended in reaction buffer supplemented with 1 mg/ml BSA and 2.5 mU poly-dIdC:dIdC. After 30 min incubation, DNA-beads were washed 3 times with reaction buffer. The standard reaction volume was 15 μl, containing 100 nM cohesin, 100 nM Mis4-Ssl3, 100 nM Mis4-N191, 100 nM Pds5 and 100 nM Wapl in reaction buffer. The reaction mixture was added to the DNA beads (containing 3.3 nM dsDNA molecules) on ice. The reactions were started by addition of 0.5 mM ATP, or 0.5 mM ADP and 0.5 mM BeSO 4 + 10 mM NaF, and incubated at 32°C for 20 min. After the incubation, beads were washed three times with Washing buffer C (35 mM Tris-HCl pH 7.5, 0.5 mM TCEP, 50 mM NaCl and 0.1% (w/v) Triton X-100) or Washing buffer D (35 mM Tris-HCl pH 7.5, 0.5 mM TCEP, 135 mM NaCl and 0.1% (w/v) Triton X-100) and once with Washing buffer C. The beads were divided into two for detection of protein and DNA. Protein samples were eluted with SDS-sample buffer (50 mM Tris-HCl pH 6.8, 2% SDS, 10% Glycerol, 50 mM DTT, 0.02% Bromophenol Blue) and boiled for 5 min. The DNA sample was eluted in buffer containing 3 mM biotin and incubated overnight at room temperature. DNA-bound proteins were separated by SDS-PAGE and analyzed by immunoblotting using the indicated antibodies. The recovered DNA was analyzed by 0.8% agarose gel electrophoresis as described above. EM sample preparation of cohesin in the gripping state For EM sample preparation, we used a 125 bp linear dsDNA substrate that was generated by PCR amplification with a pair of oligonucleotides TH1 and TH5 using pBluescript dsDNA as the template. 200 nM cohesin, 200 nM Mis4-Ssl3, 200 nM 125bp dsDNA were mixed in reaction buffer on ice. The reaction was started by addition of 0.5 mM ADP and 0.5 mM BeSO 4 + 10 mM NaF and incubated at 32°C for 20 min. After incubation, an equal volume of 2 x Washing buffer D (35 mM Tris-HCl pH 7.5, 0.5 mM TCEP, 135 mM NaCl and 0.1% (w/v) Triton X-100) was added for further incubation at 4°C for 10 min. The reaction mixture of a total volume of 50 μL was loaded onto 20–50% (weight/volume) linear sucrose gradients prepared in EM buffer (20 mM HEPES-KOH pH 7.5, 25 mM NaCl, 0.5 mM TCEP). Centrifugation was in a MLS-50 rotor (Beckman) at 37,000 rpm for 16 h at 4°C. 50 μL fractions were collected from top to bottom and protein and DNA in each fraction were analyzed by SDS-PAGE followed by silver-staining or agarose gel electrophoresis to identify peak fractions containing the cohesin-loader-DNA complex. Sucrose in the peak fractions was removed by passing three times through spin desalting columns before application to EM grids. Negative stain EM data acquisition and image processing A 300-mesh, continuous carbon copper grid (EM Resolutions, C300Cu100) was glow-discharged at 45 mA for 30 s. A 4 μL sample was applied and incubated for 1 min, followed by blotting of excess volume and grid staining in four 50 μL droplets of 2% uranyl acetate for 5, 10, 15, 20 s respectively. The grid was subsequently blotted dry. Micrographs were collected at x30,000 nominal magnification (3.45 Å pixel size) with a defocus range of −0.5 to −2.5 μm using a FEI Tecnai LaB6 G2 Spirit electron microscope operated at 120 kV and equipped with a 2K x 2K GATAN UltraScan 1000 CCD camera. Contrast transfer function parameters were estimated using Gctf v1.06 ( Zhang, 2016 ) and particles were picked semi-automatically with e2boxer in EMAN2 v2.07 ( Tang et al., 2007 ). Subsequent image processing was performed in RELION v3.0.4 ( Zivanov et al., 2018 ). Particles were initially extracted with a box size of 128 pixels and sorted by reference-free 2D classification with CTF-correction using the additional argument --only_flip_phases. To allow visualization of extended Psm1-Psm3 coiled coils, selected cohesin particles were re-extracted with a box size of 192 pixels and processed through one additional round of 2D classification. A reference-free initial 3D model was also created in RELION and used as an input for 3D refinement using particles with the larger box size. Cryo-EM data acquisition and image processing A 400-mesh lacey copper grid with a layer of ultra-thin carbon (Agar Scientific) was glow-discharged at 45 mA for 1 min. A 4 μL sample was applied and incubated for 2 min, followed by blotting of excess volume for 0.5 s using a Vitrobot Mark IV (FEI ThermoFisher) operated at room temperature and 100% humidity. To increase particle concentration, two additional 4 μL samples were applied to the grid for 2 min each, with 0.5 s blotting in between. After a final blot of 3 s the grid was plunge-frozen into liquid ethane. High-resolution cryo-EM data were acquired on a FEI Titan Krios electron microscope operated at 300 kV and equipped with Falcon 3EC Direct Electron Detector. Micrographs were collected at x75,000 nominal magnification (1.09 Å pixel size) as 30-frame movies with a total electron dose of 33.8 e - /Å 2 and a defocus range of −2.0 to −4.0 μm. A second dataset was collected with a phase plate using a GATAN K2 Summit direct electron detector operated in counting mode. Micrographs were collected at x130,000 nominal magnification (1.09 Å pixel size) as 40-frame movies with a total electron dose of 49 e - /Å 2 and −0.5 μm defocus. For the first dataset (no phase-plate), 30-frame movies were corrected for beam-induced movement using 5 × 5 patch alignment with all frames in MotionCor2 ( Zheng et al., 2017 ). Contrast transfer function parameters were estimated on non-dose-weighted micrographs using Gctf v1.06 and particles were picked with crYOLO ( Wagner et al., 2019 ). Subsequent image processing was performed in RELION v3.0.4 and cryoSPARC v2.14.2. Initially 883,184 particles were extracted from 12,085 micrographs in RELION using a box size of 360 pixels. After reference-free 2D classification in cryoSPARC 792,173 cohesin particles were selected and utilized to reconstruct an ab-initio 3D model, which was subsequently used as a starting model for non-uniform refinement. Following 3D refinement in RELION the particle subset was subjected to two rounds of 3D classification using a mask encompassing the cohesin core only. Ultimately 255,148 particles were selected and refined in cryoSPARC using non-uniform refinement followed by local non-uniform refinement of the cohesin core, resulting in a structure at 3.9 Å resolution. The final half-maps were used to produce a density modified map using the Phenix’s tool ResolveCryoEM ( Terwilliger et al., 2020 ). This map showed significant improvements in side chain density and overall interpretability. For the second dataset (phase-plate), 40-frame movies were corrected for beam-induced movement using 5 × 5 patch alignment using all frames in MotionCor2. Contrast transfer function parameters were estimated on non-dose-weighted micrographs using CTFFIND v4.1.10 ( Rohou and Grigorieff, 2015 ) and particles were picked with crYOLO. Subsequent image processing was performed in RELION v3.0.4 and cryoSPARC v2.14.2. Initially 330,024 binned-by-2 particles were extracted from 5,972 micrographs in RELION using a box size of 276 pixels (2.18 Å/pixel). After reference-free 2D classification in cryoSPARC 227,159 cohesin particles were selected and utilized to reconstruct an ab-initio 3D model, which was subsequently used as a starting model for non-uniform refinement. The particles were re-extracted with a smaller box size of 180 pixels (2.18 Å/pixel) and 3D refined in RELION, which revealed a flexible element connected to the cohesin core. To further characterize this peripheral element, particles were 3D-classified without image alignment using a mask encompassing only this density region. 80,325 particles were selected and 3D-autorefined in RELION without a mask. To increase the resolution of the flexible element and assess the conformational changes sampled in the cohesin complex, multibody refinement ( Nakane et al., 2018 ) was performed using masks encompassing either the core or the flexible region. The two signal-subtracted particle stacks generated during multibody refinement in RELION were then exported for non-uniform refinement in cryoSPARC. Although the flexible region could not be resolved to subnanometer resolution, a defined, rigid body could be identified, into which a homology model of Psc3 could be unambiguously docked using the Fit-in map command in UCSF Chimera ( Pettersen et al., 2004 ). The homology model was generated with SWISS-MODEL ( Waterhouse et al., 2018 ) and based on PDB entry 6H8Q ( Li et al., 2018 ). See also Table S2 for the image processing workflow for the cryo-EM core structure as well as the multibody refinement workflow that led to the Identification of a separate rigid body identified as Psc3.
Model building and validation
SWISS-MODEL was used to obtain homology models for Psm1, Psm3, Rad21 (PDB entries 4UX3 and 1W1W) ( Gligoris et al., 2014 ; Haering et al., 2004 ), and Mis4, PDB entry 5T8V ( Kikuchi et al., 2016 ). These models were docked into the cryo-EM map using the Fit in Map command in USCF Chimera ( Pettersen et al., 2004 ). These models were refined against the map using Namdinator ( Kidmose et al., 2019 ) and the resulting model was used as a starting point for manual adjustments in Coot ( Emsley et al., 2010 ). The resulting model was then subjected to an iterative process of real space-refinement using Phenix.real_space_refinement ( Adams et al., 2010 ) with geometry and secondary structure restraints followed by manual inspection and adjustments in Coot. Residues 552-583 from Rad21(chain B) and 209-302 from Mis4 (chain D) were docked into the map by rigid-body fitting of the corresponding homology models. The geometries of the atomic model were evaluated by MolProbity ( Williams et al., 2018 ). Cryo-EM data acquisition, 3D reconstruction information and atomic model refinement statistics are summarized in Table S3 . Figures were prepared with UCSF Chimera and ChimeraX ( Goddard et al., 2018 ).
SDA-based protein-protein crosslink mass spectrometry
(CLMS) analysis Sample preparation Protein crosslinking of the cohesin complex was performed in two conditions. An initial state contained all components except nucleotide. The DNA gripping state was achieved by addition of ADP and BeSO 4 + NaF. All materials (cohesin, loader and DNA) were dialyzed in SDA crosslinking buffer (35 mM HEPES-KOH pH 7.5, 0.5 mM TCEP, 25 mM NaCl, 1 mM MgCl 2 , 15% (w/v) glycerol and 0.003% (w/v) Tween 20) at 4°C for 3 h. Cohesin (200 nM), Mis4-Ssl3 (200 nM) and 125 bp dsDNA (200 nM) were mixed on ice in SDA crosslinking buffer. The reaction in each condition was started in the absence of nucleotide or in the presence of 0.5 mM ADP and 0.5 mM BeSO 4 + 10 mM NaF at 32°C. After 20 min incubation, SDA was added to 50 μg of the cohesin complex at increasing crosslinker weight ratios. (Protein: SDA = 1:1.3, 1:1.9 and 1: 3.8). The diazirine group in SDA was photo-activated using UV irradiation at 365 nm from an ultraviolet crosslinker (Spectrum). Samples were mounted in a 96-well plate, placed on ice at a distance of 5 cm from the UV-A lamp and irradiated for 20 min. After UV irradiation, the sample was further incubated on ice for 2 h to allow further time for NHS crosslinking. The reaction mixtures from the three protein: crosslinker ratios were combined and quenched with 50 mM ammonium bicarbonate. 4 sample volumes of cold acetone were added and incubated at −20°C for 1 h. Precipitated proteins were collected by centrifugation and dried in a vacuum concentrator.
CLMS sample analysis
Both samples were resolubilized in 100 μl digestion buffer (8M urea in 100 mM ammonium bicarbonate) to an estimated protein concentration of 1 mg/ml. Dissolved protein sample was reduced by addition of 0.5 μL 1M dithiothreitol (DTT) at room temperature for 30 min. The free sulfhydryl groups in the sample were then alkylated by adding 3 μl 500 mM iodoacetamide and incubation at room temperature for 20 min in the dark. After alkylation, 0.5 μL 1M DTT was added to quench excess of iodoacetamide. Next, protein samples were digested with LysC (at a 50:1 (m/m) protein to protease ratio) at room temperature for four h. The sample was then diluted with 100 mM ammonium bicarbonate to reach a urea concentration of 1.5 M. Trypsin was added at a 50:1 (m/m) protein to protease ratio to further digest proteins overnight (~15 h) at room temperature. Resulting peptides were desalted using C18 StageTips ( Rappsilber et al., 2007 ). For each sample, resulting peptides were fractionated using size exclusion chromatography in order to enrich for crosslinked peptides ( Leitner et al., 2014 ). Peptides were separated using a Superdex Peptide 3.2/300 column (GE Healthcare) at a flow rate of 10 μl/minute. The mobile phase consisted of 30% (v/v) acetonitrile and 0.1% trifluoroacetic acid. The earliest six peptide-containing fractions (50 μL each) were collected. Solvent was removed using a vacuum concentrator. The fractions were then analyzed by LC-MS/MS. LC-MS/MS analysis was performed using an Orbitrap Fusion Lumos Tribrid mass spectrometer (Thermo Fisher Scientific), connected to an Ultimate 3000 RSLCnano system (Thermo Fisher Scientific). Each size exclusion chromatography fraction was resuspended in 1.6% v/v acetonitrile 0.1% v/v formic acid and analyzed with replicated LC-MS/MS acquisitions. Peptides were injected onto a 50 cm EASY-Spray C18 LC column (Thermo Scientific) that is operated at 50°C column temperature. Mobile phase A consists of water, 0.1% v/v formic acid and mobile phase B consists of 80% v/v acetonitrile and 0.1% v/v formic acid. Peptides were loaded and separated at a flowrate of 0.3 μl/min. Peptides were separated by applying a gradient ranging from 2% to 45% B over 90 min. The gradient was optimized for each fraction. Following the separating gradient, the content of B was ramped to 55% and 95% within 2.5 min each. Eluted peptides were ionized by an EASY-Spray source (Thermo Scientific) and introduced directly into the mass spectrometer. The MS data were acquired in the data-dependent mode with the top-speed option. For each three-second acquisition cycle, the full scan mass spectrum was recorded in the Orbitrap with a resolution of 120,000. The ions with a charge state from 3+ to 7+ were isolated and fragmented using higher-energy collisional dissociation (HCD). For each isolated precursor, one of three collision energy settings (26%, 28% or 30%) was selected for fragmentation using a data-dependent decision tree based on the m/z and charge of the precursor. The fragmentation spectra were then recorded in the Orbitrap with a resolution of 50,000. Dynamic exclusion was enabled with single repeat count and 60 s exclusion duration. MS2 peak lists were generated from the raw mass spectrometric data files using the MSConvert module in ProteoWizard (version 3.0.11729). The default parameters were applied, except that Top MS/MS Peaks per 100 Da was set to 20 and the denoising function was enabled. Precursor and fragment m/z values were recalibrated. Identification of crosslinked peptides was carried out using xiSEARCH software ( https://www.rappsilberlab.org/software/xisearch ) (version 1.7.0) ( Mendes et al., 2019 ). The “initial state” and “gripping state” samples were processed separately. For each sample, peak lists from all LC-MS/MS acquisitions were searched against the sequence and the reversed sequence of cohesin and loader subunits (Psm1, Psm3, Rad21, Psc3, Mis4 and Ssl3). The following parameters were applied for the search: MS accuracy = 4 ppm; MS2 accuracy = 10 ppm; enzyme = trypsin (with full tryptic specificity); allowed number of missed cleavages = 2; missing monoisotopic peak = 2; crosslinker = SDA (the reaction specificity for SDA was assumed to be for lysine, serine, threonine, tyrosine, and protein N-termini on the NHS ester end and any amino acids for the diazirine end); fixed modifications = carbamidomethylation on cysteine; variable modifications = oxidation on methionine and SDA loop link. Identified crosslinked peptide candidates were filtered using xiFDR ( Fischer and Rappsilber, 2017 ). A false discovery rate of 1% on residue-pair level was applied with “boost between” option selected. A list of identified crosslinked residue pairs is reported in Table S4 .
DNA-protein crosslink mass spectrometry
(DPC-MS) analysis Sample preparation For DNA-protein crosslinking, we prepared two types of dsDNA probes. A 125 bp linear dsDNA was amplified by PCR with 5′-biotinylated oligonucleotide TH1 and non-modified oligonucleotide TH5 using pBluescript dsDNA as the template. PCR reaction mixtures contained 5 ng/ml template DNA, 0.3 μM of each primer, 0.2 mM each of dATP, dCTP and dGTP, 0.02 mM dTTP, 0.18 mM aminoallyl-dUTP and 0.025 unit/μl Go-taq DNA polymerase in 1x Go-taq buffer (Promega). A 3 kb circular dsDNA was prepared by primer extension on single stranded DNA. 5′-biotinylated TH1 oligonucleotide primer was annealed to single strand DNA templates of pBluescript, prepared using M13KO7 helper phage ( Murayama et al., 2018 ). For second strand synthesis, the primer-template mix was incubated in 20 mM Tris-HCl (pH 7.5), 10 mM MgCl 2 , 1 mM DTT, 0.4 mM each of dATP, dCTP, dGTP and aminoallyl-dUTP, 0.1 mg/ml BSA and 0.04 unit/μl T7 DNA polymerase (New England Biolabs) at 37°C for 3 h. After synthesis, the buffer of the DNA samples was exchanged to SDAD crosslinking buffer (100 mM NaHCO 3 pH 8.3) using MicroSpin S400 columns (GE Healthcare). 1 μg of dsDNA was incubated with 2 mM SDAD crosslinker in 25 μL of SDAD crosslinking buffer at 25°C overnight. The diazirin-decorated dsDNA (SDAD-DNA) probe was dialyzed in DNA dialysis buffer (10 mM Tris-HCl pH 7.5, 0.1 mM EDTA). For DNA-protein crosslinking 200 nM cohesin, 200 nM Mis4-Ssl3, 20 ng/μl linear 125 bp or circular 3 kb SDAD-DNA probe were mixed in reaction buffer, and the DNA gripping reaction was initiated by addition of 0.5 mM ADP and 0.5 mM BeSO 4 + 10 mM NaF at 32°C for 30 min. An equal volume of 2 x Washing buffer D (35 mM Tris-HCl pH 7.5, 0.5 mM TCEP, 135 mM NaCl and 0.1% (w/v) Triton X-100) was added to the reaction mixture and incubated at 4°C for 10 min. The sample was mounted on a 96-well plate, placed on ice at a distance of 5 cm from the UV-A lamp and irradiated for 10 min, as described above for SDA protein-protein crosslinking. After UV irradiation, the buffer of the samples was exchanged with Protease buffer (100 mM ammonium bicarbonate pH 8.0) using MicroSpin S400 columns. Lys-C protease was added (1:20 (m/m) protease to protein ratio) and incubated at 37°C overnight. To remove non-crosslinked peptide from the DNA, an equal volume of 2 x RIPA buffer (100 mM Tris-HCl pH 8, 100 mM NaCl, 0.2% SDS) was added to the sample, followed by incubation at 50°C for 30 min. The DNA with crosslinked peptides was purified by Superdex75 size exclusion chromatography developed with 20 mM Tris-HCl pH 7.5, 200 mM NaCl. The recovered DNA-peptide complexes in the void fraction were supplemented with NaCl to 1 M final concentration and 0.1% (w/v) Tween-20. The biotinylated DNA was recovered using streptavidin M280 magnetic beads (Invitrogen) at 25°C for 1 h. DNA-beads were washed three times with 1 x RIPA buffer and five times with peptide elution buffer (20 mM Tris-HCl pH 7.5, 200 mM NaCl). DNA-crosslinked peptides were now eluted by addition of peptide elution buffer containing 25 mM DTT and incubation at 37°C for 30 min. In the experiment comparing cohesin’s initial binding state and the gripping state, the incubation and crosslinking were performed as above without or with 0.5 mM BeSO 4 + 10 mM NaF. After the 32°C incubation, the sample was directly mounted on a 96-well plate without washing buffer addition and the plate was UV irradiated on ice for 10 min. The irradiated sample was then treated as described above.
DPC-MS sample analysis
Peptide solutions in the DTT peptide elution buffer were transferred into Total Recovery vials (Waters) for injection without further clean-up or concentration. Samples were analyzed by online nanoflow LC-MS/MS using an Orbitrap Fusion Lumos mass spectrometer (Thermo Scientific) coupled to an Ultimate 3000 RSLCnano (Thermo Scientific). 15 μl of sample was loaded via autosampler into a 20 μl sample loop and pre-concentrated onto an Acclaim PepMap 100 75 μm x 2 cm nanoviper trap column with loading buffer, 2% v/v acetonitrile, 0.05% v/v trifluoroacetic acid, 97.95% water (Optima grade, Fisher Scientific) at a flow rate of 7 μl/min for 6 min in the column oven held at 40°C. Peptides were gradient eluted and separated with a C 18 75 μm x 50 cm, 2 μm particle size, 100 Å pore size, reversed phase EASY-Spray analytical column (Thermo Scientific) at a flow rate of 275 nl/min and with the column temperature held at 40°C, with a spray voltage of 2100 V using the EASY-Spray Source (Thermo Scientific). Gradient elution buffers were A 0.1% v/v formic acid, 5% v/v DMSO, 94.9% v/v water and B 0.1% v/v formic acid, 5% v/v DMSO, 20% v/v water, 74.9% v/v acetonitrile (all Optima grade, Fisher Scientific aside from DMSO, Honeywell Research Chemicals). The gradient elution profile used was 8% B to 40% B over 60 min. The instrument method used an MS1 Orbitrap scan resolution of 120,000 at FWHM m/z 200, quadrupole isolation, mass range 375-1500 m/z, RF Lens 40%, AGC target 4e5, maximum injection time 50 ms and spectra were acquired in profile. Monoisotopic Peak Determination was set to the peptide mode, and only precursors with charge states 2-6 were permitted for selection for fragmentation. Dynamic Exclusion was enabled to exclude after n = 1 times for 20 s with high and low ppm mass tolerances of 10 ppm. MS2 scans were acquired in the ion trap following HCD fragmentation with fixed collision energy of 32% and was performed on all selected precursor masses using a cycle time based on data-dependent mode of acquisition set to 3 s. The parameters used for the HCD MS2 scan were quadrupole isolation with an isolation window width of 1.2 m/z, first mass 110 m/z, AGC target 2e3, maximum injection time 300 ms and the scan data were acquired in centroid mode at the rapid scan rate. A FASTA database containing only the sequences of the six subunits of the cohesin complex and loader was used for the PEAKS search conducted within PEAKS Studio (Bioinformatics Solutions Inc). A modification corresponding to the diazirine moiety after reduction (C 7 H 13 NOS, 159.07178) was created and considered as a variable modification along with the oxidation of methionine residues. Other parameters of the search were digestion enzyme LysC with a maximum of 2 missed cleavages, peptide mass tolerance 5ppm and fragment mass tolerance 0.6 Da. SC-Cy5 crosslinking experiments The SC-Cy5 crosslinker was synthesized as previously described ( Gautier et al., 2009 ). Using crosslinkable cohesin complexes (kleisin-circle or SMC-circle) and a DNA-loop substrate, we performed DNA gripping assay as described above. Following the DNA gripping reaction, DNA-beads were washed 3 times with Washing buffer D (35 mM Tris-HCl pH 7.5, 0.5 mM TCEP, 135 mM NaCl and 0.1% (w/v) Triton X-100), and supplemented with 4 μM SC-Cy5 and 1 mM DTT in Washing buffer D. Crosslinking was carried out at 32°C for 60 min. DNA-beads were then divided into three parts. One part was immediately eluted with SDS sample buffer containing 3 mM biotin and served as the input sample. The second sample was washed 5 times with Washing buffer D. The third sample was washed 5 times with SDS buffer (35 mM Tris-HCl pH 7.5, 0.5 mM TCEP, 100 mM NaCl and 0.1% SDS). The second and third samples were then supplemented with SDS sample buffer containing 3 mM biotin and boiled for 10 min to elute DNA and protein. Samples were analyzed by SDS-PAGE, followed by in-gel detection of Cy5 or immunoblotting with indicated antibodies. To further evaluate topological DNA entrapment by the circularized kleisin, beads following SDS washes were divided into two, equilibrated with DNA digestion buffer (35 mM Tris-HCl pH 7.5, 0.5 mM TCEP, 100 mM NaCl, 10 mM MgCl 2 , 0.1 mg/ml BSA, 0.1% Triton X-100) and treated without or with 1 U/μl restriction enzyme PstI in DNA digestion buffer. Alternatively, the sample was equilibrated with TEV digestion buffer (50 mM Tris-HCl pH 8.0, 100 mM NaCl, 0.5 mM EDTA, 1 mM DTT) and treated without or with 0.25 U/μl TEV protease in TEV digestion buffer. After a 20 min incubation at 32°C, the beads and supernatant fractions were separated, SDS sample buffer containing 3 mM biotin added to each and samples boiled for 10 min. ATPase assay Cohesin (150 nM) and Mis4-Ssl3 (100 nM) were mixed with pBluescript dsDNA in reaction buffer (15 μL in final volume). The reactions were initiated by addition of 0.25 mM ATP, spiked with [γ-33P]-ATP, and incubated at 32°C. Aliquots (2 μl) were taken after 0, 15, 30, and 60 min and terminated by addition of 6 μL of 0.5 M EDTA pH 8.0. The products were separated by thin layer chromatography on TCL polyethylenimine cellulose F sheets (Merck), developed with 400 mM LiCl in 1 M formic acid. Plates were analyzed using a Typhoon FLA 9500 Phosphor-imager (GE Healthcare).
Supplemental Information Document S1. Figures S1–S7 Table S1.
Yeast Strains
Used in this Study, Related to STAR Methods Table S2.
Image Processing Workflow for the Cryo-EM Core
Structure as well as the Multibody Refinement
Workflow that Led to Identification of a Separate Rigid Body Identified as Psc3, Related to STAR Methods Table S3. Cryo-EM Data Collection, Refinement, and Validation Statistics, Related to STAR Methods Table S4. List of Identified Crosslinked Residue Pairs, Related to STAR Methods Video S1. DNA Entry into the Cohesin Ring Document S2. Article plus Supplemental Information
📊 Figures
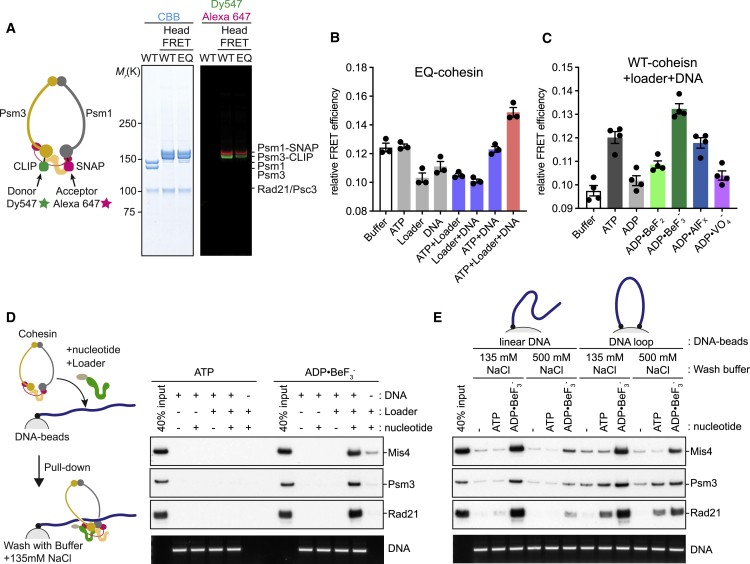
Figureu00a01
Cohesin ATPase Head Engagement Leads to a DNA Gripping State (A) Schematic of purification and labeling of wild-type (WT) and Walker B mutant (EQ) cohesin to measure FRET between the Psm1 and Psm3 ATP...
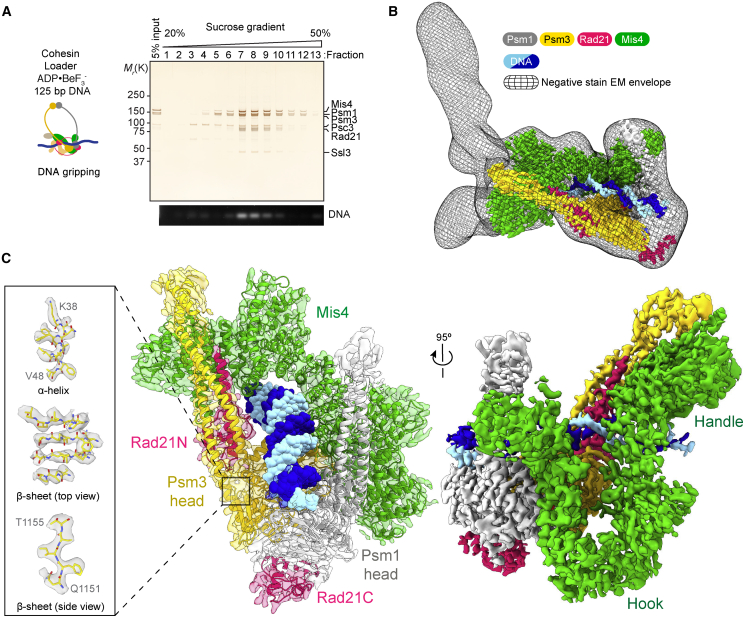
Figureu00a02
Overview Structure of Cohesin during Its Loading onto DNA (A) Schematic of EM sample preparation. The DNA gripping was separated by sucrose gradient centrifugation. The protein and DNA composition of ...
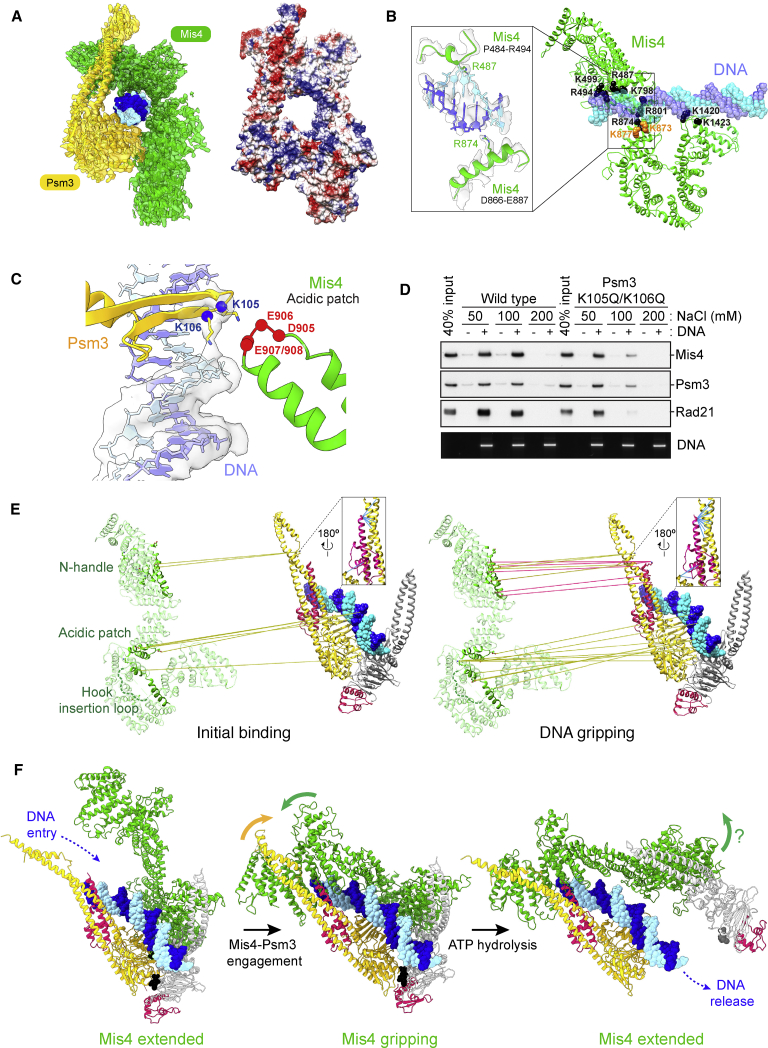
Figureu00a03
Molecular Mechanism of the Cohesin Loader (A) Psm3 and Mis4 topologically embrace DNA in the gripping state. Shown are an atomic model of Psm3, Mis4, and DNA built into the cryo-EM map (left) as well ...
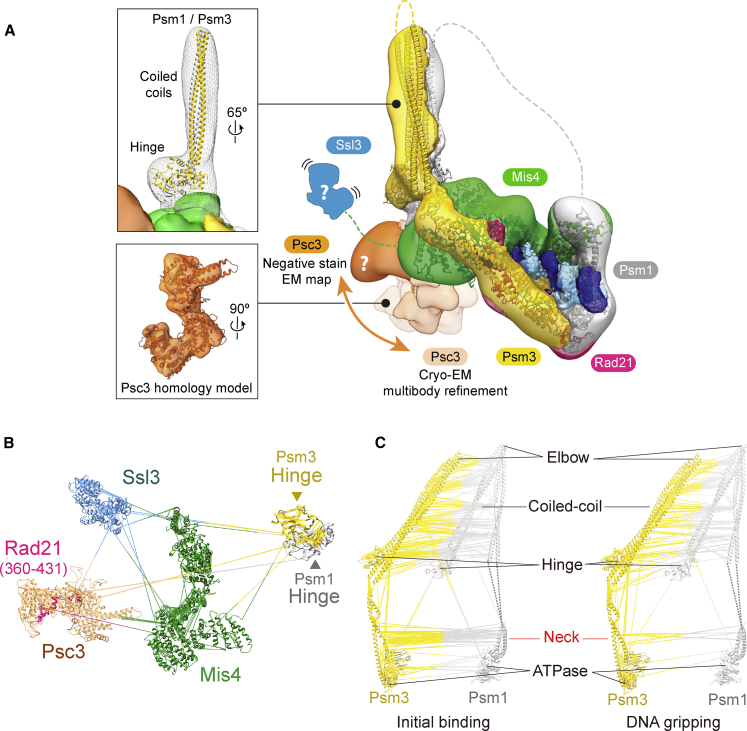
Figureu00a04
A Hybrid Structural Model of the Cohesin Complex in the Gripping State (A) Atomic model of the cohesin core docked into the negative-stain EM envelope. An atomic model of the hinge and coiled coil is ...
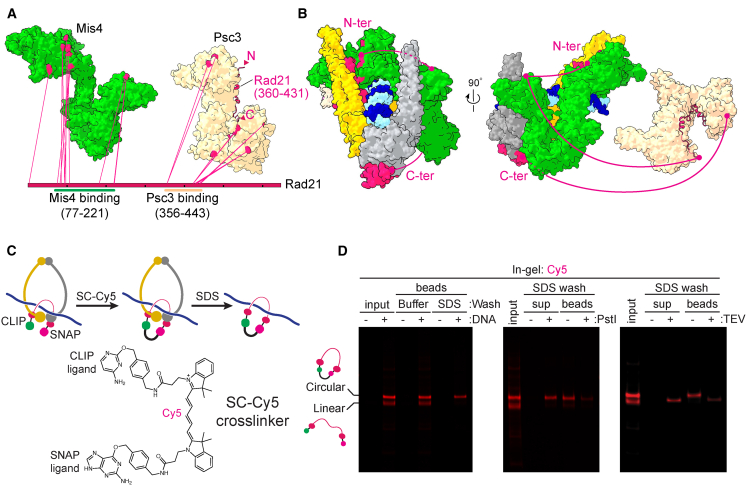
Figureu00a05
The Kleisin Path in the Gripping State (A) Crosslinks of Rad21 with Mis4 and Psc3 in the gripping state mapped onto their atomic models. Rad21 amino acids 360u2013431 are modeled based on the crystal ...
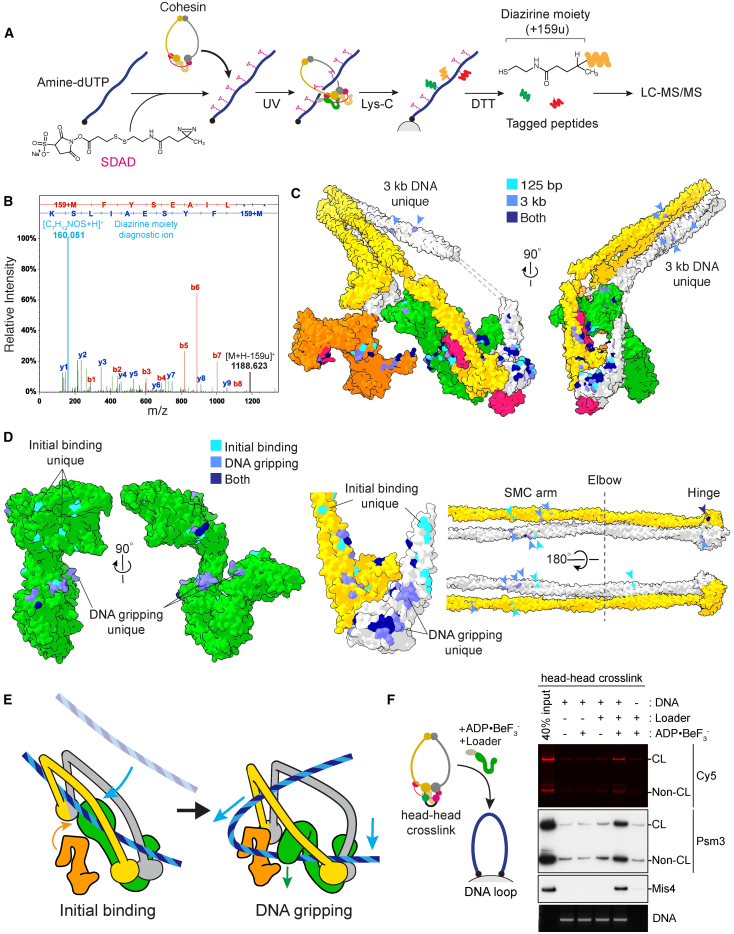
Figureu00a06
The DNA Trajectory into the Cohesin Ring (A) Schematic of the DPC-MS workflow. See the main text for details. (B) A representative mass spectrum of a peptide containing a diazirine mass tag. The diagn...
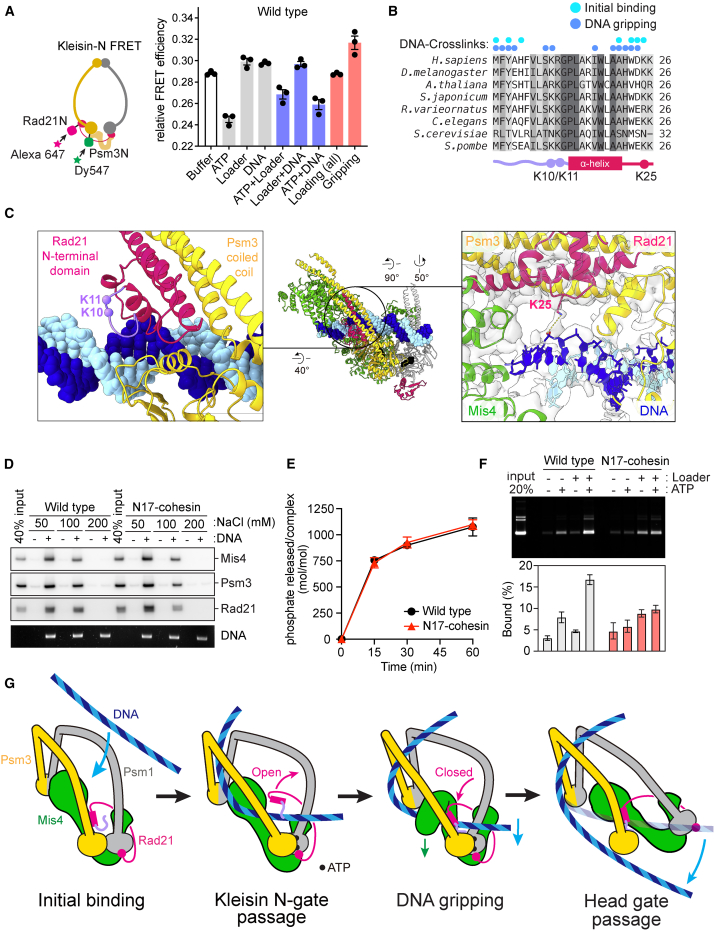
Figureu00a07
A Kleisin N-terminal Tail Guides DNA into the Cohesin Ring (A) Schematic of the kleisin N-gate FRET construct. FRET efficiencies at the kleisin N-gate were recorded under the indicated conditions usin...
Figure images are served from the NIH/NLM PubMed Central Open Access Subset or Europe PMC; copyright remains with the publishers and authors.
💬 Discussion
0 commentsNo comments yet. Be the first to start a discussion!
Leave a Comment