Abstract
Summary Invasion and metastasis are aggressive cancer phenotypes that are highly related to the ability of cancer cells to degrade extracellular matrix (ECM). At the cellular level, specialized actin-rich structures called invadopodia mediate focal matrix degradation by serving as exocytic sites for ECM-degrading proteinases. Adhesion signaling is likely to be a critical regulatory input to invadopodia, but the mechanism and location of such adhesion signaling events are poorly understood. Here, we report that adhesion rings surround invadopodia shortly after formation and correlate strongly with invadopodium activity on a cell-by-cell basis. By contrast, there was little correlation of focal adhesion number or size with cellular invadopodium activity. Prevention of adhesion ring formation by inhibition of RGD-binding integrins or knockdown (KD) of integrin-linked kinase (ILK) reduced the number of ECM-degrading invadopodia and reduced recruitment of IQGAP to invadopodium actin puncta. Furthermore, live cell imaging revealed that the rate of extracellular MT1-MMP accumulation at invadopodia was greatly reduced in both integrin-inhibited and ILK-KD cells. Conversely, KD of MT1-MMP reduced invadopodium activity and dynamics but not the number of adhesion-ringed invadopodia. These results suggest a model in which adhesion rings are recruited to invadopodia shortly after formation and promote invadopodium maturation by enhancing proteinase secretion. Since adhesion rings are a defining characteristic of podosomes, similar structures formed by normal cells, our data also suggest further similarities between invadopodia and podosomes.
🔬 Techniques
🔭 Microscopes
💻 Software
✨ Fluorophores
🧪 Sample Preparation
🔬 Cell Lines
🏭 Microscope Brands
🧪 Reagent Suppliers
🔎 Objectives
💻 Software Details
🏛️ Research Organizations (ROR)
Affiliated research institutions:
📋 Methods
Reagents Antibodies: Cortactin, 4F11 (Upstate Biotechnology, Lake Placid, NY), Paxillin, Y113 (Abcam, Cambridge, MA), Vinculin, hVin-1 (Sigma, St. Louis, MO), IQGAP, H-109 (Santa Cruz, Santa Cruz, CA), Alexa Fluor 546 or 633 phalloidin (Invitrogen, Grand Island, NY). Peptides: Gly-Arg-Gly-Asp-Ser-Pro (GRGDSP, Sigma), and Gly-Arg-Gly-Glu-Ser-Pro (GRGESP, American Peptide Co., Sunnyvale, CA). tdTomato-F-tractin (Tom-Tract) was a gift of Dr. Robert Fischer at NHLBI and was created by cloning the 9-52 stretch of the F-actin binding protein ITPKA ( Johnson and Schell, 2009 ) into pCMV-tdTomato (Clontech, Mountain View, CA). Cell culture and stable cell lines MCF10A-CA1d breast cancer cells were obtained from Dr. Fred Miller (Karmanos Institute, MI) and have been previously described ( Santner et al., 2001 ). Cells were cultured in DMEM/F12 supplemented with 5% horse serum (HyClone, Thermo Scientific, Lafayette, CO), 0.1 µg/ml cholera toxin (Calbiochem, Merck KGaA, Darmstadt, Germany), 10 µg/ml insulin (Gibco, Invitrogen), 0.5 µg/ml hydrocortisone (Sigma), and 100 ng/ml EGF (Invitrogen) at 37°C with constant humidity. SCC61 HNSCC cells were previously described ( Clark et al., 2007 ; Weichselbaum et al., 1986 ) and were cultured in DMEM supplemented with 20% fetal bovine serum (HyClone) and 0.4 mg/ml hydrocortisone at 37°C. Tom-Tract was transiently transfected into SCC61 cells at a 1:1 µg DNA:µl Lipofectamine 2000 (Invitrogen) ratio for 6 hours. GFP-paxillin was cloned from pEGFP-N3-Paxillin, a gift of Dr. Donna Webb (Vanderbilt), into the pENTR-TOPO vector and recombined into the LZRS-GW-Neo retroviral vector, a gift from Dr. Al Reynolds (Vanderbilt), using the Gateway recombination system (Invitrogen). MT1-MMP-pHLuorin (MT1-pHLuor) was a gift from Dr. Philippe Chavrier (Institut Curie, Paris). MT1-pHLuor was PCR-cloned into the pLenti6 lentiviral vector (Invitrogen). Control (non-targeting shRNA (NTC), Addgene) and two shRNA constructs targeting ILK (sh1- 5′-CUGAACAAACACUCUGGCAUU-3′ (Thermo Scientific), sh2- 5′-GCAAUGACAUUGUCGUGAAGG-3′ (Sigma)) were obtained in the lentiviral vector pLKO.1-puro. MT1-MMP targeting shRNA (MT1 sh1- 5′-CAGCGATGAAGTCTTCACTTA -3′, sh2- 5′-CAGCCTCTCACTACTCTTTC -3′) or shLacZ as a control were subcloned into the lentiviral vector pLenti-BlockIt (Invitrogen). Retrovirus and lentivirus were produced using Phoenix (Dr. Garry Nolan, Stanford) or 293FT cells, respectively, and SCC61 cells were incubated with viral supernatant overnight and later selected with the appropriate markers. Fixed cell microscopy and invadopodium analysis The ECM degradation assay has been previously described ( Bowden et al., 2001 ; Clark et al., 2007 ). Briefly, MatTek culture dishes (MatTek Corp., Ashland, MA) were coated with a thin layer of 1% gelatin that was crosslinked with 0.5% glutaraldehyde prior to addition of 50 µg/ml FITC-conjugated fibronectin (FITC-FN). Cells were cultured in a 1:1 ratio of DMEM:RPMI-1640 (or L-15 for live cell imaging) with 5% NuSerum (Gibco), 10% FBS, and 100 ng/ml EGF for 20 hours before fixation with 4% paraformaldehyde and immunostaining. Polyacrylamide substrate preparation was also previously described ( Alexander et al., 2008 ; Parekh et al., 2011 ). Widefield fluorescent images were captured on a Nikon Eclipse TE2000-E microscope with a 40× Plan Fluor oil immersion objective lens. Degradation area per cell was determined using MetaMorph software (Molecular Devices, Sunnyvale, CA) by tracing a region around the cellular actin footprint and measuring the thresholded area of dark spots in the FITC-FN in that region. Fixed cell confocal images were taken using a Zeiss LSM 510 microscope with a Plan Apo 63× oil immersion objective lens with Argon-488 nm, HeNe-543 nm, and HeNe-633 nm lasers. Images were taken at a scan speed of 8 and 4 scans were averaged per acquisition. Degradation area per cell was determined as above. Invadopodia were identified as morphologically characteristic round actin or cortactin puncta ≥1 µm in diameter found at the bottom of the cell ( Clark et al., 2007 ) and quantitated from confocal images. If ECM degradation was associated with an invadopodium, it was classified as “active”; otherwise it was classified as “inactive”. The presence of an adhesion ring was defined as paxillin or vinculin fluorescence above background surrounding the invadopodia. Invadopodium metrics (adhesion ringed, non-ringed, total, active and inactive invadopodia) were manually counted. For focal adhesion analyses on paxillin-immunostained cells, the central region of the cell with high background cytoplasmic fluorescence was excluded and the remaining periphery was thresholded. The number and area of peripheral focal adhesions per cell was then determined with the “Analyze Particles” function in ImageJ (NIH). For IQGAP localization analyses, SCC61 cells were plated on 1% gelatin/FITC-FN and fixed and stained for actin and IQGAP. Images were obtained with the Zeiss LSM 510 confocal as described above. The pinhole was opened slightly (1.4 µm optical slice) to account for the slightly higher Z-axis localization of IQGAP at invadopodia. Equal laser power, digital gain and offset settings were used in each experiment and actin and IQGAP signals were within the dynamic range. Invadopodia were traced using the actin immunostaining and average intensity of the actin and IQGAP signals within the traced regions was obtained using ImageJ.
Show full methods section
Reagents Antibodies: Cortactin, 4F11 (Upstate Biotechnology, Lake Placid, NY), Paxillin, Y113 (Abcam, Cambridge, MA), Vinculin, hVin-1 (Sigma, St. Louis, MO), IQGAP, H-109 (Santa Cruz, Santa Cruz, CA), Alexa Fluor 546 or 633 phalloidin (Invitrogen, Grand Island, NY). Peptides: Gly-Arg-Gly-Asp-Ser-Pro (GRGDSP, Sigma), and Gly-Arg-Gly-Glu-Ser-Pro (GRGESP, American Peptide Co., Sunnyvale, CA). tdTomato-F-tractin (Tom-Tract) was a gift of Dr. Robert Fischer at NHLBI and was created by cloning the 9-52 stretch of the F-actin binding protein ITPKA ( Johnson and Schell, 2009 ) into pCMV-tdTomato (Clontech, Mountain View, CA). Cell culture and stable cell lines MCF10A-CA1d breast cancer cells were obtained from Dr. Fred Miller (Karmanos Institute, MI) and have been previously described ( Santner et al., 2001 ). Cells were cultured in DMEM/F12 supplemented with 5% horse serum (HyClone, Thermo Scientific, Lafayette, CO), 0.1 µg/ml cholera toxin (Calbiochem, Merck KGaA, Darmstadt, Germany), 10 µg/ml insulin (Gibco, Invitrogen), 0.5 µg/ml hydrocortisone (Sigma), and 100 ng/ml EGF (Invitrogen) at 37°C with constant humidity. SCC61 HNSCC cells were previously described ( Clark et al., 2007 ; Weichselbaum et al., 1986 ) and were cultured in DMEM supplemented with 20% fetal bovine serum (HyClone) and 0.4 mg/ml hydrocortisone at 37°C. Tom-Tract was transiently transfected into SCC61 cells at a 1:1 µg DNA:µl Lipofectamine 2000 (Invitrogen) ratio for 6 hours. GFP-paxillin was cloned from pEGFP-N3-Paxillin, a gift of Dr. Donna Webb (Vanderbilt), into the pENTR-TOPO vector and recombined into the LZRS-GW-Neo retroviral vector, a gift from Dr. Al Reynolds (Vanderbilt), using the Gateway recombination system (Invitrogen). MT1-MMP-pHLuorin (MT1-pHLuor) was a gift from Dr. Philippe Chavrier (Institut Curie, Paris). MT1-pHLuor was PCR-cloned into the pLenti6 lentiviral vector (Invitrogen). Control (non-targeting shRNA (NTC), Addgene) and two shRNA constructs targeting ILK (sh1- 5′-CUGAACAAACACUCUGGCAUU-3′ (Thermo Scientific), sh2- 5′-GCAAUGACAUUGUCGUGAAGG-3′ (Sigma)) were obtained in the lentiviral vector pLKO.1-puro. MT1-MMP targeting shRNA (MT1 sh1- 5′-CAGCGATGAAGTCTTCACTTA -3′, sh2- 5′-CAGCCTCTCACTACTCTTTC -3′) or shLacZ as a control were subcloned into the lentiviral vector pLenti-BlockIt (Invitrogen). Retrovirus and lentivirus were produced using Phoenix (Dr. Garry Nolan, Stanford) or 293FT cells, respectively, and SCC61 cells were incubated with viral supernatant overnight and later selected with the appropriate markers. Fixed cell microscopy and invadopodium analysis The ECM degradation assay has been previously described ( Bowden et al., 2001 ; Clark et al., 2007 ). Briefly, MatTek culture dishes (MatTek Corp., Ashland, MA) were coated with a thin layer of 1% gelatin that was crosslinked with 0.5% glutaraldehyde prior to addition of 50 µg/ml FITC-conjugated fibronectin (FITC-FN). Cells were cultured in a 1:1 ratio of DMEM:RPMI-1640 (or L-15 for live cell imaging) with 5% NuSerum (Gibco), 10% FBS, and 100 ng/ml EGF for 20 hours before fixation with 4% paraformaldehyde and immunostaining. Polyacrylamide substrate preparation was also previously described ( Alexander et al., 2008 ; Parekh et al., 2011 ). Widefield fluorescent images were captured on a Nikon Eclipse TE2000-E microscope with a 40× Plan Fluor oil immersion objective lens. Degradation area per cell was determined using MetaMorph software (Molecular Devices, Sunnyvale, CA) by tracing a region around the cellular actin footprint and measuring the thresholded area of dark spots in the FITC-FN in that region. Fixed cell confocal images were taken using a Zeiss LSM 510 microscope with a Plan Apo 63× oil immersion objective lens with Argon-488 nm, HeNe-543 nm, and HeNe-633 nm lasers. Images were taken at a scan speed of 8 and 4 scans were averaged per acquisition. Degradation area per cell was determined as above. Invadopodia were identified as morphologically characteristic round actin or cortactin puncta ≥1 µm in diameter found at the bottom of the cell ( Clark et al., 2007 ) and quantitated from confocal images. If ECM degradation was associated with an invadopodium, it was classified as “active”; otherwise it was classified as “inactive”. The presence of an adhesion ring was defined as paxillin or vinculin fluorescence above background surrounding the invadopodia. Invadopodium metrics (adhesion ringed, non-ringed, total, active and inactive invadopodia) were manually counted. For focal adhesion analyses on paxillin-immunostained cells, the central region of the cell with high background cytoplasmic fluorescence was excluded and the remaining periphery was thresholded. The number and area of peripheral focal adhesions per cell was then determined with the “Analyze Particles” function in ImageJ (NIH). For IQGAP localization analyses, SCC61 cells were plated on 1% gelatin/FITC-FN and fixed and stained for actin and IQGAP. Images were obtained with the Zeiss LSM 510 confocal as described above. The pinhole was opened slightly (1.4 µm optical slice) to account for the slightly higher Z-axis localization of IQGAP at invadopodia. Equal laser power, digital gain and offset settings were used in each experiment and actin and IQGAP signals were within the dynamic range. Invadopodia were traced using the actin immunostaining and average intensity of the actin and IQGAP signals within the traced regions was obtained using ImageJ.
Live cell imaging Adhesion ring imaging
For adhesion ring imaging, live cell confocal images were taken using a Zeiss LSM 710 microscope with a Plan Apo 63× oil immersion objective lens with Argon-488 nm and HeNe-561 nm lasers. Time-lapse images were obtained every 15 seconds at a scan speed of 8 with 4 images averaged per acquisition. Time of invadopodia and paxillin ring appearance was manually determined.
Imaging of Tom-Tractin alone or with MT1-pHLuorin
Imaging of Tom-Tractin alone or with MT1-pHLuorin was performed using an Applied Precision DeltaVision Core microscope with a Plan Apo 60× oil immersion objective lens. SCC61 cells expressing Tom-Tractin and/or MT1-pHLuorin were seeded in the ECM degradation assay on 1% gelatin/unlabeled-FN and placed in a heated microscope chamber at 37°C 2 hours prior to imaging. When used, RGE or RGD peptides were added at the time of cell seeding. Images were then obtained every 15 seconds and processed with 10 iterations of constrained iterative deconvolution using Softworx 5.0 (Applied Precision, Issaquah, WA). For live-cell invadopodium analyses, the actin-containing invadopodia were traced at their largest area and fluorescence intensity of Tom-Tract and MT1-pHLuorin was determined at each time point using Metamorph. The Tom-Tract and MT1-pHLuorin signal at each time point was background corrected at each invadopodium with an identical traced region placed in a similar area of the cell but lacking an invadopodium. With these data, invadopodium formation rate, lifetime, and MT1-pHLuorin accumulation at invadopodia were determined as described in the manuscript.
Statistics
Data sets were tested for normality using the Kolmogorov-Smirnov normality test in GraphPad InStat3 (GraphPad Software, La Jolla, CA). Groups of non-normal data were compared using the Mann-Whitney rank sum test, while parametric data were compared with an unpaired t-test. Non-normal data were plotted as box and whiskers, which show respectively the 25–75 th and 5–95 th percentiles with the dotted red line indicating the mean and the black line indicating the median. For the Spearman rank analysis performed in Fig. 1 , comparisons between degradation area per cell and each other data set were performed in GraphPad InStat3. A perfect positive correlation = 1, no correlation = 0 and a perfect negative correlation = −1, and p values represent a correlation significantly different than no correlation.
📊 Figures
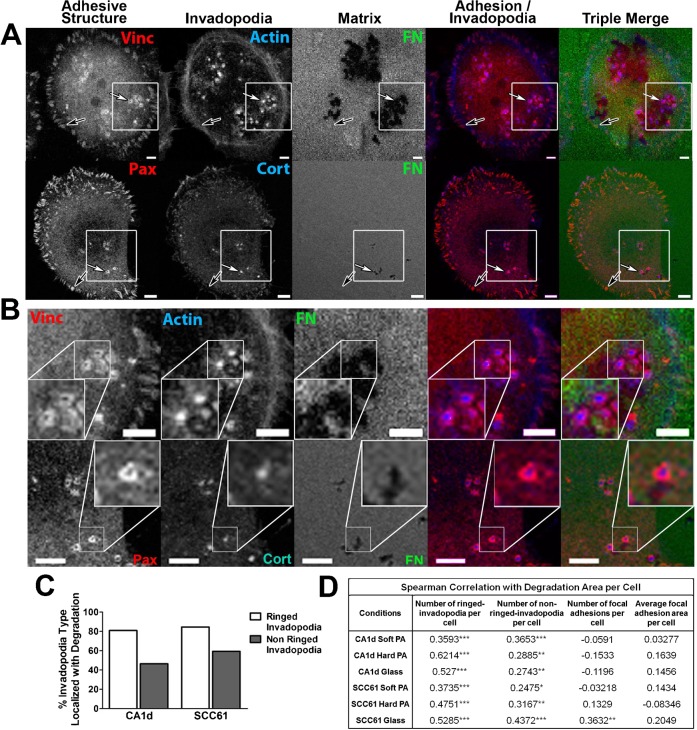
Fig. 1.
Adhesion ring localization at invadopodia correlates with invadopodium-associated extracellular matrix degradation.
( A ) Confocal images of CA1d cells cultured on 1% crosslinked gelatin/FITC-FN (u201cMatrixu201d, green in triple merge) and immunostained for vinculin (Vinc) or paxillin (Pax) to mark adhesion struct...
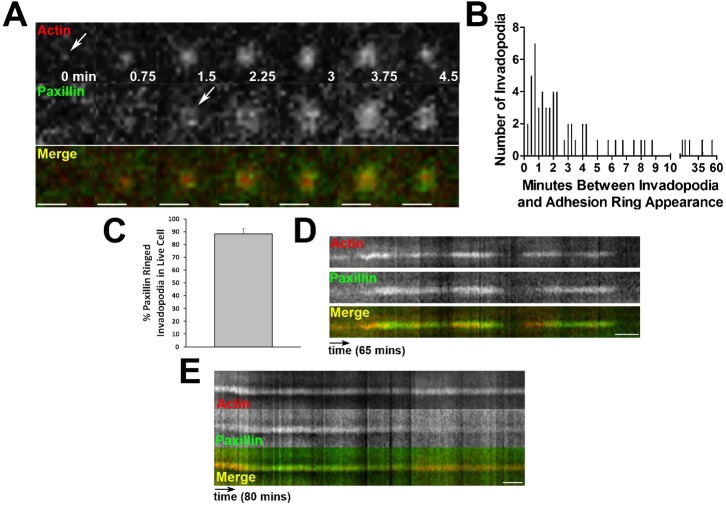
Fig. 2.
Adhesion rings form following actin polymerization at invadopodia.
( A ) Zoomed images of a single invadopodium over time from time-lapse confocal imaging of SCC61 cells expressing GFP-Paxillin (green in merge) and Tom-Tractin (Actin, red in merge). Scale bar u200a=u...
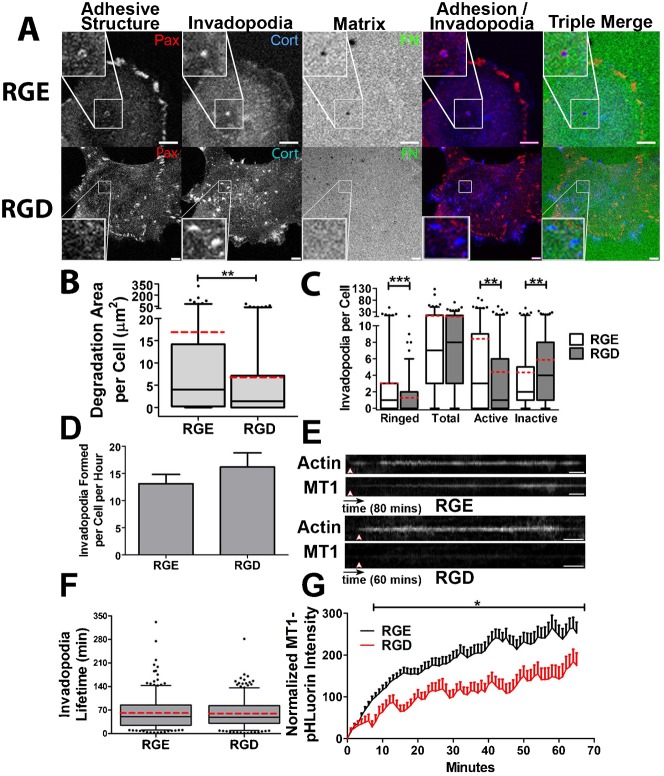
Fig. 3.
Integrin activity is critical for adhesion ring formation and invadopodium activity.
( Au2013C ) SCC61 cells were cultured on FITC-FN/1% gelatin (FN, green) and treated with RGD or RGE peptide control (250u2005u00b5g/ml) for 16u2005hours then immunostained for paxillin (Pax, red) and ...
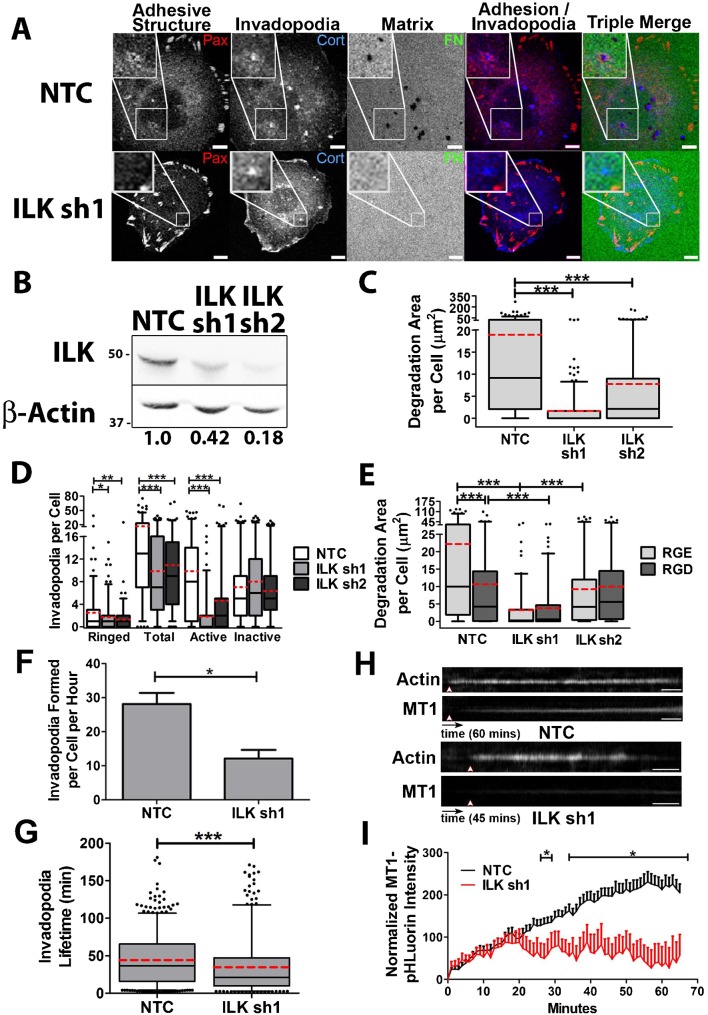
Fig. 4.
Integrin-linked kinase controls adhesion ring formation, invadopodium dynamics and activity.
( Au2013E ) SCC61 cells stably expressing shRNA against ILK1 (sh1, sh2) or non-targeting control (NTC) shRNA were cultured on FITC-FN/1% gelatin for 16u2005hours. (A) Confocal images. Scale bars u200a...
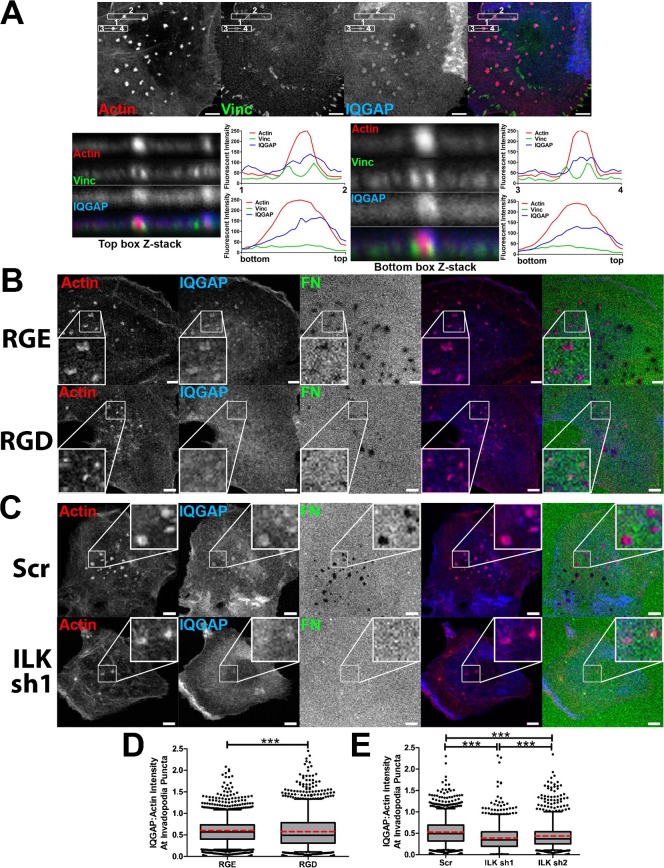
Fig. 5.
Localization of IQGAP to invadopodia is dependent on integrins and ILK.
( A ) Confocal images of SCC61 cells cultured on unlabeled-FN/1% gelatin for 16u2005hours and immunostained for actin (red), IQGAP (blue) and vinculin (Vinc, green). Confocal Z-stacks of boxed invadop...
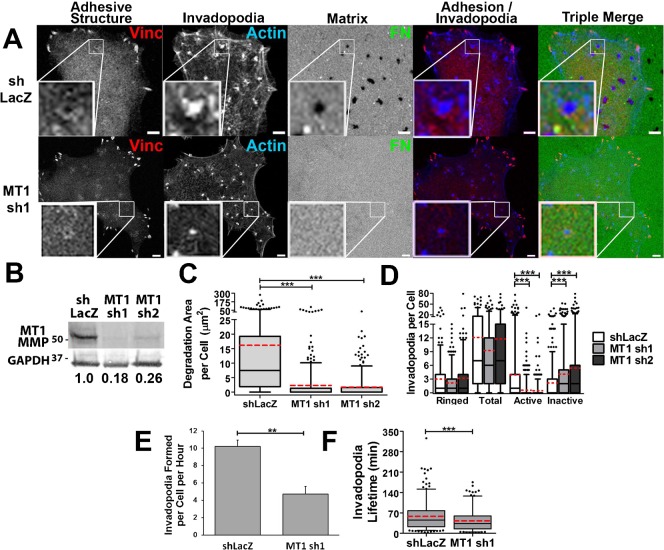
Fig. 6.
MT1-MMP is required for invadopodium-associated ECM degradation, but not for adhesion ring localization.
( Au2013D ) SCC61 cells stably expressing shRNA constructs against MT1-MMP (MT1 sh1 or sh2) or shLacZ control oligo were cultured on FITC-FN/gelatin substrates for 16u2005hours and then fixed and immu...
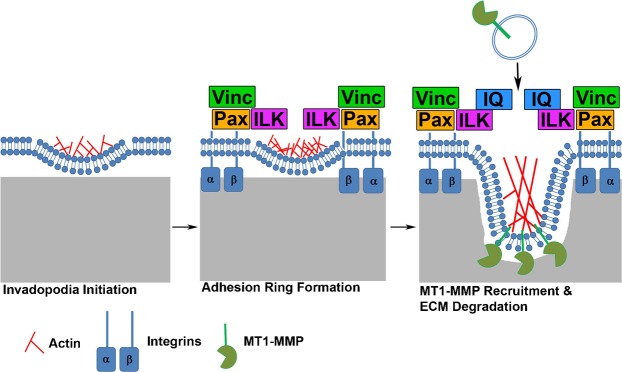
Fig. 7.
Model of invadopodium maturation.
Initial actin puncta appearance is followed by adhesion ring structure formation including integrins (u03b1,u03b2), ILK, paxillin (Pax) and vinculin (Vinc). Ring formation leads to enhanced MT1-MMP re...
Figure images are served from the NIH/NLM PubMed Central Open Access Subset or Europe PMC; copyright remains with the publishers and authors.
💬 Discussion
0 commentsNo comments yet. Be the first to start a discussion!
Leave a Comment