Abstract
Cellular senescence--the permanent arrest of cycling in normally proliferating cells such as fibroblasts--contributes both to age-related loss of mammalian tissue homeostasis and acts as a tumour suppressor mechanism. The pathways leading to establishment of senescence are proving to be more complex than was previously envisaged. Combining in-silico interactome analysis and functional target gene inhibition, stochastic modelling and live cell microscopy, we show here that there exists a dynamic feedback loop that is triggered by a DNA damage response (DDR) and, which after a delay of several days, locks the cell into an actively maintained state of 'deep' cellular senescence. The essential feature of the loop is that long-term activation of the checkpoint gene CDKN1A (p21) induces mitochondrial dysfunction and production of reactive oxygen species (ROS) through serial signalling through GADD45-MAPK14(p38MAPK)-GRB2-TGFBR2-TGFbeta. These ROS in turn replenish short-lived DNA damage foci and maintain an ongoing DDR. We show that this loop is both necessary and sufficient for the stability of growth arrest during the establishment of the senescent phenotype.
🔬 Techniques
🔭 Microscopes
💻 Software
✨ Fluorophores
🧪 Sample Preparation
🔬 Cell Lines
🏭 Microscope Brands
🧪 Reagent Suppliers
🔎 Objectives
💻 Software Details
🏛️ Research Organizations (ROR)
Affiliated research institutions:
📋 Methods
Cells and tissues T19 cells containing a doxycycline inducible TRF2 ΔBΔM and the retroviral expression vector pLPCNMyc-TRF2 ΔBΔM were gifts from T de Lange, Rockefeller University, NY ( van Steensel et al, 1998 ). MRC-5 human embryonic lung fibroblasts (PD 38) were infected with pLPCNMyc-TRF2 ΔBΔM retrovirus.
Expression of TRF2
ΔBΔM was monitored using an anti-FLAG M2 mouse monoclonal antibody (Sigma) in T19 cells or the anti-Myc antibody Myc-FITC (#46-0307, Invitrogen) in infected MRC5. MEFs were grown under 3% ambient oxygen. Transgenic mice were generated and MEFs as well as brain and gut sections from 12–15-months-old mice were prepared as described ( Choudhury et al, 2007 ). Experiments were approved by the local ethics committee. Inhibitors MRC-5 cells at PD 25-30 were transiently transfected with either control untargeted siRNA, TP53 siRNA (SignalSilence ® p53 siRNA kit, Cell Signalling Technology), CDKN1A siRNA (SignalSilence ® p21 Waf1/Cip1 siRNA human specific), MAPK14 siRNA (SignalSilence ® pool p38 MAPK siRNA) or GADD45A siRNA (GADD45A Validated Stealth TM DuoPak, Invitrogen) using nucleofection (Amaxa) according to the supplier's protocols. MAPK14 activity was inhibited using 10 μM SB202190 (Sigma) or SB203580 (Tocris Bioscience). Inhibition was confirmed by western blot using anti-phospho-p38 MAPK (mouse monoclonal, Cell Signalling) and anti-p38 MAPK (rabbit polyclonal, Cell Signalling). Inhibition of the TGFβ pathway was performed using TGFβR2 antibody (rabbit polyclonal, Cell Signalling) or 10 μM SB431542 (Tocris Bioscience). Secreted human TGFβ1 was measured using Quantikine ® Human TGF-β1 Immunoassay (#DB100B, R&D Systems).
Show full methods section
Cells and tissues T19 cells containing a doxycycline inducible TRF2 ΔBΔM and the retroviral expression vector pLPCNMyc-TRF2 ΔBΔM were gifts from T de Lange, Rockefeller University, NY ( van Steensel et al, 1998 ). MRC-5 human embryonic lung fibroblasts (PD 38) were infected with pLPCNMyc-TRF2 ΔBΔM retrovirus.
Expression of TRF2
ΔBΔM was monitored using an anti-FLAG M2 mouse monoclonal antibody (Sigma) in T19 cells or the anti-Myc antibody Myc-FITC (#46-0307, Invitrogen) in infected MRC5. MEFs were grown under 3% ambient oxygen. Transgenic mice were generated and MEFs as well as brain and gut sections from 12–15-months-old mice were prepared as described ( Choudhury et al, 2007 ). Experiments were approved by the local ethics committee. Inhibitors MRC-5 cells at PD 25-30 were transiently transfected with either control untargeted siRNA, TP53 siRNA (SignalSilence ® p53 siRNA kit, Cell Signalling Technology), CDKN1A siRNA (SignalSilence ® p21 Waf1/Cip1 siRNA human specific), MAPK14 siRNA (SignalSilence ® pool p38 MAPK siRNA) or GADD45A siRNA (GADD45A Validated Stealth TM DuoPak, Invitrogen) using nucleofection (Amaxa) according to the supplier's protocols. MAPK14 activity was inhibited using 10 μM SB202190 (Sigma) or SB203580 (Tocris Bioscience). Inhibition was confirmed by western blot using anti-phospho-p38 MAPK (mouse monoclonal, Cell Signalling) and anti-p38 MAPK (rabbit polyclonal, Cell Signalling). Inhibition of the TGFβ pathway was performed using TGFβR2 antibody (rabbit polyclonal, Cell Signalling) or 10 μM SB431542 (Tocris Bioscience). Secreted human TGFβ1 was measured using Quantikine ® Human TGF-β1 Immunoassay (#DB100B, R&D Systems).
Microscopy
Transmission electron microscopy was performed using conventional techniques. All fluorescence microscopy was performed in confocal mode (Zeiss LSM510). Foci frequencies and fluorescence intensities were always measured under identical excitation and emission conditions using a 63 × (NA=1.4) objective and a 1 Airy unit pinhole. For broad-band autofluorescence of 5 μm tissue sections a 20 × (NA=0.5) objective with a pinhole equivalent to an 11 μm z-slice was used. The sample was excited at 458 nm and fluorescence emission captured above 475 nm, while simultaneously capturing a transmission image. Fluorescence intensities per cell or per crypt were quantified in ImageJ ( http://rsb.info.nih.gov/ij/ ). MMP in live cells was measured by FACS ( Passos et al, 2007a ) or in a LSM510 equipped with a Solent incubator (Solent Scientific) at 37°C with humidified 5% CO 2 , using a 63 × (NA=1.4) objective; 100 nM Mitotracker Green and 16 nM TMRM (tetramethylrhodamine methyl ester, Invitrogen) were loaded in serum-free medium for 30 min at 37°C. Mitotracker Green fluorescence (proportional to total mitochondrial mass) and TMRM fluorescence (proportional to MMP) were captured using 488 and 543 nm excitation and 505–530 nm bandpass or 560 nm longpass emission, respectively. Images of the entire cell depth were acquired using a 1.4 μm z-slice every 400 nm as z-stacks, deconvolved using Huygens (SVI) and rendered as surface projections using the same parameters for object size cut-off and intensity between different treatments. To obtain quantitative estimates of SAHF formation, the mean gradient amplitude was calculated from DAPI-stained images in the masked region of interest and used as a measure of granularity using imageJ plugin http://bigwww.epfl.ch/thevenaz/differentials/ ( Unser, 1999 ). Mean gradient amplitude was divided by mean DAPI intensity. For live cell timelapse microscopy, cells were plated in Iwaki glass bottomed dishes (Iwaki) and imaged on an inverted Zeiss LSM510 equipped with a Solent incubator (Solent Scientific) at 37°C with humidified 5% CO 2 , using a 40 × 1.3 NA oil objective, as described ( Nelson et al, 2002 ). Autofocus was performed at each timepoint before capturing a z-stack to ensure the entire cell was captured (1.65 μm pinhole every 1.5 μm over 4.5 μm total z range). Cells and AcGFP–53BP1c foci were tracked manually using ImageJ ( http://rsb.info.nih.gov/ij/ ).
Bioinformatics and quantitative stochastic modelling
A probabilistic functional integrated network of interactions was constructed using gene and protein interaction data from the BioGrid database ( Stark et al, 2006 ), plus protein phosphorylation data from Phospho.ELM ( Diella et al, 2008 ). To assess interaction likelihoods, an LLS was calculated for each dataset as described ( Lee et al, 2004 ). Datasets larger than 100 interactions were analysed individually, whereas those with fewer than 100 interactions were grouped by evidence category. Pathway data, from the Kyoto Encyclopedia of Genes and Genomes (KEGG) ( Kanehisa and Goto, 2000 ) Release 46.0, 1 April 2008, was used as the gold standard. The final LLS for an interaction between a pair of genes was calculated as the sum over the LLS of all the datasets containing that interaction. Network analysis was performed using the Cytoscape platform ( Shannon et al, 2003 ). An in-house Python script was used to detect all paths between CDKN1A and either MAPK14 or TGFβ1/2 having no more than four intermediary nodes. For cluster analysis of candidate pathway genes, raw MRC5 microarray data ( Passos et al, 2007a ) (four young confluent and five senescent cultures) were loaded into Bioconductor ( http://www.bioconductor.org ) and normalized using GCRMA method. Hierarchical cluster analysis was applied to the expression values relative to the mean of all arrays. The Pearson correlation was used as similarity measure and average linkage as cluster method. To test whether the feedback loop between DDR and ROS production was necessary to explain the experimental data, we developed a stochastic mechanistic model of the DDR extending our previously published model of the TP53/Mdm2 circuit ( Proctor and Gray, 2008 ) by the steps outlined in Figure 5A . Model variables, reactions, kinetic laws and parameter values are given in Supplementary Tables S2 and S3 . The model is encoded in the Systems Biology Markup Language ( Hucka et al, 2003 ). Simulations are run in the Biology of Ageing e-Science Integration and Simulation (BASIS) system ( http://www.basis.ncl.ac.uk ; Kirkwood et al, 2003 ; Gillespie et al, 2006 ) using stochastic simulation based on the exact Gillespie algorithm ( Gillespie, 1977 ). The model is available in the public space of the BASIS database (urn:basis.ncl:basis:6178) and is also obtainable from Biomodels (MODEL 5989624192), http://www.ebi.ac.uk/biomodels/ ( Le Novere et al, 2006 ). Further experimental procedures Flow cytometric and confocal imaging techniques to measure mitochondrial superoxide, cell peroxides, mitochondrial mass, cytoplasmic calcium, γH2A.X. immunofluorescence, telomere immunoFISH, RT–PCR and sen-β-Gal staining were described ( Passos et al, 2007a ). All flow cytometry was performed on at least 30 000 cells per measurement. Anti-p21 mouse monoclonal IgG (U2OS, Calbiochem Inc.), anti-p16 rabbit polyclonal IgG (C20, Santa Cruz Biotechnology Inc.), anti-p38 MAPK rabbit polyclonal (Cell signalling) were used for immunofluorescence, and anti-γ-H2A.X rabbit monoclonal (Cell Signalling) and mouse monoclonal 8-oxodG (Japan Institute, with mouse-on-mouse kit) were used for immunohistochemistry with vectastain ABC kit (PK-6101, Vector). Cellular oxygen uptake was determined using high-resolution respirometry (Oxygraph-2K; Oroboros Instruments, Insbruck, Austria). The measurements were taken at 37°C. After the recording of the rate of steady-state basal oxygen uptake, the following chemicals were sequentially added: oligomycin (1 μg/ml), carbonyl cyanide p-(trifluoromethoxy) phenylhydrazone (FCCP, 3–4.5 μM, depending on cell state), rotenone (0.5 μM) and antimycin A (2.5 μM). Antimycin-resistant oxygen uptake was registered as non-mitochondrial oxygen uptake and subtracted from the raw data to calculate the mitochondrial oxygen uptake.
Statistics
Group means were compared by Mann–Whitney rank sum test, if data were not normally distributed. Multiple comparisons were performed by ANOVA followed by Tukey's test for comparison of individual subgroups. γH2A.X-telomere co-localization was tested by pixelwise Pearson correlation analysis as described ( Passos et al, 2007a ).
Further experimental procedures Flow cytometric and confocal imaging techniques to measure mitochondrial superoxide, cell peroxides, mitochondrial mass, cytoplasmic calcium, γH2A.X. immunofluorescence, telomere immunoFISH, RT–PCR and sen-β-Gal staining were described ( Passos et al, 2007a ). All flow cytometry was performed on at least 30 000 cells per measurement. Anti-p21 mouse monoclonal IgG (U2OS, Calbiochem Inc.), anti-p16 rabbit polyclonal IgG (C20, Santa Cruz Biotechnology Inc.), anti-p38 MAPK rabbit polyclonal (Cell signalling) were used for immunofluorescence, and anti-γ-H2A.X rabbit monoclonal (Cell Signalling) and mouse monoclonal 8-oxodG (Japan Institute, with mouse-on-mouse kit) were used for immunohistochemistry with vectastain ABC kit (PK-6101, Vector). Cellular oxygen uptake was determined using high-resolution respirometry (Oxygraph-2K; Oroboros Instruments, Insbruck, Austria). The measurements were taken at 37°C. After the recording of the rate of steady-state basal oxygen uptake, the following chemicals were sequentially added: oligomycin (1 μg/ml), carbonyl cyanide p-(trifluoromethoxy) phenylhydrazone (FCCP, 3–4.5 μM, depending on cell state), rotenone (0.5 μM) and antimycin A (2.5 μM). Antimycin-resistant oxygen uptake was registered as non-mitochondrial oxygen uptake and subtracted from the raw data to calculate the mitochondrial oxygen uptake.
Supplementary Material Supplementary Movie SM1 Supplementary Information Supplementary Figures S1–19, Supplementary Tables S1–3
📊 Figures
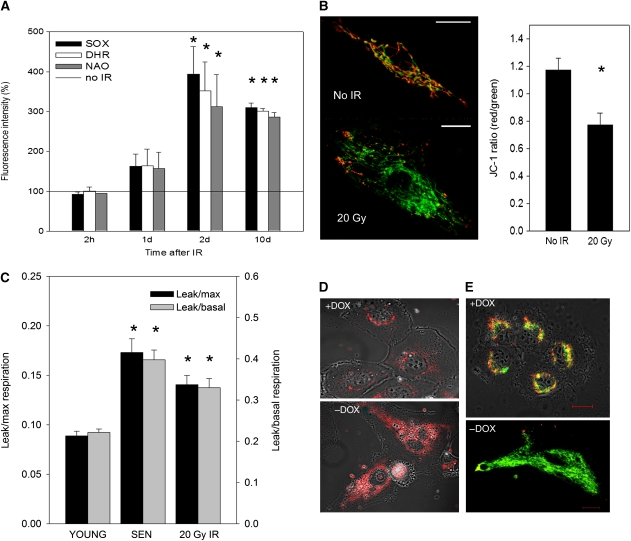
Figure 1
Mitochondrial dysfunction and ROS production are consequences of senescence. ( A ) MitoSOX, DHR and NAO fluorescence in irradiated MRC5 human fibroblasts at the indicated times after irradiation as me...
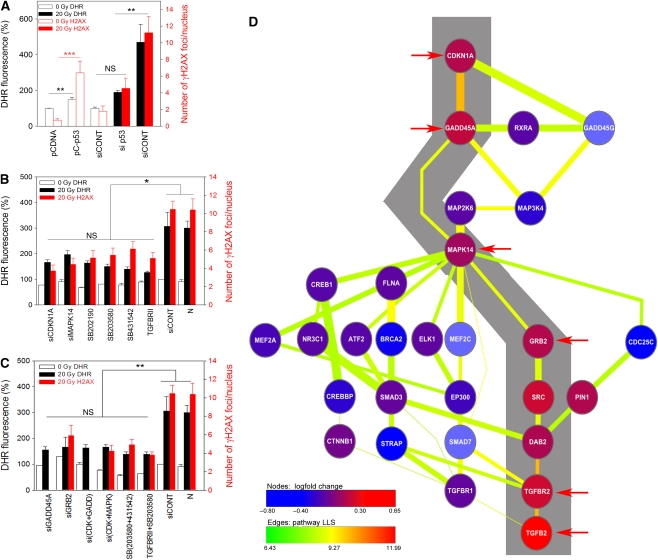
Figure 2
Feedback signalling through TP53-CDKN1A-GADD45A-MAPK14-GRB2-TGFBRII-TGFu03b2 induces ROS production and maintains DDR. ( A u2013 C ) MRC5 cells were transfected with wtTP53 (pC-p53), empty vector (pCD...
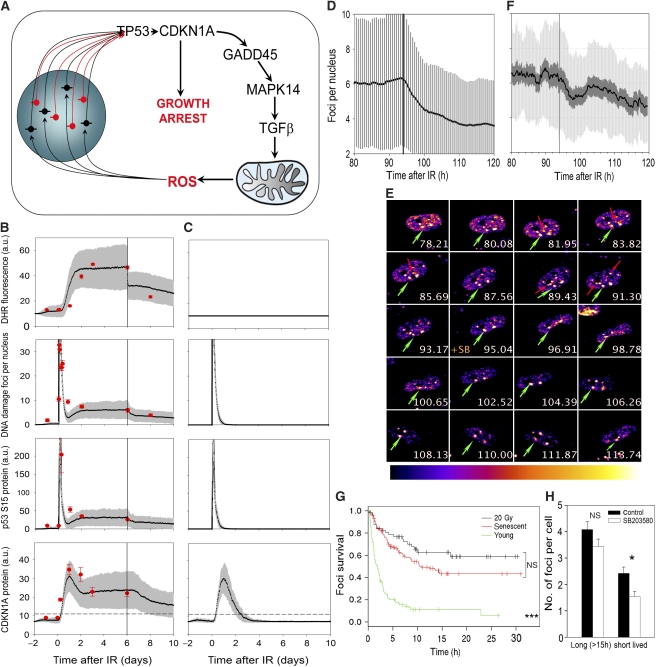
Figure 3
A stochastic feedback loop model predicts the kinetics of DDR and growth arrest at the single cell level. ( A ) Feedback loop model. Uncapped telomeres (red) or unrepaired double strand breaks (black)...
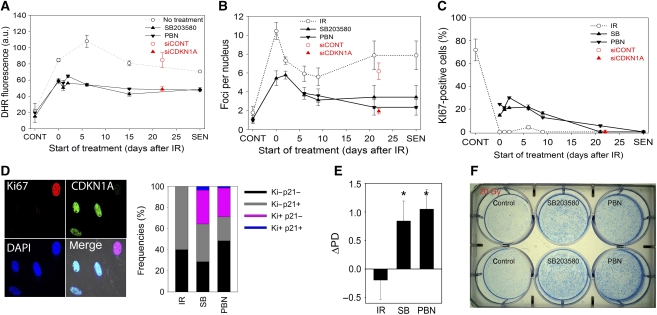
Figure 4
Feedback loop signalling is necessary and sufficient to maintain proliferation arrest during establishment of irreversible cell senescence. ( A ) ROS levels (DHR fluorescence intensity) in cells at th...
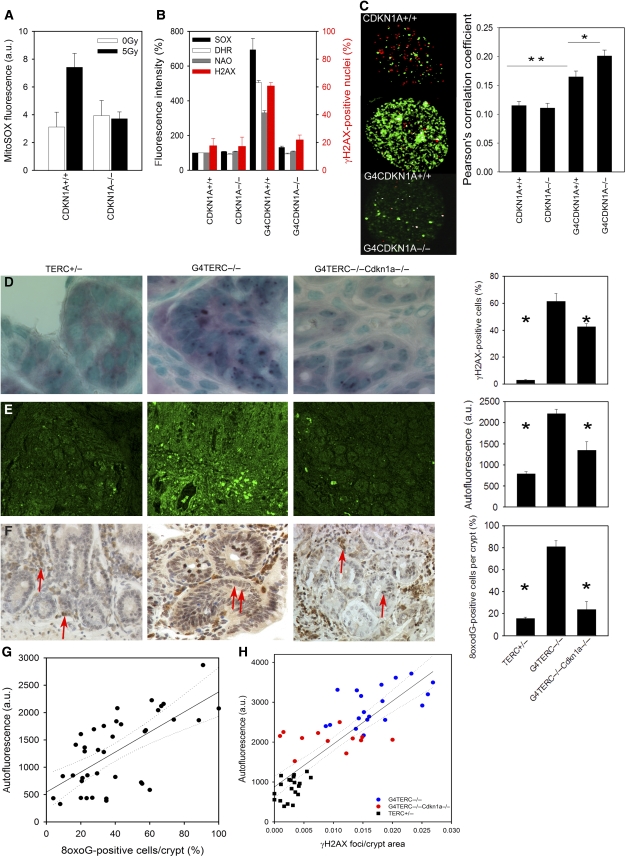
Figure 5
CDKN1A knockout rescues oxidative damage in late generation TERCu2212/u2212 mice. ( A ) MitoSOX fluorescence at 48 h after IR in MEFs. M u00b1s.e.m., n =3, P =0.029 (Student's t -test) for IR CDKN1A+/...
Figure images are served from the NIH/NLM PubMed Central Open Access Subset or Europe PMC; copyright remains with the publishers and authors.
💬 Discussion
0 commentsNo comments yet. Be the first to start a discussion!
Leave a Comment