Abstract
AbstractThe recent identification of three broadly neutralizing antibodies (bnAbs) against gp120–gp41 interface epitopes has expanded the targetable surface on the HIV-1 envelope glycoprotein (Env) trimer. By using biochemical, biophysical and computational methods, we map the previously unknown trimer epitopes of two related antibodies, 3BC315 and 3BC176. A cryo-EM reconstruction of a soluble Env trimer bound to 3BC315 Fab at 9.3 Å resolution reveals that the antibody binds between two gp41 protomers, and neutralizes the virus by accelerating trimer decay. In contrast, bnAb 35O22 binding to a partially overlapping quaternary epitope at the gp120–gp41 interface does not induce decay. A conserved gp41-proximal glycan at N88 was also shown to play a role in the binding kinetics of 3BC176 and 3BC315. Finally, our data suggest that the dynamic structure of the Env trimer influences exposure of bnAb epitopes.
🔬 Techniques
🔭 Microscopes
💻 Software
🧪 Sample Preparation
🔬 Cell Lines
🏭 Microscope Brands
🧪 Reagent Suppliers
📷 Detectors
💻 Software Details
💾 Data Repositories
🏛️ Research Organizations (ROR)
Affiliated research institutions:
📋 Methods
Protein expression and purification BG505 SOSIP.664 trimers were recombinantly expressed in HEK293T, 293F or 293S (GnTI −/− ) cells, and 2G12-affinity purified 13 21 27 48 . The JR-FL SOSIP.664 trimers were produced in 293T cells and PGT145-affinity purified 49 . The supernatant was flown over Sepharose resin cross-linked to 2G12 or PGT145 IgG, then washed with 20 mM Tris (pH 8), 500 mM NaCl and eluted with 3 M MgCl 2 . The eluted trimers were dialyzed into 20 mM Tris (pH 8), 500 mM NaCl. BG505 SOSIP.664 trimers were further purified through a HiLoad 16/600 Superdex 200 SEC column (GE Healthcare) for structural and biophysical studies. 3BC315 and 3BC176 were expressed in HEK293F cells as Fabs or IgGs, where the HC and LC genes were co-transfected at a ratio of 2:1. The IgGs were purified in a single step, through a 5-ml protein A column (GE Healthcare). Fabs were purified in three steps. First, the collected media was loaded onto a 5-ml Lambda Select column (GE Healthcare), followed by cation exchange chromatography using a Mono S column (GE Healthcare). Fractions corresponding to the proper HC–LC dimer paring were then SEC-purified through a Superdex 200 column (GE Healthcare). Deglycosylation of BG505 SOSIP trimers BG505 SOSIP.664 trimers expressed in 293S cells were deglycosylated using EndoH, by incubating with 0.3 units of EndoH (New England Biolabs) per μg of purified trimer, for 3 h at room temperature (RT) in 0.1 mM sodium acetate (pH 6) 48 . The deglycosylated trimer was further purified over Superose 6 (GE Healthcare), and checked for reduction in trimer mass by BN-PAGE 4–16% bis-Tris gels run using the manufacturer's protocol (Novex). Crystallization and X-ray structure determination 3BC176 and 3BC315 Fabs SEC-purified in 50 mM Tris (pH 7.4), 150 mM NaCl and concentrated to ∼8 mg ml −1 were screened for crystallization conditions using the CrystalMation robot (Rigaku) at the Joint Center for Structural Genomics ( www.jcsg.org ). Initial hits were optimized, and diffraction quality crystals were obtained in the following conditions: 3BC176: 6 mg ml −1 protein, 0.1 M sodium citrate (pH 5.6), 20% 2-propanol and 20% PEG4000; 3BC315: 8.5 mg ml −1 protein, 0.1 M N -cyclohexyl-3-aminopropanesulfonic acid (CAPS) (pH 10.3), 0.25 M NaCl and 20% PEG8000. Glycerol, 25% was used as a cryo-protectant for 3BC315 Fab. Data sets for 3BC176 and 3BC315 were collected at liquid nitrogen temperatures at APS 23ID-D (wavelength: 1.033 Å) and APS 4.2.2 (wavelength: 1.000 Å) beamlines, respectively. Data processing was performed using HKL2000 (ref. 50 ). Both Fab structures were solved by molecular replacement 51 using Fab coordinates of PDB ID: 4DJV for 3BC315 and the Fab coordinates of the 3BC315 structure for 3BC176, then refined using PHENIX 51 and COOT 52 . Ramachandran statistics for the 3BC315 structure: Ramachandran favored/Ramachandran allowed: 97.5%/2.5%. Ramachandran statistics for the 3BC176 structure: Ramachandran favored/Ramachandran allowed: 96.7%/3.03%. Other statistics are reported in Table 1 . Pseudovirus production and neutralization assays The Env complementation vector pSVIIIex-E7pA − YU2 was kindly provided by J. Sodroski (Harvard) and the envelope genes JR-FL, JR2 and BG505 were cloned using the KpnI and XhoI restriction sites 53 . Envelope gene mutations were performed using a QuikChange site-directed mutagenesis kit (Agilent) according to the manufacturer's protocol and verified through Sanger sequencing. HIV-1 pseudotyped viruses were produced in HEK293T cells by a polyethylenimine (PEI) co-transfection of the Env plasmid (PEI 25 K, Sigma-Aldrich) and backbone plasmid pSG3ΔEnv at a mass ratio of 1:3.5. Virus containing supernatant was collected 48 h post transfection, 0.2 μm filtered to remove cell debris and stored at −80 °C until use. Single round neutralization assays were performed using TZM-bl cells (CD4 + CXCR4 + CCR5 + ), which were seeded at 10,000 cells per well 24 h before assay. The virus and antibody mixture were incubated for an hour at 37 °C before being added to cells. Luciferase activity was determined 48 h post infection and data were analysed using Prism 5.0 software (GraphPad). Extended incubation neutralization assays were performed as described above but with extended incubation times for the virus and antibody mixture at 37 °C (ref. 42 ). Some mutations were tested in a JR2 background instead of JR-FL. JR2 is identical to JR-FL except for the substitutions S668N, T676S and K677N 53 , and the neutralization potency of 3BC176 and 3BC315 was very similar against both JR-FL and JR2. gp120 shedding assay Virus samples were incubated alone or with 20 μg ml −1 sCD4 or Fabs for various time points at 37 °C. Subsequently, virus was pelleted by centrifugation at 22,000 g for 45 min. gp120 content in both the cell culture supernatant and associated with the virus pellet was analysed using a gp120 capture ELISA. Briefly, samples were solubilized using 1% Empigen, gp120 was captured on anti-gp120 antibody D7324 (Aalto), and was then detected using purified IgG from pooled HIV-1 seropositive donors (HIVIG). The relative amount of gp120 in both the supernatant and associated with virus was normalized to virus samples incubated at 37 °C for the same time points without ligand.
Show full methods section
Protein expression and purification BG505 SOSIP.664 trimers were recombinantly expressed in HEK293T, 293F or 293S (GnTI −/− ) cells, and 2G12-affinity purified 13 21 27 48 . The JR-FL SOSIP.664 trimers were produced in 293T cells and PGT145-affinity purified 49 . The supernatant was flown over Sepharose resin cross-linked to 2G12 or PGT145 IgG, then washed with 20 mM Tris (pH 8), 500 mM NaCl and eluted with 3 M MgCl 2 . The eluted trimers were dialyzed into 20 mM Tris (pH 8), 500 mM NaCl. BG505 SOSIP.664 trimers were further purified through a HiLoad 16/600 Superdex 200 SEC column (GE Healthcare) for structural and biophysical studies. 3BC315 and 3BC176 were expressed in HEK293F cells as Fabs or IgGs, where the HC and LC genes were co-transfected at a ratio of 2:1. The IgGs were purified in a single step, through a 5-ml protein A column (GE Healthcare). Fabs were purified in three steps. First, the collected media was loaded onto a 5-ml Lambda Select column (GE Healthcare), followed by cation exchange chromatography using a Mono S column (GE Healthcare). Fractions corresponding to the proper HC–LC dimer paring were then SEC-purified through a Superdex 200 column (GE Healthcare). Deglycosylation of BG505 SOSIP trimers BG505 SOSIP.664 trimers expressed in 293S cells were deglycosylated using EndoH, by incubating with 0.3 units of EndoH (New England Biolabs) per μg of purified trimer, for 3 h at room temperature (RT) in 0.1 mM sodium acetate (pH 6) 48 . The deglycosylated trimer was further purified over Superose 6 (GE Healthcare), and checked for reduction in trimer mass by BN-PAGE 4–16% bis-Tris gels run using the manufacturer's protocol (Novex). Crystallization and X-ray structure determination 3BC176 and 3BC315 Fabs SEC-purified in 50 mM Tris (pH 7.4), 150 mM NaCl and concentrated to ∼8 mg ml −1 were screened for crystallization conditions using the CrystalMation robot (Rigaku) at the Joint Center for Structural Genomics ( www.jcsg.org ). Initial hits were optimized, and diffraction quality crystals were obtained in the following conditions: 3BC176: 6 mg ml −1 protein, 0.1 M sodium citrate (pH 5.6), 20% 2-propanol and 20% PEG4000; 3BC315: 8.5 mg ml −1 protein, 0.1 M N -cyclohexyl-3-aminopropanesulfonic acid (CAPS) (pH 10.3), 0.25 M NaCl and 20% PEG8000. Glycerol, 25% was used as a cryo-protectant for 3BC315 Fab. Data sets for 3BC176 and 3BC315 were collected at liquid nitrogen temperatures at APS 23ID-D (wavelength: 1.033 Å) and APS 4.2.2 (wavelength: 1.000 Å) beamlines, respectively. Data processing was performed using HKL2000 (ref. 50 ). Both Fab structures were solved by molecular replacement 51 using Fab coordinates of PDB ID: 4DJV for 3BC315 and the Fab coordinates of the 3BC315 structure for 3BC176, then refined using PHENIX 51 and COOT 52 . Ramachandran statistics for the 3BC315 structure: Ramachandran favored/Ramachandran allowed: 97.5%/2.5%. Ramachandran statistics for the 3BC176 structure: Ramachandran favored/Ramachandran allowed: 96.7%/3.03%. Other statistics are reported in Table 1 . Pseudovirus production and neutralization assays The Env complementation vector pSVIIIex-E7pA − YU2 was kindly provided by J. Sodroski (Harvard) and the envelope genes JR-FL, JR2 and BG505 were cloned using the KpnI and XhoI restriction sites 53 . Envelope gene mutations were performed using a QuikChange site-directed mutagenesis kit (Agilent) according to the manufacturer's protocol and verified through Sanger sequencing. HIV-1 pseudotyped viruses were produced in HEK293T cells by a polyethylenimine (PEI) co-transfection of the Env plasmid (PEI 25 K, Sigma-Aldrich) and backbone plasmid pSG3ΔEnv at a mass ratio of 1:3.5. Virus containing supernatant was collected 48 h post transfection, 0.2 μm filtered to remove cell debris and stored at −80 °C until use. Single round neutralization assays were performed using TZM-bl cells (CD4 + CXCR4 + CCR5 + ), which were seeded at 10,000 cells per well 24 h before assay. The virus and antibody mixture were incubated for an hour at 37 °C before being added to cells. Luciferase activity was determined 48 h post infection and data were analysed using Prism 5.0 software (GraphPad). Extended incubation neutralization assays were performed as described above but with extended incubation times for the virus and antibody mixture at 37 °C (ref. 42 ). Some mutations were tested in a JR2 background instead of JR-FL. JR2 is identical to JR-FL except for the substitutions S668N, T676S and K677N 53 , and the neutralization potency of 3BC176 and 3BC315 was very similar against both JR-FL and JR2. gp120 shedding assay Virus samples were incubated alone or with 20 μg ml −1 sCD4 or Fabs for various time points at 37 °C. Subsequently, virus was pelleted by centrifugation at 22,000 g for 45 min. gp120 content in both the cell culture supernatant and associated with the virus pellet was analysed using a gp120 capture ELISA. Briefly, samples were solubilized using 1% Empigen, gp120 was captured on anti-gp120 antibody D7324 (Aalto), and was then detected using purified IgG from pooled HIV-1 seropositive donors (HIVIG). The relative amount of gp120 in both the supernatant and associated with virus was normalized to virus samples incubated at 37 °C for the same time points without ligand.
BN-PAGE binding and dissociation analysis
Virus samples were pre-incubated with Fab fragments of antibodies for the noted time periods before preparation for BN-PAGE. BN-PAGE analysis was performed using the NativePAGE bis-Tris gel system (Invitrogen), according to the manufacturer's instructions. Briefly, samples were solubilized with 1% DDM in the supplied sample buffer and run on a 3–12% gradient bis-Tris NativePAGE gel at 150 V at 4 °C for 3 h. Proteins in the gel were transferred to a PVDF membrane; membranes were blocked in 5% (w/v) non-fat dry milk dissolved in PBS, 0.05% Tween-20, and blotted overnight at 4 °C using a cocktail of antibodies to gp120 (2 μg ml −1 each of b12, 2G12 and 447-52D) and to gp41 (1 μg ml −1 each of 2F5, 4E10 and Z13e1) combined. Membranes were washed, probed for 30 min at RT with an horseradish peroxidase (HRP)-conjugated goat anti-human Fc antibody (Jackson) and peroxidase activity was assayed using SuperSignal West Pico Chemiluminescence (Pierce). Ni-NTA ELISA Pure HEK293T cell supernatants containing BG505 SOSIP.664, or PGT145 affinity-purified BG505 SOSIP.664 and BG505 SOSIP.MPER (0.5 μg ml −1 ), all with a C-terminal 8 histidine-tag were immobilized on Ni-NTA HisSorb 96-well plates (Qiagen) (100 μl per well) for 2 h at RT. After three washing steps with Tris-buffered saline (TBS), antibodies were serially diluted in 2% skim milk and added for 2 h. Subsequently, HRP labelled goat anti-human Abs (Jackson ImmunoResearch) were added for 1 h in TBS, 2% skimmed milk, followed by five washes with TBS, 0.05% Tween-20. Colorimetric detection was performed using a solution containing 1% 3,3′,5,5′-tetramethylbenzidine (Sigma-Aldrich), 0.01% H 2 O 2 , 100 mM sodium acetate and 100 mM citric acid. ELISA curves were fitted using Prism 5.01 (GraphPad). D7324-tag ELISA for gp120 binding and alanine scanning Pure HEK293T supernatants containing D7324-tagged BG505 SOSIP.664 trimers and alanine scan mutants, or 2G12 affinity then SEC-purified BG505 SOSIP.664 trimers (0.5 μg ml −1 ) were coated on D7324-coated half-well ELISA plates (Greiner; 50 μl per well) for 2 h at RT. Subsequent ELISA assay steps were performed as described above for the Ni-NTA ELISA. In some cases, sCD4 (10 μg ml −1 ) was added during the incubation with a test antibody. Electron microscopy The 3BC176, 3BC315 Fab or PGV04 Fab: SOSIP.664 293F complexes were generated by adding sixfold molar excess of the Fab to the trimer at RT for various time points. For negative-stain EM, the sample was diluted to ∼0.01 mg ml −1 immediately before applying to glow-discharged carbon coated 400-mesh Cu grids; 3 μl of the sample was applied for ∼2 s, followed by blotting and staining with 3 μl of 2% (w/v) uranyl formate for 30 s. Complexes were imaged on an FEI Tecnai T12 electron microscope operating at 120 kV at 52,000 × magnification, using a Tietz Temcam F-416 4 × 4 k camera, or on an FEI Talos electron microscope operating at 200 kV at × 73,000 magnification, using a 4 × 4 k Ceta camera. All data were collected via the Leginon interface 54 . Particle picking was carried out using Dogpicker 55 , and reference-free 2D class averages were generated using iterative multivariate statistical analysis/multireference alignments (MSA/MRA) 56 . For cryo-EM, 3BC315 Fab was added to BG505 SOSIP.664 293F in tenfold molar excess, and incubated at 4 °C for 30 min, then purified over a Superose 6 column (GE Healthcare) and concentrated to ∼1.5 mg ml −1 . DDM was added to the sample just before freezing such that the final DDM concentration in the solution was 0.018% (w/v). Grids were frozen manually at 4 °C, using 2/2 C-Flat holey grids. Data were collected using an FEI Tecnai F20 electron microscope operating at 200 kV, equipped with a Gatan K2 direct electron detector camera. The exposure images were collected in counting mode at × 29,000 magnification, at a pixel size of 1.21 Å at the specimen plane, receiving a total accumulated exposure dose of ∼27 e − /Å 2 . In the processed dataset, only frames 5–25 were aligned due to large alignment shifts in the first few frames. Particles were automatically selected, boxed out, and sorted by reference-free 2D class averaging as described above. CTF estimation was performed using CTFFind3 (ref. 57 ). The 2D-sorted particles were further sorted by two rounds of 3D classification using particles binned by 2, and using an unliganded trimer structure (EMD-5782) 26 low-pass filtered to 60 Å as an initial model in RELION 58 . Particles from the two convergent classes that looked like Fabs complexed to an Env trimer were used to generate a final unbinned reconstruction. The final refinement was performed without symmetry using the RELION auto-refine function, with internal CTF correction 58 59 . The resolution of the model generated from 20,252 particles at a box size of 224 × 224 pixels (1.21 Å per pixel) was determined to be 9.3 Å by a gold standard Fourier shell correlation curve using a correlation cutoff of 0.143, following the application of a soft edge mask 60 . A B-factor of −600 Å 2 was applied to obtain the final sharpened reconstruction. Structural analysis of cryo-EM reconstruction The Segment Map function in UCSF Chimera was used to segment the refined map into gp120, gp41 and Fabs as seen in Fig. 1c 61 . Three copies of the gp140 protomer (PDB ID: 4TVP) 28 and two copies of 3BC315 Fab were fit independently using the Fit function. Buried surface area for the epitopes of 3BC315 and 35O22 were calculated using the buriedArea function in Chimera, using the 4TVP trimer structure. 3BC315 Fab and the 4TVP trimer were docked into the BG505 SOSIP.664: 3BC315 Fab EM map to calculate the buried surface area. This resulted in solvent-excluded total buried surface areas of 986 and 657 Å 2 for 3BC315 and 35O22, respectively. Glycans were excluded from the analysis. Figures were generated using Chimera 61 and PyMOL 62 .
Model refinement in Rosetta and analysis
The coordinates of the gp140 and Fab components that were fit in Chimera were saved as a single PDB file relative to the EM density and further refined by RosettaRelax 30 . Fifty models were generated. Because all Rosetta energy scores were highly clustered, the model resulting in the lowest energy after subtracting out the EM density score was used for analysis. Potential contacts were determined by selecting all residues in the trimer within a 5 Å radius around the Fab CDR loops in PyMOL. Only the contact residues that were identified from both interacting protomers are listed. Isothermal titration calorimetry Samples were analysed on an Auto-iTC200 instrument (GE Healthcare). BG505 SOSIP.664 or SOSIP.650 trimers expressed in 293F or 293S cells were deposited in the cell at a concentration of 4.0–5.0 μM, and binding was titrated with the 3BC315 Fab in the syringe at ∼20 × the molar concentration of the trimer. Data analysis was carried out using the iTC200 software (GE Healthcare) using a single-site binding model. Surface plasmon resonance Antibody binding was analysed by SPR on a Biacore 3000 instrument at 25 °C. Trimers were immobilized by antibody, either via a D7324-epitope or a 8 histidine-tag 36 . The D7324 antibody (Aalto Bio Reagents) was amide-coupled to a CM5 sensor chip to 9,000 resonance units (RU). After deactivation, D7324-tagged HEK293T expressed BG505 SOSIP.664 trimer, its SOSIP- and SEKS-modified variants, or gp120 gp41 ECTO protomer was captured to R L values of 500 RU; gp120 monomer was similarly captured to give R L values of 425RU, that is, 15% lower to achieve equal molar amounts. In all experiments, HBS-EP (10 mM HEPES (pH 7.4), 150 mM NaCl, 3 mM EDTA and 0.002% P20 surfactant) was used as running buffer (GE Healthcare). The flow rate for analyte injections was set to the maximum, 50 μl min −1 , to minimize mass-transport limitation. Association was monitored for 5 min and dissociation for 10 min. After each cycle, the capture-antibody surface was regenerated by an injection of 10 mM glycine (pH 2) for 120 s at a flow rate of 30 μl min −1 . In all these comparisons of different forms of D7324-tagged BG505 Env, 3BC315 was injected at 500 nM. The signal from a control channel, with capture antibody but no Env, was subtracted. For kinetic and competition analyses the more stable anti-His-capture was used. Anti-histidine antibody (GE Healthcare) was amide-coupled to the CM5 dextran surface to 15,000 RU. His-tagged BG505 SOSIP.664 293T/F/S Env was captured to R L values of 500 RU in each cycle. 3BC315 (IgG or Fab) was injected at concentrations titrated down in twofold steps from 1 μM until no significant binding occurred. EndoH–deglycosylated 293S trimer was immobilized to a level proportionate to its lower mass (320 kDa), consistent with its mass reported previously 48 . The signals from both 0-analyte and control-channel injections were subtracted. In the kinetic experiments, IgG binding was fitted with a bivalent and Fab binding with a Langmuir model in BIAevaluation (GE Healthcare). For the sequential binding analyses, association and dissociation phases were monitored for 200 s each. 3BC315 and 35O22 were injected at 1,000 and 500 nM, respectively, either sequentially (at times 0 and 200 s in a cycle) or alone. Different concentrations were used so as to give similar self-inhibition, which resulted in residual 20–25% relative binding.
Supplementary Material Supplementary Information Supplementary Figures 1-7, Supplementary Tables 1-3 and Supplementary References
📊 Figures
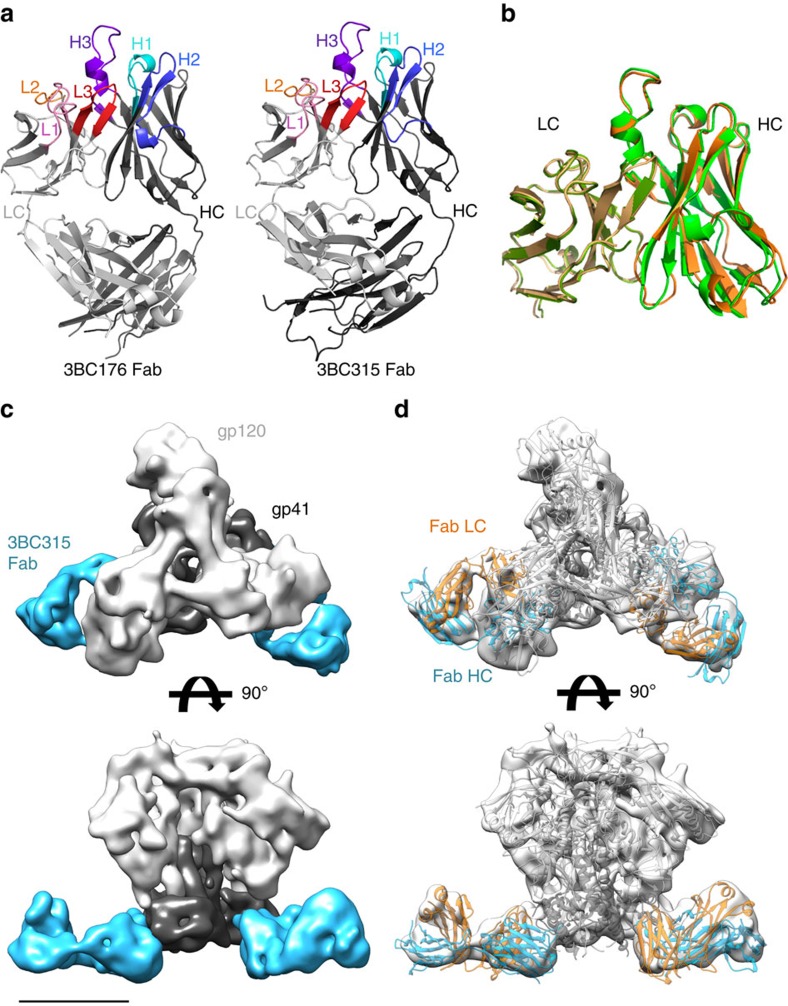
Figure 1
Structural analysis of 3BC176/3BC315 paratopes, and their epitopes on the BG505 SOSIP.664 293F trimer.
( a ) X-ray structures of 3BC176 and 3BC315 are shown in cartoon rendering. The Fab heavy chain (HC) and light chain (LC) are shown in dark and light grey, respectively. The CDR loops are coloured and...
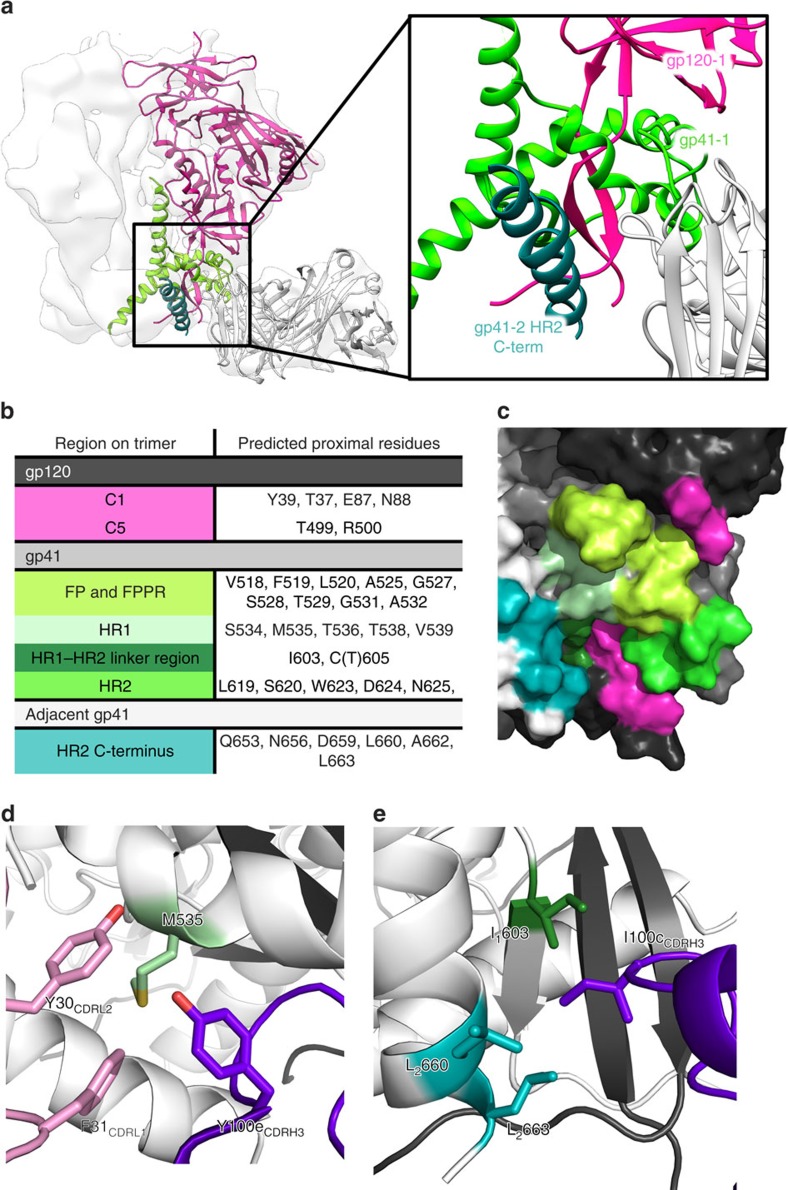
Figure 2
Identification of the 3BC315 epitope by cryo-EM.
( a ) On the basis of the docking of crystal structures into the EM reconstruction (white surface), 3BC315 Fab (white cartoon) interacts with gp41 (gp41-1, light green) and gp120 (gp120, pink) within ...
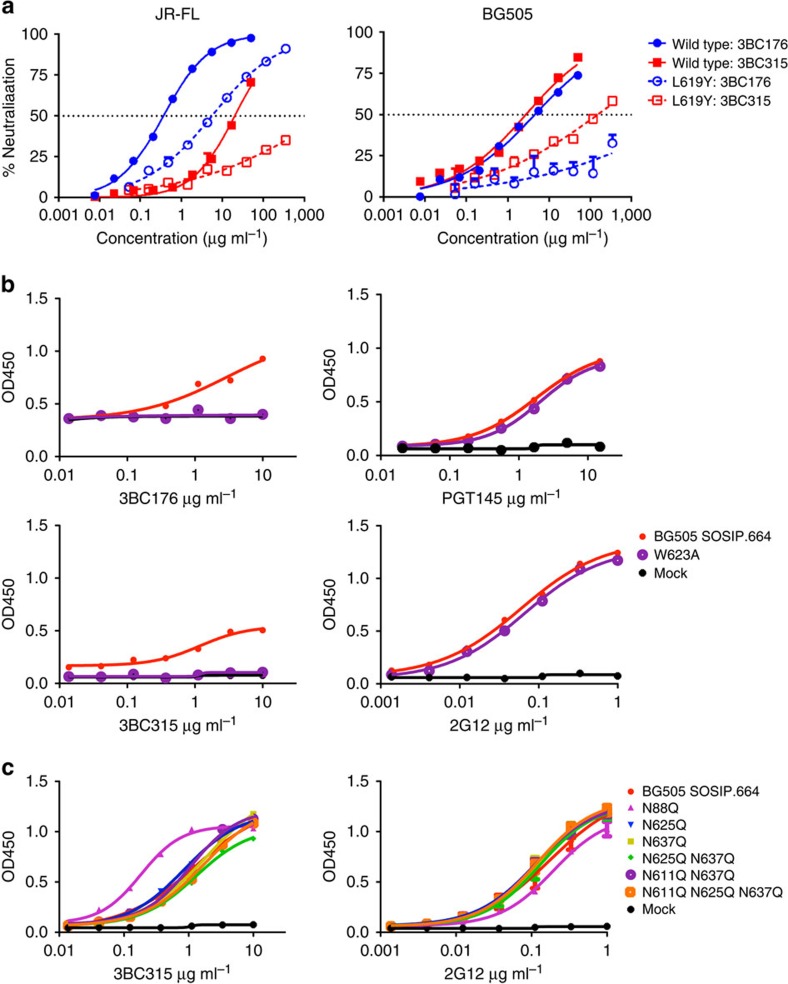
Figure 3
The 3BC315 epitope involves gp41 HR2 residues at positions 619 and 623, and is partially shielded by a gp120 glycan.
( a ) Neutralization of wild type and L619Y mutant JR-FL (left) and BG505 (right) pseudoviruses by 3BC176 and 3BC315 IgG, measured in a TZM-bl neutralization assay. Error bars shown indicate s.d. ( b ...
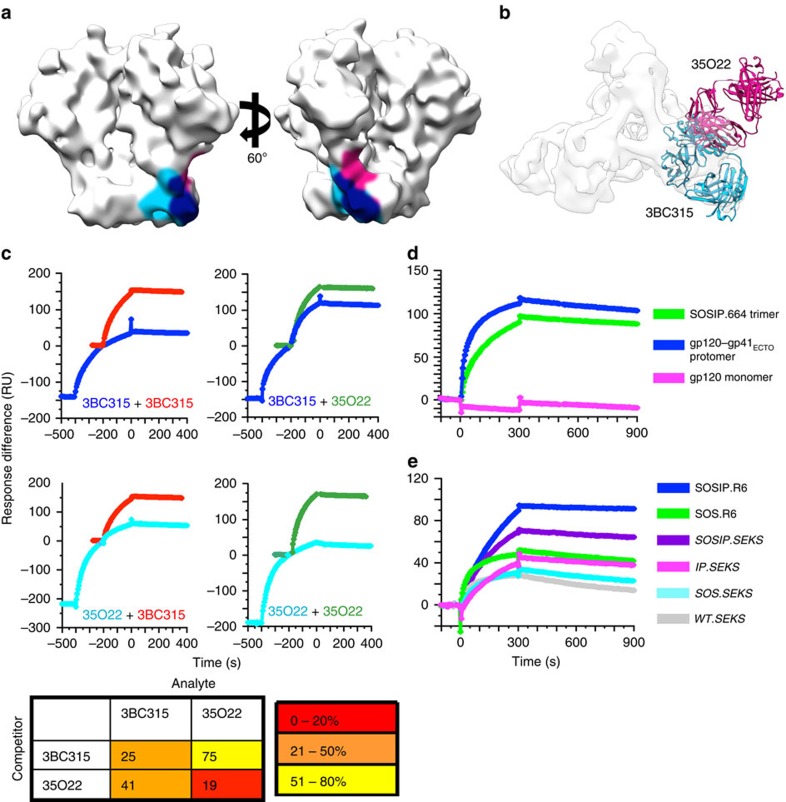
Figure 4
3BC315 binding to BG505 Env analysed by SPR.
( a ) The epitopes of 35O22 and 3BC315 are shaded on the surface of an unliganded SOSIP.664 cryo-EM structure (EMDB ID: 5782). The epitopes of 3BC315 (light blue) and 35O22 (pink) extensively overlap ...
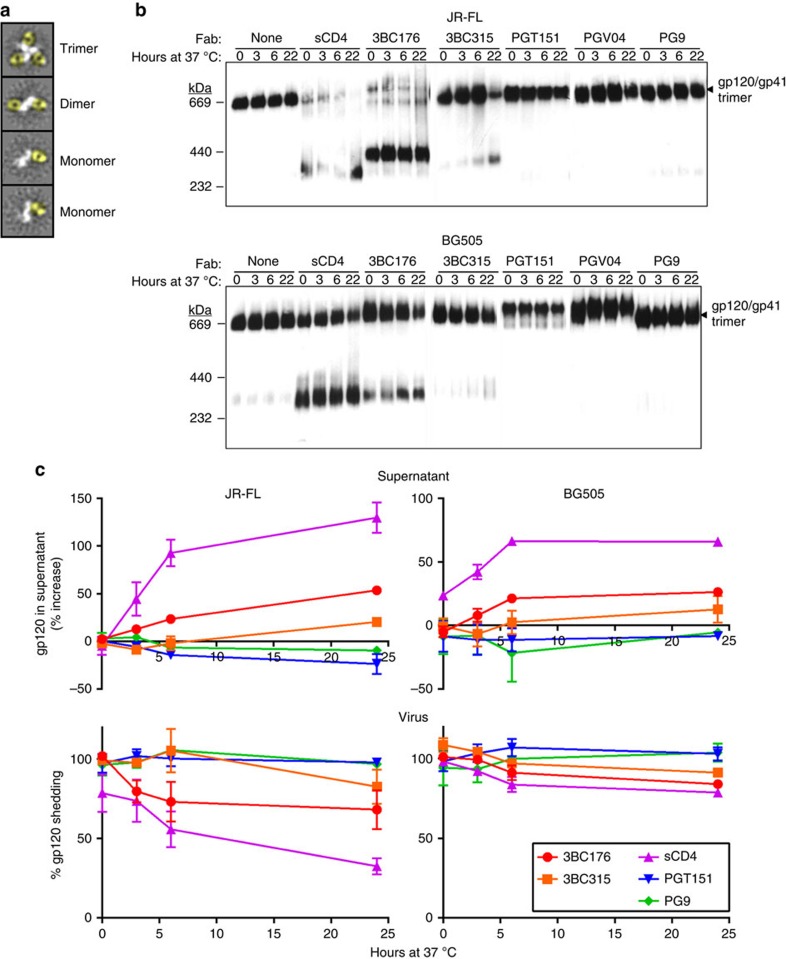
Figure 5
3BC176 and 3BC315 accelerate viral spike decay.
( a ) Representative 2D class averages seen for dissociated dimers and monomers. Compared with the trimeric Env portion of the protein complex in the top-most class average shown, the dimers and monom...
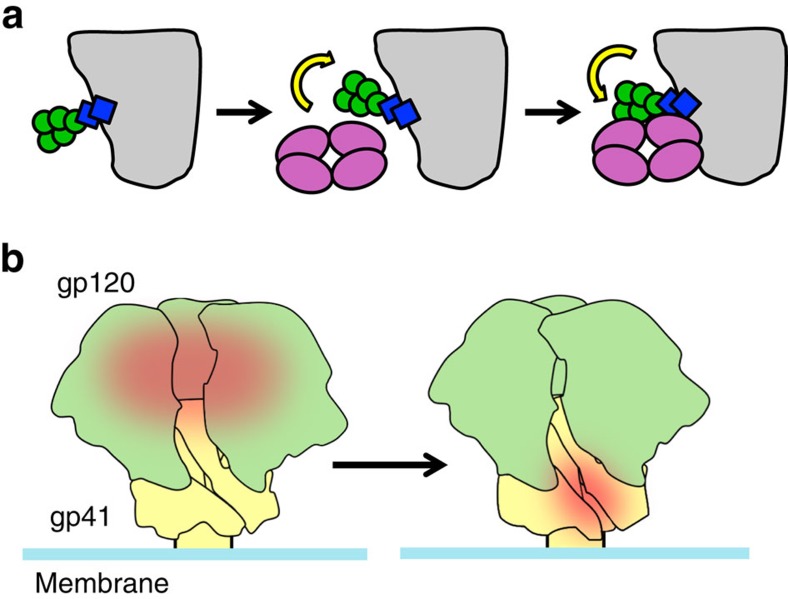
Figure 6
An overview of how 3BC315 interacts with the Env trimer.
( a ) The glycans near the 3BC315 epitope (e.g. N88) in the unliganded trimer reconfigure, enabling the antibody to bind to its epitope (left, centre). An increased on-rate is observed when these glyc...
Figure images are served from the NIH/NLM PubMed Central Open Access Subset or Europe PMC; copyright remains with the publishers and authors.
💬 Discussion
0 commentsNo comments yet. Be the first to start a discussion!
Leave a Comment