Abstract
Aptamers able to bind efficiently cell-surface receptors differentially expressed in tumor and in healthy cells are emerging as powerful tools to perform targeted anticancer therapy. Here, we present a novel oligonucleotide chimera, composed by an RNA aptamer and a DNA decoy. Our assembly is able to (i) target tumor cells via an antitransferrin receptor RNA aptamer and (ii) perform selective codelivery of a chemotherapeutic drug (Doxorubicin) and of an inhibitor of a cell-survival factor, the nuclear factor κB decoy oligonucleotide. Both payloads are released under conditions found in endolysosomal compartments (low pH and reductive environment). Targeting and cytotoxicity of the oligonucleotidic chimera were assessed by confocal microscopy, cell viability, and Western blot analysis. These data indicated that the nuclear factor κB decoy does inhibit nuclear factor κB activity and ultimately leads to an increased therapeutic efficacy of Doxorubicin selectively in tumor cells.
🔬 Techniques
🔭 Microscopes
✨ Fluorophores
🧪 Sample Preparation
🔬 Cell Lines
🏭 Microscope Brands
🧪 Reagent Suppliers
🔎 Objectives
💻 Software Details
🏛️ Research Organizations (ROR)
Affiliated research institutions:
📋 Methods
Materials. All chemicals were purchased from Sigma Aldrich (St Louis, MO) unless otherwise specified, and were used as received. ODN synthesis and purification were performed according to a reported protocol. 47 High-performance liquid chromatography (HPLC) analyses, absorption, and fluorescence measurements were performed accorded to reported protocols. 13 ODN sequences. All phosphoramidite monomers were purchased from Glen Research (Sterling, VA). The sequence of the anti-TfR RNA aptamer (c2.min) with a short DNA tail (CGA) 7 at the 3′end was the following (tail sequence is in italic): 5′-GGGGGAUCAAUCCAAGGGACCCGGAAACGCUCCCUUACACCCC CGACGACGACGACGACGACGA -3′ The sequence of the scrambled aptamer (c36) with a short DNA tail (CGA) 7 at the 3′end was the following (extended sequence of aptamer is in italic): 5′GGCGUAGUGAUUAUGAAUCGUGUGCUAAUACACGCC CGACGACGACGACGACGACGA -3′ All pyrimidines of the RNA aptamer motif were substituted by 2′-fluoro-pyrimidines. All synthesized ODNs contained a 5′amino group attached by a C-6 alkyl chain. The antitail sequence was the following: 5′-TCGTCGTCGTCGTCGTCGTCG-3' The sequence of the phosphorothioate NF- κ B decoy was the following (consensus sequence are in italic): 5′-CCT GGAAAGTCCC GAAA GGGACTTTCC AGG-3′ The sequence of scrambled phosphorothioate NF- κ B decoy was the following (complementary sequences are in italic) 5′- GCCGTACCTGACTTAGCC GAAA GGCTAAGTCAGGTACGGC -3′ All synthesized phosphorothioate ODNs contained a 3′amino group attached by a C-6 alkyl chain. Cell culture. Human pancreatic carcinoma cells (MIA PaCA-2), human cervical cancer cells (HeLa), and mouse embryonic fibroblast cells (NIH-3T3) were purchased from the American Type Culture Collection (ATCC, Manassas, VA). All cell lines were grown using a previously reported protocol. 13 Confocal imaging of cells. Cells were imaged using a Leica TCS SP5 SMD inverted confocal microscope (Leica Microsystems, Heidelberg, Germany) interfaced with a diode laser (Picoquant, Berlin, Germany) for excitation at 405 nm, with Ar lasers for excitation at 488 and 561 nm and with a HeNe laser for excitation at 633 nm. Glass bottom Petri dishes containing cells were mounted in a thermostated chamber at 37°C (Leica Microsystems) and viewed with a 63 × 1.2 NA water immersion objective or 40 × 1.5 NA oil immersion objective (Leica Microsystems). The pinhole aperture was set to 1.0 Airy. All data collected were analyzed by ImageJ software version 1.44o. Secondary structure and hybridization predictions. ODN secondary structure predictions were obtained using the Internet tool NUPACK nucleic acid package ( http://www.nupack.org/ ) with the default settings. Hybridization prediction between the tail sequence on the RNA aptamer structure and its short DNA complementary sequence (antitail) were obtained with NUPACK analysis algorithms software, representing each ODN as an RNA sequence. The NUPACK-generated secondary structures were used to obtain three-dimensional structures exploiting the utilities of the NUPACK software. ODN labeling. The amino residues at 5′-end of the extended RNA aptamer (c2.min + tail) and antitail were conjugated, to the ATTO 633 NHS fluorophore (ATTO-TEC GmbH, Siegen, Germany) and Alexa Fluor 488 NHS fluorophore (Invitrogen, Carlsbad, CA), respectively, by means of standard NHS coupling procedures between the primary amine of the ODNs and NHS-derivative of the fluorophores. The labeling reaction, purification, and quantification of the final product were performed according to a reported protocol. 13 ODN annealing protocol. To assemble the extended sequence of the RNA aptamer with its complementary DNA sequence, these two ODNs were mixed with equal molar concentration in a buffer solution, (PBS 1X containing 1 mM MgCl 2 ). The mixture was placed in a thermoblock and heated to 90°C for 1 minute to denature the nucleic acid structures. Then, the entire apparatus was placed on the workbench for 30 minutes and denatured oligo sample was slowly cooled to allow correct hybridization between the two complementary strands. The hybridized product was always freshly prepared before each evaluation. Dox intercalation in double helix region of the hybridized aptamer. A physical conjugate between hybridized aptamer carrier sample (c2C, c36C, c2C-d, and c2C-sd) and Dox was made by addition of 1 : 7.5 molar ratio of aptamer to Dox in binding buffer (PBS 1× containing 1 mmol/l MgCl 2 ). Dox fluorescence was measured (excitation: 480 nm, emission: 500–700 nm). Slits for both excitation and emission were set at 10 nm. The resulting complex (c2C–Dox, c36C–Dox, c2C-d–Dox, and c2C-sd–Dox) was freshly prepared before each experiment. Dox release from aptamer in serum-containing media. After physical conjugate preparation between c2C and Dox, the c2C–Dox complex was added to either 1% or 5% serum-containing medium and incubated at 37 °C for 0, 30, 60, 120 minutes, and 24 hours. Dox fluorescence was measured (excitation: 480 nm, emission: 540–700 nm. Slits for excitation and emission were set at 20 and 10 nm, respectively). The amount of Dox released was determined by comparison with that of a Dox sample incubated in the same conditions, assuming the fluorescence intensity of the starting complex and of free Dox sample as 0 and 100%, respectively. Assessment of cellular uptake by confocal microscopy. Internalization assay in MIA PaCa-2 cells was performed using a dual-labeled conjugate, in which the extended c2.min was labeled with ATTO 633 and the antitail was labeled with Alexa Fluor 488. MIA PaCa-2 cells were seeded 24 hours before the experiment in WillCo dishes to reach 80–90% confluence. Standard conditions for incubation consisted in 15-minute incubation at 37°C, 5% CO 2 in DMEM containing 1% bovine serum albumin (BSA), 0.2 mg/ml calf thymus DNA, and 0.2 µM of dual-labeled probe in a total volume of 500 µl. After incubation, cells were washed three times with PBS, fresh serum-containing medium was added and the sample was imaged by confocal microscopy. Cellular uptake of free Dox and c2C-Dox conjugate was assessed through confocal imaging evaluation both on MIA PaCa-2 cells and NIH-3T3 cells. In brief, the cells were seeded 24 hours before experiment in WillCo dishes to reach 80–90% confluence. Then, the cells were incubated with a 1% serum-containing medium with either free Dox or c2C-Dox (1.5 µmol/l Dox concentration) for 2 hours at 37 °C. After incubation, cells were washed three times with PBS, then fresh 1% serum-containing medium was added, and the sample was imaged by confocal microscopy either immediately ( i.e. , after 2 hours of incubation) or after additional 22 hours of incubation with drug-free culture medium ( i.e. , after 24 hours). Dox fluorescence in living cells was detected by confocal microscopy using 488 nm as excitation wavelength. All experiments were performed in triplicate. WST-8 cell viability assay. Cytotoxicity of free Dox and aptamer–Dox complexes was evaluated by using a tetrazolium salt, 2-(2-methoxy-4-nitrophenyl)-3-(4-nitrophenyl)-5-(2,4-disulfophenyl)-2 H tetrazolium, monosodium salt (WST-8) assay. MIA PaCA-2 cells, HeLa cells, and NIH-3T3 cells (1 × 10 4 cells per well) were seeded in 96-well plates. After culture for 24 hours, the cells were incubated with a 1% serum-containing medium with either free Dox or oligo-Dox conjugates for 2 hours. After 2 hours incubation, cells were washed twice with PBS and then fresh 1% serum-containing medium was added. After 24 hours from the treatment the medium was removed and cells were incubated with WST-8 reagent (10 µl) and 1% serum-containing medium (90 µl) for 3 hours. Dose–response curves for MIA PaCa-2, HeLa, and NIH 3T3 were obtained using increasing drug concentrations (1.5, 2.5, 3.5, 4.5, and 5.5 µmol/l as Dox concentration and 0.20, 0.33, 0.46, 0.6, 0.73 µmol/l as oligo concentration). The unconjugated aptamer cytotoxicity (c2C) was evaluated treating the cells with the higher aptamer concentration (0.73 µmol/l) employed in dose–response curve experiments. Absorbance (450 nm) was measured using a microplate reader (Infinite F50, Tecan, Männedorf, Switzerland). The percentage of cell viability was determined by comparing drug-treated cells with the untreated cells (100% viability). Data represent the average of three or more independent experiments. Error bars represent the SD from three or more independent experiments. Statistical analysis. Data obtained from cell viability assay were statistically analyzed using one-way ANOVA followed by Tukey's HSD test for multiple comparison analysis. Data are expressed as mean with 95% confidence intervals for all groups. P -values
Show full methods section
Materials. All chemicals were purchased from Sigma Aldrich (St Louis, MO) unless otherwise specified, and were used as received. ODN synthesis and purification were performed according to a reported protocol. 47 High-performance liquid chromatography (HPLC) analyses, absorption, and fluorescence measurements were performed accorded to reported protocols. 13 ODN sequences. All phosphoramidite monomers were purchased from Glen Research (Sterling, VA). The sequence of the anti-TfR RNA aptamer (c2.min) with a short DNA tail (CGA) 7 at the 3′end was the following (tail sequence is in italic): 5′-GGGGGAUCAAUCCAAGGGACCCGGAAACGCUCCCUUACACCCC CGACGACGACGACGACGACGA -3′ The sequence of the scrambled aptamer (c36) with a short DNA tail (CGA) 7 at the 3′end was the following (extended sequence of aptamer is in italic): 5′GGCGUAGUGAUUAUGAAUCGUGUGCUAAUACACGCC CGACGACGACGACGACGACGA -3′ All pyrimidines of the RNA aptamer motif were substituted by 2′-fluoro-pyrimidines. All synthesized ODNs contained a 5′amino group attached by a C-6 alkyl chain. The antitail sequence was the following: 5′-TCGTCGTCGTCGTCGTCGTCG-3' The sequence of the phosphorothioate NF- κ B decoy was the following (consensus sequence are in italic): 5′-CCT GGAAAGTCCC GAAA GGGACTTTCC AGG-3′ The sequence of scrambled phosphorothioate NF- κ B decoy was the following (complementary sequences are in italic) 5′- GCCGTACCTGACTTAGCC GAAA GGCTAAGTCAGGTACGGC -3′ All synthesized phosphorothioate ODNs contained a 3′amino group attached by a C-6 alkyl chain. Cell culture. Human pancreatic carcinoma cells (MIA PaCA-2), human cervical cancer cells (HeLa), and mouse embryonic fibroblast cells (NIH-3T3) were purchased from the American Type Culture Collection (ATCC, Manassas, VA). All cell lines were grown using a previously reported protocol. 13 Confocal imaging of cells. Cells were imaged using a Leica TCS SP5 SMD inverted confocal microscope (Leica Microsystems, Heidelberg, Germany) interfaced with a diode laser (Picoquant, Berlin, Germany) for excitation at 405 nm, with Ar lasers for excitation at 488 and 561 nm and with a HeNe laser for excitation at 633 nm. Glass bottom Petri dishes containing cells were mounted in a thermostated chamber at 37°C (Leica Microsystems) and viewed with a 63 × 1.2 NA water immersion objective or 40 × 1.5 NA oil immersion objective (Leica Microsystems). The pinhole aperture was set to 1.0 Airy. All data collected were analyzed by ImageJ software version 1.44o. Secondary structure and hybridization predictions. ODN secondary structure predictions were obtained using the Internet tool NUPACK nucleic acid package ( http://www.nupack.org/ ) with the default settings. Hybridization prediction between the tail sequence on the RNA aptamer structure and its short DNA complementary sequence (antitail) were obtained with NUPACK analysis algorithms software, representing each ODN as an RNA sequence. The NUPACK-generated secondary structures were used to obtain three-dimensional structures exploiting the utilities of the NUPACK software. ODN labeling. The amino residues at 5′-end of the extended RNA aptamer (c2.min + tail) and antitail were conjugated, to the ATTO 633 NHS fluorophore (ATTO-TEC GmbH, Siegen, Germany) and Alexa Fluor 488 NHS fluorophore (Invitrogen, Carlsbad, CA), respectively, by means of standard NHS coupling procedures between the primary amine of the ODNs and NHS-derivative of the fluorophores. The labeling reaction, purification, and quantification of the final product were performed according to a reported protocol. 13 ODN annealing protocol. To assemble the extended sequence of the RNA aptamer with its complementary DNA sequence, these two ODNs were mixed with equal molar concentration in a buffer solution, (PBS 1X containing 1 mM MgCl 2 ). The mixture was placed in a thermoblock and heated to 90°C for 1 minute to denature the nucleic acid structures. Then, the entire apparatus was placed on the workbench for 30 minutes and denatured oligo sample was slowly cooled to allow correct hybridization between the two complementary strands. The hybridized product was always freshly prepared before each evaluation. Dox intercalation in double helix region of the hybridized aptamer. A physical conjugate between hybridized aptamer carrier sample (c2C, c36C, c2C-d, and c2C-sd) and Dox was made by addition of 1 : 7.5 molar ratio of aptamer to Dox in binding buffer (PBS 1× containing 1 mmol/l MgCl 2 ). Dox fluorescence was measured (excitation: 480 nm, emission: 500–700 nm). Slits for both excitation and emission were set at 10 nm. The resulting complex (c2C–Dox, c36C–Dox, c2C-d–Dox, and c2C-sd–Dox) was freshly prepared before each experiment. Dox release from aptamer in serum-containing media. After physical conjugate preparation between c2C and Dox, the c2C–Dox complex was added to either 1% or 5% serum-containing medium and incubated at 37 °C for 0, 30, 60, 120 minutes, and 24 hours. Dox fluorescence was measured (excitation: 480 nm, emission: 540–700 nm. Slits for excitation and emission were set at 20 and 10 nm, respectively). The amount of Dox released was determined by comparison with that of a Dox sample incubated in the same conditions, assuming the fluorescence intensity of the starting complex and of free Dox sample as 0 and 100%, respectively. Assessment of cellular uptake by confocal microscopy. Internalization assay in MIA PaCa-2 cells was performed using a dual-labeled conjugate, in which the extended c2.min was labeled with ATTO 633 and the antitail was labeled with Alexa Fluor 488. MIA PaCa-2 cells were seeded 24 hours before the experiment in WillCo dishes to reach 80–90% confluence. Standard conditions for incubation consisted in 15-minute incubation at 37°C, 5% CO 2 in DMEM containing 1% bovine serum albumin (BSA), 0.2 mg/ml calf thymus DNA, and 0.2 µM of dual-labeled probe in a total volume of 500 µl. After incubation, cells were washed three times with PBS, fresh serum-containing medium was added and the sample was imaged by confocal microscopy. Cellular uptake of free Dox and c2C-Dox conjugate was assessed through confocal imaging evaluation both on MIA PaCa-2 cells and NIH-3T3 cells. In brief, the cells were seeded 24 hours before experiment in WillCo dishes to reach 80–90% confluence. Then, the cells were incubated with a 1% serum-containing medium with either free Dox or c2C-Dox (1.5 µmol/l Dox concentration) for 2 hours at 37 °C. After incubation, cells were washed three times with PBS, then fresh 1% serum-containing medium was added, and the sample was imaged by confocal microscopy either immediately ( i.e. , after 2 hours of incubation) or after additional 22 hours of incubation with drug-free culture medium ( i.e. , after 24 hours). Dox fluorescence in living cells was detected by confocal microscopy using 488 nm as excitation wavelength. All experiments were performed in triplicate. WST-8 cell viability assay. Cytotoxicity of free Dox and aptamer–Dox complexes was evaluated by using a tetrazolium salt, 2-(2-methoxy-4-nitrophenyl)-3-(4-nitrophenyl)-5-(2,4-disulfophenyl)-2 H tetrazolium, monosodium salt (WST-8) assay. MIA PaCA-2 cells, HeLa cells, and NIH-3T3 cells (1 × 10 4 cells per well) were seeded in 96-well plates. After culture for 24 hours, the cells were incubated with a 1% serum-containing medium with either free Dox or oligo-Dox conjugates for 2 hours. After 2 hours incubation, cells were washed twice with PBS and then fresh 1% serum-containing medium was added. After 24 hours from the treatment the medium was removed and cells were incubated with WST-8 reagent (10 µl) and 1% serum-containing medium (90 µl) for 3 hours. Dose–response curves for MIA PaCa-2, HeLa, and NIH 3T3 were obtained using increasing drug concentrations (1.5, 2.5, 3.5, 4.5, and 5.5 µmol/l as Dox concentration and 0.20, 0.33, 0.46, 0.6, 0.73 µmol/l as oligo concentration). The unconjugated aptamer cytotoxicity (c2C) was evaluated treating the cells with the higher aptamer concentration (0.73 µmol/l) employed in dose–response curve experiments. Absorbance (450 nm) was measured using a microplate reader (Infinite F50, Tecan, Männedorf, Switzerland). The percentage of cell viability was determined by comparing drug-treated cells with the untreated cells (100% viability). Data represent the average of three or more independent experiments. Error bars represent the SD from three or more independent experiments. Statistical analysis. Data obtained from cell viability assay were statistically analyzed using one-way ANOVA followed by Tukey's HSD test for multiple comparison analysis. Data are expressed as mean with 95% confidence intervals for all groups. P -values
📊 Figures
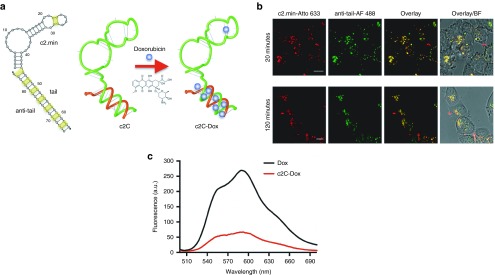
Figure 1
Rational design of c2Cu2013Dox conjugate and internalization property in tumor cells of the dual-labeled ODN. ( a ) From left to right, secondary structure prediction of the hybridized assembly compos...
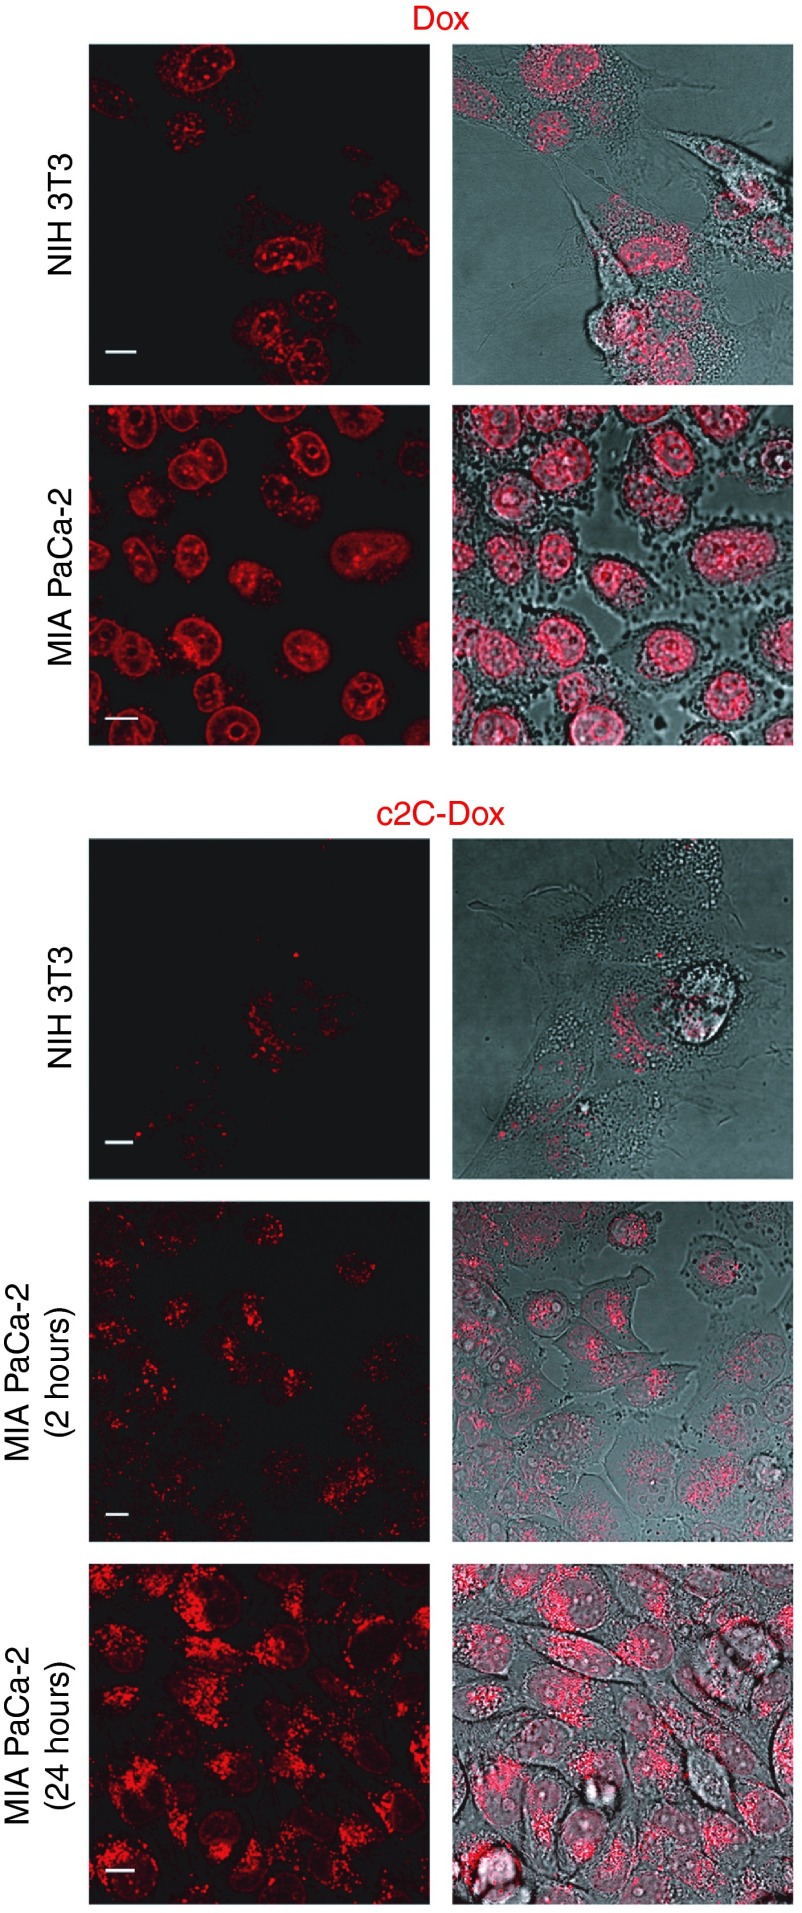
Figure 2
Selective internalization of the c2Cu2013Dox conjugate in targeted tumor cells. Confocal imaging microscopy shows the intracellular distribution of free Dox and Dox released from c2Cu2013Dox complex (...
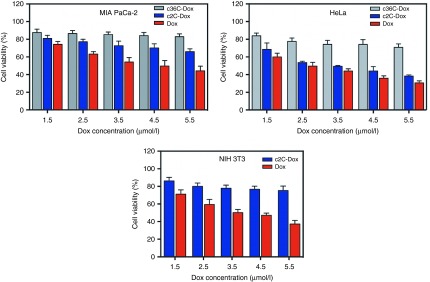
Figure 3
Cell viability assay of MIA PaCa-2, HeLa, and NIH-3T3 cells after treatment with free Dox (red), c2Cu2013Dox (blue), and c36Cu2013Dox (gray). Cells were incubated with the drugs for 2 hours and cell v...
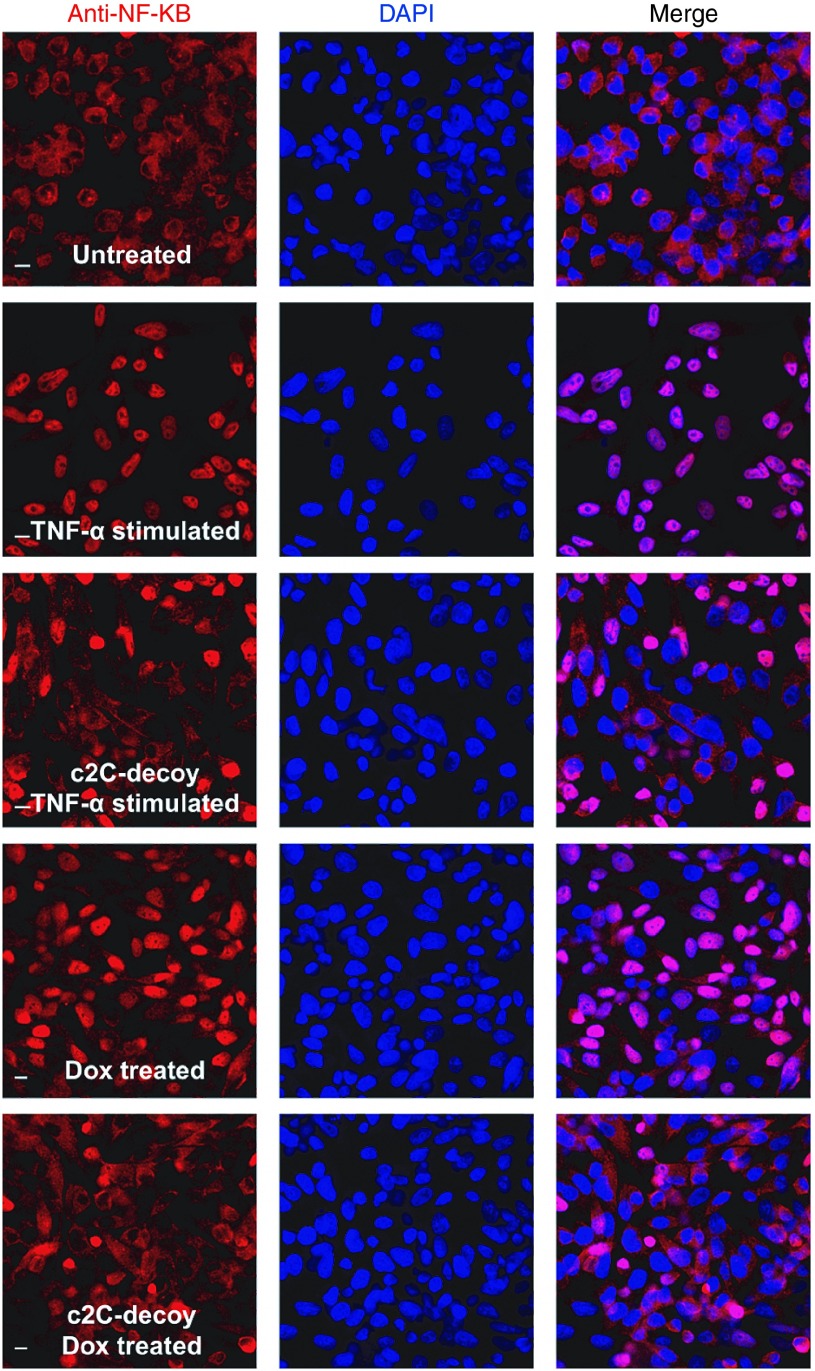
Figure 4
c2Cu2013d conjugate inhibits NF -u03ba B activity and sensitizes MIA PaCa-2 cells to Dox-induced apoptosis. Immunofluorescent staining of NF- u03ba B assesses its cellular localization. MIA PaCA-2 cel...
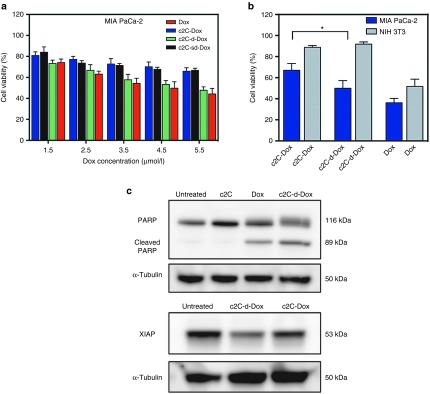
Figure 5
( a ) Cell viability assay of MIA PaCa-2 cells after treatment with free Dox (red), c2Cu2013Dox (blue), c2C-du2013Dox (green) and c2C-sdu2013Dox (black). Cells were incubated with the drugs for 2 hour...
Figure images are served from the NIH/NLM PubMed Central Open Access Subset or Europe PMC; copyright remains with the publishers and authors.
💬 Discussion
0 commentsNo comments yet. Be the first to start a discussion!
Leave a Comment