Abstract
Arginine-rich cell-penetrating peptides do not enter cells by directly passing through a lipid membrane; they instead passively enter vesicles and live cells by inducing membrane multilamellarity and fusion. The molecular picture of this penetration mode, which differs qualitatively from the previously proposed direct mechanism, is provided by molecular dynamics simulations. The kinetics of vesicle agglomeration and fusion by an iconic cell-penetrating peptide-nonaarginine-are documented via real-time fluorescence techniques, while the induction of multilamellar phases in vesicles and live cells is demonstrated by a combination of electron and fluorescence microscopies. This concert of experiments and simulations reveals that the identified passive cell penetration mechanism bears analogy to vesicle fusion induced by calcium ions, indicating that the two processes may share a common mechanistic origin.
🔬 Techniques
🔭 Microscopes
💻 Software
✨ Fluorophores
🔬 Cell Lines
🏭 Microscope Brands
🧪 Reagent Suppliers
💻 Software Details
🏛️ Research Organizations (ROR)
Affiliated research institutions:
📋 Methods
Liposome Experiments. Leakage. Calcein-containing vesicles were stirred at room temperature with LUV buffer in a quartz cuvette to obtain 1.5 mL of solution. The calcein fluorescence was monitored at 520 nm, with excitation at 495 nm. After an initial stirring phase of no less than 200 s, 3–6 μ L peptide in buffer solution was added. After the fluorescence intensity reached a plateau, 50 μ L of TRITON-X was added. Fluorescence intensity measurements were performed on a Fluorolog-3 spectrofluorimeter (model FL3–11; JobinYvon Inc.) equipped with a xenon-arc lamp. See SI Appendix for further details. Confocal microscopy. GUVs labeled with DiD were prepared for confocal microscopy using electroformation in a 300-mOsm/L sucrose solution. Prepared GUVs were diluted with a glucose buffer [9 mM HEPES, pH 7.40 (KOH), 90 mM KCl, 90 mM EDTA, 120 mM glucose, 300 mOsm/L, filtrated] with 20 μ L of 50 nM Atto 488 to a total volume of 300 μ L. Images were recorded using an Olympus IX81 laser scanning confocal microscope. For further details see SI Appendix . Cryo-EM. For cryo-EM sample preparation, 4 μ L of the sample was applied to plasma-cleaned EM grids [400-mesh copper grids, covered with Quantifoil film (R1.2/1.3)]. Samples were plunge frozen on the grids in liquid ethane in a Grid Plunger (Leica EM GP; Leica Microsystems GmbH) with the following parameters: preblotting exposure 5 s, blotting time 1.7 s, no postblotting exposure. Chamber humidity was set to 95% at 22 °C. The LUV solution was treated with R 9 (c = 25 mM) in a ratio of 10:1 for t > 60 s immediately before plunge freezing. Cryoelectron micrographs were collected on a JEM-2100F (JEOL Germany GmbH) operated at 200 kV (see SI Appendix for further details). Cell Experiments. Forty thousand HeLa cells were seeded to a well of μ -slide (ibiTreat; ibidi) 16–20 h before the experiment. Cells were washed with SF-DMEM and kept at 4 °C for 15 min to inhibit endocytic processes. For treatment, a precooled (4 °C) 15- μ M solution of a peptide in SF-DMEM was added to cells via media exchange and incubated for indicated periods of time at 4 °C. In selected cases, cells were treated for 3 min with a peptide at 4 °C, washed with precooled SF-DMEM, and further incubated for an indicated period at 4 °C in fresh SF-DMEM. Cells were imaged using a scanning confocal microscope (FluoView 1000; Olympus) and the tomograms were acquired on a Titan Halo transmission electron microscope (see SI Appendix for details). Computational Details. We use all atom molecular dynamics (MD) for the fusion process: In a first setup, we created two curved membranes via lipid population imbalances at the two leaflets of each bilayer. In the second setup, we put a very small vesicle composed of DOPE (80%) and DOPS (20%) in the unit cell and let it fuse with its periodic image. Both of these approaches facilitate formation of the stalk without enforcing its shape. For calcium fusion we used optimized charge-scaled force fields for ions, to account effectively for electronic polarization effects. For vesicle aggregation and bifurcation calculations we used coarse-graining methods. See SI Appendix for full details.
Show full methods section
Liposome Experiments. Leakage. Calcein-containing vesicles were stirred at room temperature with LUV buffer in a quartz cuvette to obtain 1.5 mL of solution. The calcein fluorescence was monitored at 520 nm, with excitation at 495 nm. After an initial stirring phase of no less than 200 s, 3–6 μ L peptide in buffer solution was added. After the fluorescence intensity reached a plateau, 50 μ L of TRITON-X was added. Fluorescence intensity measurements were performed on a Fluorolog-3 spectrofluorimeter (model FL3–11; JobinYvon Inc.) equipped with a xenon-arc lamp. See SI Appendix for further details. Confocal microscopy. GUVs labeled with DiD were prepared for confocal microscopy using electroformation in a 300-mOsm/L sucrose solution. Prepared GUVs were diluted with a glucose buffer [9 mM HEPES, pH 7.40 (KOH), 90 mM KCl, 90 mM EDTA, 120 mM glucose, 300 mOsm/L, filtrated] with 20 μ L of 50 nM Atto 488 to a total volume of 300 μ L. Images were recorded using an Olympus IX81 laser scanning confocal microscope. For further details see SI Appendix . Cryo-EM. For cryo-EM sample preparation, 4 μ L of the sample was applied to plasma-cleaned EM grids [400-mesh copper grids, covered with Quantifoil film (R1.2/1.3)]. Samples were plunge frozen on the grids in liquid ethane in a Grid Plunger (Leica EM GP; Leica Microsystems GmbH) with the following parameters: preblotting exposure 5 s, blotting time 1.7 s, no postblotting exposure. Chamber humidity was set to 95% at 22 °C. The LUV solution was treated with R 9 (c = 25 mM) in a ratio of 10:1 for t > 60 s immediately before plunge freezing. Cryoelectron micrographs were collected on a JEM-2100F (JEOL Germany GmbH) operated at 200 kV (see SI Appendix for further details). Cell Experiments. Forty thousand HeLa cells were seeded to a well of μ -slide (ibiTreat; ibidi) 16–20 h before the experiment. Cells were washed with SF-DMEM and kept at 4 °C for 15 min to inhibit endocytic processes. For treatment, a precooled (4 °C) 15- μ M solution of a peptide in SF-DMEM was added to cells via media exchange and incubated for indicated periods of time at 4 °C. In selected cases, cells were treated for 3 min with a peptide at 4 °C, washed with precooled SF-DMEM, and further incubated for an indicated period at 4 °C in fresh SF-DMEM. Cells were imaged using a scanning confocal microscope (FluoView 1000; Olympus) and the tomograms were acquired on a Titan Halo transmission electron microscope (see SI Appendix for details). Computational Details. We use all atom molecular dynamics (MD) for the fusion process: In a first setup, we created two curved membranes via lipid population imbalances at the two leaflets of each bilayer. In the second setup, we put a very small vesicle composed of DOPE (80%) and DOPS (20%) in the unit cell and let it fuse with its periodic image. Both of these approaches facilitate formation of the stalk without enforcing its shape. For calcium fusion we used optimized charge-scaled force fields for ions, to account effectively for electronic polarization effects. For vesicle aggregation and bifurcation calculations we used coarse-graining methods. See SI Appendix for full details.
📊 Figures
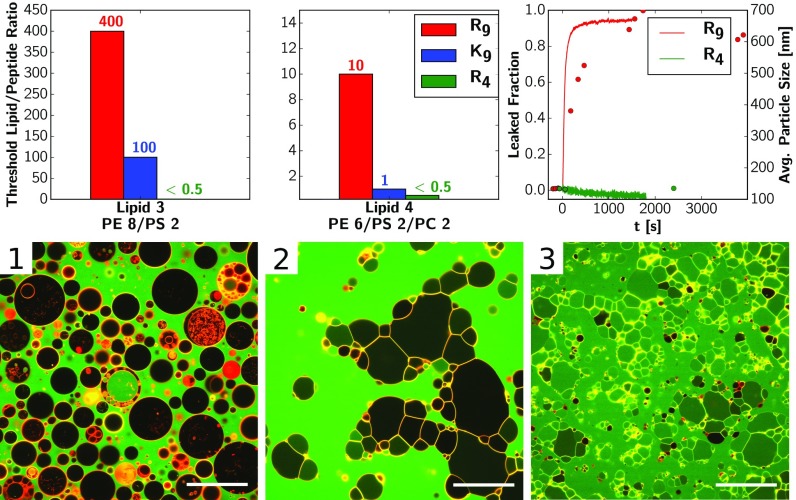
Fig. 1.
Fluorescence spectroscopy results. ( Top Left and Top Center ) Threshold concentrations for leakage induced by R 9 , K 9 , and R 4 given as inverse of the peptide/lipid ratios for two lipid compositio...
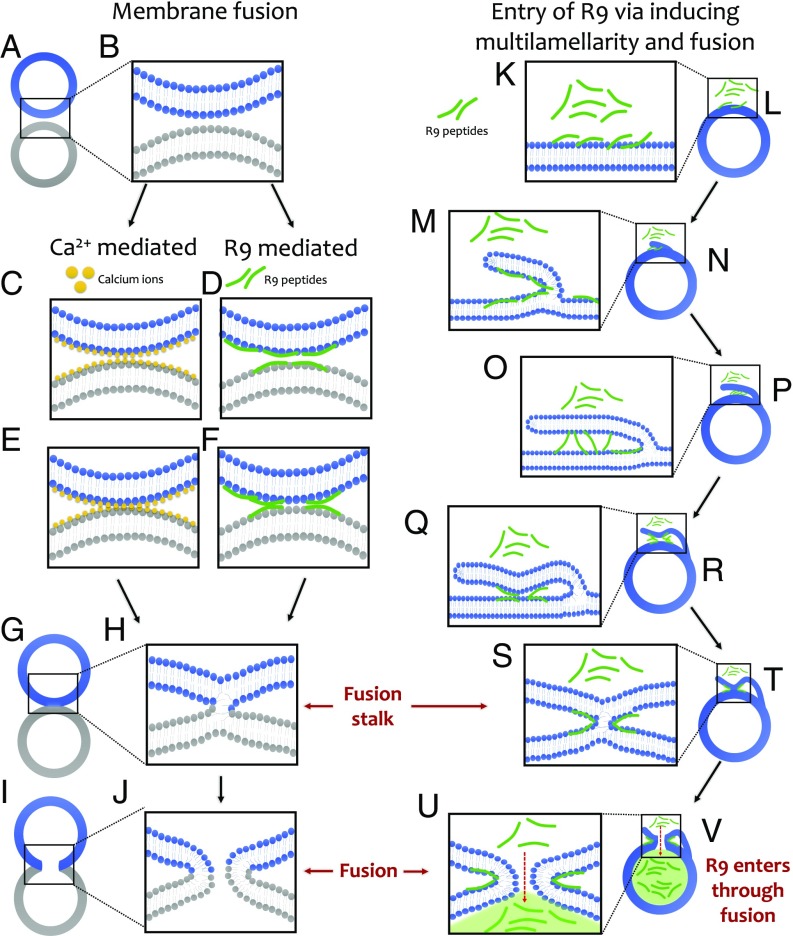
Fig. 2.
The schematic mechanisms of R 9 - and Ca 2+ -mediated vesicle fusion. ( A and B ) Fusion of different vesicles (in blue and gray) ( A ), by interface contact ( B ). ( C and D ) Adsorption of the charg...
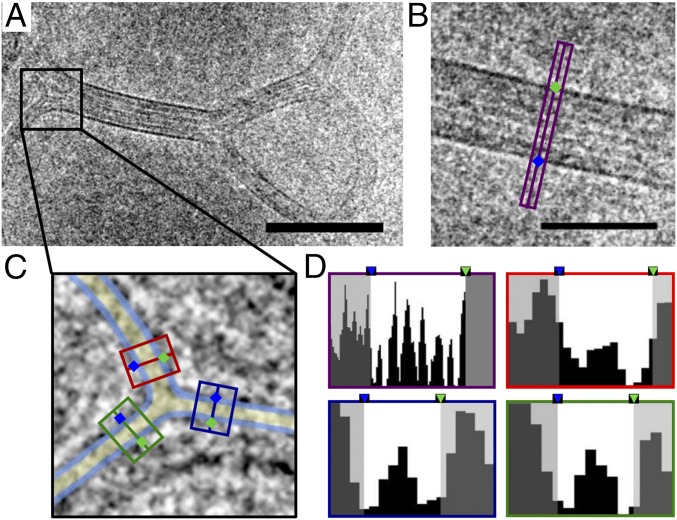
Fig. 3.
Electron micrographs of LUVs in the presence of R 9 . ( A ) Vesicles treated with R 9 (>60 s) fuse with each other and exhibit bifurcated, multilamellar membranes. (Scale bar, 100 nm.) ( B ) Example o...
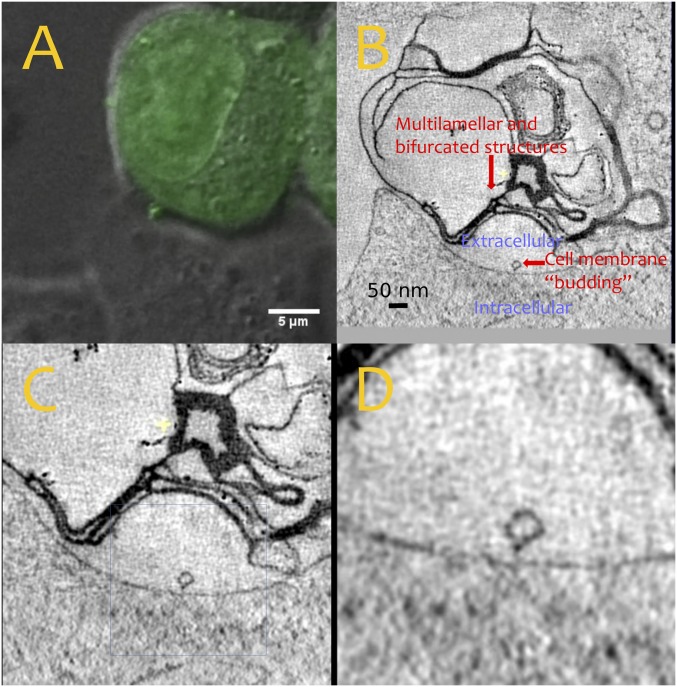
Fig. 4.
EM and fluorescence microscopy images of the same spot on a fixated HeLa cell in the presence of OG- R 9 . ( A ) A fluorescence microscopy image of the multilamellar spot showing the presence of the l...
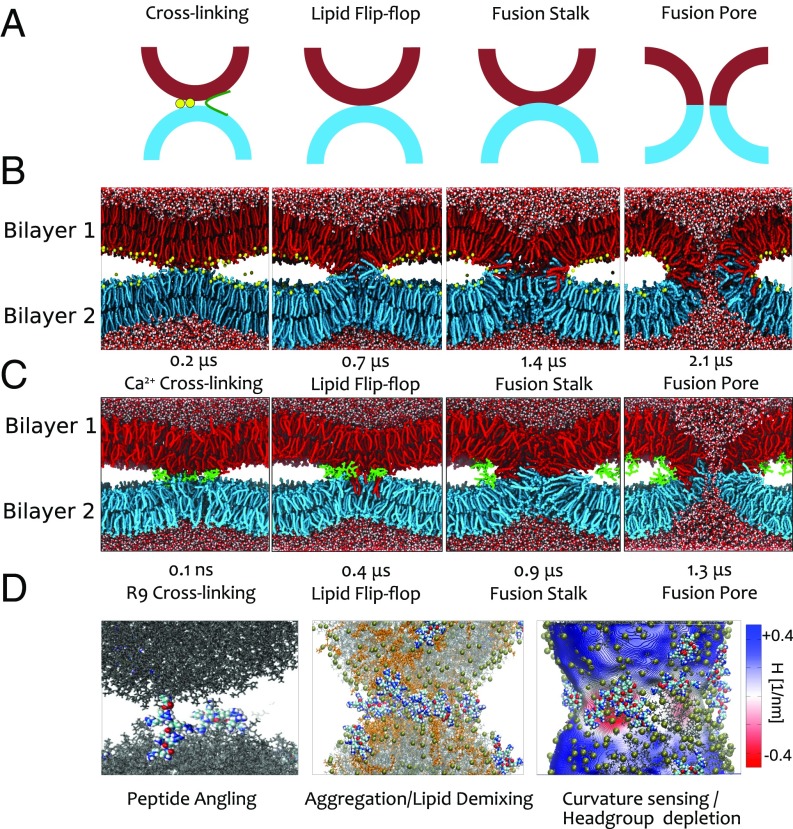
Fig. 5.
( A ) Schematic drawing of vesicle fusionu2013lipid cross-linking, stalk initialization, and subsequent onset of stalk formation through lipid flip-flop. ( B ) Time evolution of the Ca 2+ fusing bilay...
Figure images are served from the NIH/NLM PubMed Central Open Access Subset or Europe PMC; copyright remains with the publishers and authors.
💬 Discussion
0 commentsNo comments yet. Be the first to start a discussion!
Leave a Comment