Abstract
The respiratory and intestinal tracts are exposed to physical and biological hazards accompanying the intake of air and food. Likewise, the vasculature is threatened by inflammation and trauma. Mucin glycoproteins and the related von Willebrand factor guard the vulnerable cell layers in these diverse systems. Colon mucins additionally house and feed the gut microbiome. Here, we present an integrated structural analysis of the intestinal mucin MUC2. Our findings reveal the shared mechanism by which complex macromolecules responsible for blood clotting, mucociliary clearance, and the intestinal mucosal barrier form protective polymers and hydrogels. Specifically, cryo-electron microscopy and crystal structures show how disulfide-rich bridges and pH-tunable interfaces control successive assembly steps in the endoplasmic reticulum and Golgi apparatus. Remarkably, a densely O-glycosylated mucin domain performs an organizational role in MUC2. The mucin assembly mechanism and its adaptation for hemostasis provide the foundation for rational manipulation of barrier function and coagulation.
🔬 Techniques
🔭 Microscopes
🧬 Organisms
💻 Software
✨ Fluorophores
🧪 Sample Preparation
🔬 Cell Lines
🏭 Microscope Brands
🧪 Reagent Suppliers
💻 Software Details
💻 Code & Software
💾 Data Repositories
🏷️ Research Resource Identifiers (RRIDs)
Verified research resources used in this paper:
🏛️ Research Organizations (ROR)
Affiliated research institutions:
📋 Methods
Key Resources Table REAGENT or RESOURCE SOURCE IDENTIFIER Antibodies
Polyclonal anti human MUC2-D3 This study N/A Polyclonal anti mouse Muc2-D3 This study N/A Goat anti rabbit HRP Jackson ImmunoResearch Cat# 111-035-003; RRID: AB_2313567 Bacterial and Virus Strains E. coli XL-1 blue Agilent Cat# 200249 Biological Samples Murine colon lumen extracts This study N/A Chemicals, Peptides, and Recombinant Proteins Tobacco Etch Virus protease Produced in-house N/A Secreted protease of C1 esterase inhibitor (StcE) Expression plasmid provided by Carolyn Bertozzi; Malaker et al., 2019 N/A Protein produced in-house PEI MAX reagent Polysciences Cat# 24765-1 Deposited Data One-bead cryo-EM map This study EMDB: 10517 Two-bead cryo-EM map This study EMDB: 11658 MUC2 D1D2D3CysD1 atomic coordinates This study PDB: 6TM2 Atomic coordinates for three beads of the MUC2 head filament This study PDB: 7A5O CysD1 atomic coordinates This study PDB: 6TM6 MUC2 D3 dimer atomic coordinates Javitt et al., 2019 PDB: 65BF VWF D'D3 module atomic coordinates Dong et al., 2019 PDB: 6N29 Experimental Models: Cell Lines FreeStyle 293-F Cells Thermo Fisher Scientific Cat# R79007 Experimental Models: Organisms/Strains C57Bl mice Bred in house N/A Recombinant DNA MUC2 D1D2D3CysD1 expression plasmid Javitt et al., 2019 Addgene ID: 155214 MUC2 D1D2D3 expression plasmid Javitt et al., 2019 Addgene ID: 155215 MUC2 D3 expression plasmid Javitt et al., 2019 Addgene ID: 155216 MUC2 CysD1 expression plasmid This study N/A MUC2 D1D2D3CysD1 C1088A expression plasmid This study N/A MUC2 D1D2D3CysD1 C1130A expression plasmid This study N/A MUC2 D1D2D3CysD1 C1088A/C1130A expression plasmid This study N/A Muc5b D1D2D3CysD1 expression plasmid This study N/A Software and Algorithms SerialEM Mastronarde, 2005 https://bio3d.colorado.edu/SerialEM/ Pymol DeLano, 2002 https://pymol.org/2/ Coot Emsley et al., 2010 https://www2.mrc-lmb.cam.ac.uk/personal/pemsley/coot/ CryoSPARC Punjani et al., 2017 https://cryosparc.com/ Chimera Pettersen et al., 2004 https://www.cgl.ucsf.edu/chimera/ Phenix Adams et al., 2010 https://www.phenix-online.org/ Modeller Webb and Sali, 2016 https://salilab.org/modeller/ SHELX Sheldrick, 2015 https://ccp4serv7.rcharwell.ac.uk/ccp4online/ Molprobity Chen et al., 2010 http://molprobity.biochem.duke.edu/ SMOG2 Noel et al., 2016 http://smog-server.org/smog2/ GROMACS Pronk et al., 2013 http://www.gromacs.org/ Dynamics Wyatt Technology https://www.wyatt.com/products/software/dynamics.html MetaMorpheus Solntsev et al., 2018 https://github.com/smith-chem-wisc/MetaMorpheus Other Formvar/carbon 300 mesh copper grids Electron Microscopy Sciences Cat# FCF300-Cu Quantifoil R1/2 300 mesh copper grids Quantifoil Cat# Q3100CR-12 Resource Availability Lead Contact Requests for further information and or reagents may be addressed to the Lead Contact, Deborah Fass ( deborah.fass@weizmann.ac.il ).
Show full methods section
Key Resources Table REAGENT or RESOURCE SOURCE IDENTIFIER Antibodies
Polyclonal anti human MUC2-D3 This study N/A Polyclonal anti mouse Muc2-D3 This study N/A Goat anti rabbit HRP Jackson ImmunoResearch Cat# 111-035-003; RRID: AB_2313567 Bacterial and Virus Strains E. coli XL-1 blue Agilent Cat# 200249 Biological Samples Murine colon lumen extracts This study N/A Chemicals, Peptides, and Recombinant Proteins Tobacco Etch Virus protease Produced in-house N/A Secreted protease of C1 esterase inhibitor (StcE) Expression plasmid provided by Carolyn Bertozzi; Malaker et al., 2019 N/A Protein produced in-house PEI MAX reagent Polysciences Cat# 24765-1 Deposited Data One-bead cryo-EM map This study EMDB: 10517 Two-bead cryo-EM map This study EMDB: 11658 MUC2 D1D2D3CysD1 atomic coordinates This study PDB: 6TM2 Atomic coordinates for three beads of the MUC2 head filament This study PDB: 7A5O CysD1 atomic coordinates This study PDB: 6TM6 MUC2 D3 dimer atomic coordinates Javitt et al., 2019 PDB: 65BF VWF D'D3 module atomic coordinates Dong et al., 2019 PDB: 6N29 Experimental Models: Cell Lines FreeStyle 293-F Cells Thermo Fisher Scientific Cat# R79007 Experimental Models: Organisms/Strains C57Bl mice Bred in house N/A Recombinant DNA MUC2 D1D2D3CysD1 expression plasmid Javitt et al., 2019 Addgene ID: 155214 MUC2 D1D2D3 expression plasmid Javitt et al., 2019 Addgene ID: 155215 MUC2 D3 expression plasmid Javitt et al., 2019 Addgene ID: 155216 MUC2 CysD1 expression plasmid This study N/A MUC2 D1D2D3CysD1 C1088A expression plasmid This study N/A MUC2 D1D2D3CysD1 C1130A expression plasmid This study N/A MUC2 D1D2D3CysD1 C1088A/C1130A expression plasmid This study N/A Muc5b D1D2D3CysD1 expression plasmid This study N/A Software and Algorithms SerialEM Mastronarde, 2005 https://bio3d.colorado.edu/SerialEM/ Pymol DeLano, 2002 https://pymol.org/2/ Coot Emsley et al., 2010 https://www2.mrc-lmb.cam.ac.uk/personal/pemsley/coot/ CryoSPARC Punjani et al., 2017 https://cryosparc.com/ Chimera Pettersen et al., 2004 https://www.cgl.ucsf.edu/chimera/ Phenix Adams et al., 2010 https://www.phenix-online.org/ Modeller Webb and Sali, 2016 https://salilab.org/modeller/ SHELX Sheldrick, 2015 https://ccp4serv7.rcharwell.ac.uk/ccp4online/ Molprobity Chen et al., 2010 http://molprobity.biochem.duke.edu/ SMOG2 Noel et al., 2016 http://smog-server.org/smog2/ GROMACS Pronk et al., 2013 http://www.gromacs.org/ Dynamics Wyatt Technology https://www.wyatt.com/products/software/dynamics.html MetaMorpheus Solntsev et al., 2018 https://github.com/smith-chem-wisc/MetaMorpheus Other Formvar/carbon 300 mesh copper grids Electron Microscopy Sciences Cat# FCF300-Cu Quantifoil R1/2 300 mesh copper grids Quantifoil Cat# Q3100CR-12 Resource Availability Lead Contact Requests for further information and or reagents may be addressed to the Lead Contact, Deborah Fass ( deborah.fass@weizmann.ac.il ).
Materials Availability
The primary plasmids used in this study were deposited to Addgene (identifiers: MUC2 D1D2D3CysD1- 155214; MUC2 D1D2D3- 155215; MUC2 D3- 155216).
Data and Code Availability
Atomic models were deposited in the protein data bank under accession codes 6TM6 (CysD1), 6TM2 (D1D2D3CysD1), and 7A5O (three beads of D1D2D3CysD1, generated by applying the symmetry operators available in 6TM2 and with chain IDs assigned per polypeptide). The EM density maps were deposited in the EMDB under accession codes 10517 (one-bead map) and 11658 (two-bead map).
Experimental Model and Subject Details Mice
Colon mucin samples were collected from healthy 6-month-old C57Bl female mice. Mice were housed in the veterinary facility of Weizmann Institute, in a 12-hour light-dark cycle with access to food and water ad libitum , and their well-being was inspected daily. Experimental use of mice was approved by the institutional IACUC committee, approval number: 15000619-3. Mice were not previously subjected to any procedure or treatment. Mice were sacrificed by cervical dislocation, and colons were removed by dissection. Human embryonic kidney cell line (HEK293F) Suspension-adapted human embryonic kidney cells (HEK293F; FreeStyle 293-F) is a female cell line available from a commercial vendor (Thermo Fisher Scientific). Cells were grown in FreeStyle 293 Expression Medium (Thermo Fisher Scientific) at 37°C with 8% CO 2 and constant shaking.
Method Details Protein production and purification
The plasmids for producing D1D2D3 (human MUC residues 21 to 1259), D1D2D3CysD1 (human MUC residues 21 to 1397), and the D1D2D3CysD1 mutants were based on pcDNA3.1 and encoded a signal sequence at the amino terminus and a His 6 tag fused to the carboxy terminus. Plasmids were propagated in and purified from cells of the E. coli XL-1 strain. Proteins were produced by transient transfection of plasmids into HEK293F cells. Transfection was done using the PEI Max reagent (Polysciences, Inc.) with a 1:3 ratio (w/w) of DNA to PEI at a concentration of 1 million cells per milliliter. Six days after transfection, the culture medium was collected and centrifuged for 15 min at 500 g to pellet cells. The supernatant was then centrifuged for 15 min at 3000 g to pellet any remaining particulate matter. The supernatant from this second centrifugation was filtered through a 0.45 μm filter, and the His 6 -tagged proteins were purified by nickel-nitrilotriacetic acid (Ni-NTA) chromatography. Buffer was then exchanged to 10 mM Tris, pH 7.5 and 50 mM NaCl, and the proteins were concentrated to 3 mg/ml. To produce the CysD1 domain in isolation, residues 1299 to 1397 of human MUC2 were inserted into the pcDNA3.1 plasmid downstream of a segment encoding the sequence MRRCNSGSGPPPSLLLLLLWLLAVPGANAAPQGHHHHHHENLYFQGG, which includes the signal sequence from the protein QSOX1, a His 6 tag for purification, and a tobacco etch virus (TEV) protease cleavage site for tag removal. TEV protease cleavage left two non-native glycines fused to the amino terminus of the CysD1 domain. Transfection and Ni-NTA chromatography were performed as above. The eluted protein was dialyzed against 0.5X phosphate buffered saline (PBS) at room temperature overnight at a 25:1 molar ratio with TEV protease. After dialysis, Ni-NTA beads were added to the solution, and the suspension was mixed end-over-end for 20 min. The beads were then allowed to settle to remove TEV protease, the cleaved His 6 tag, and any remaining uncleaved material. The supernatant was collected, the cleaved protein was concentrated to 7 mg/ml, and the buffer was exchanged to 10 mM Tris, pH 7.5, 20 mM NaCl for crystallization. Dynamic light scattering Samples of purified recombinant D1D2D3CysD1 were placed in a clear bottom black 96 well plate and diluted to 0.3 mg/ml in 37°C pre-warmed 180 μM citric acid/disodium hydrogen phosphate buffer (citrate-phosphate buffer; McIlvaine buffer) or MES buffer with 150 mM NaCl, with or without 1 mM CaCl 2 . DLS data were recorded using a DynaPro Plate reader (WYATT Technology) pre-warmed to 37°C. The dead time at the beginning of each experiment due to plate insertion and temperature re-equilibration was about 6 min. Data were processed with the supplied DYNAMICS software (Wyatt Technology). The reported average radius was calculated between 40 and 120 min after the start of the experiment.
Antibody production The recombinant dimeric D3 assemblies of human
MUC2 (residues 858 to 1259) and mouse Muc2 (residues 856 to 1255), produced with an amino-terminal signal sequence and a carboxy-terminal His 6 tag and purified as for D1D2D3 and D1D2D3CysD1, were used to inoculate rabbits for polyclonal antibody production (Sigma-Aldrich Israel Ltd.). Antibodies were purified from serum by protein G chromatography, eluted with 100 mM glycine into tubes containing one-fifth the eluted volume of 1 M Tris pH 8. Peak fractions were dialyzed against PBS, concentrated to 3 mg/ml, and stored frozen.
Colon mucus digestion and western blotting
StcE digestion was used to liberate soluble mucin fragments from murine colon without mechanical disruption or reduction. Without StcE treatment, oxidized colon mucins were too large to be analyzed by gel electrophoresis or other methods. StcE enzyme ( Yu et al., 2012 ) was produced in the E. coli strain BL21(DE3), purified by Ni-NTA chromatography, and exchanged into PBS. Colon sections ~1 cm long were excised, and the lumen was gently filled, using a gel-loading pipette tip, with 50 μl of 10 μM StcE, supplemented with phenylmethylsulfonyl fluoride, leupeptin, and pepstatin A to inhibit other proteases. Colon sections were placed inside 1.5 mL centrifuge tubes and incubated at 37°C for 1 hr. The colon lumen was then flushed with 150 μl of PBS, and the flushed suspension was collected. The suspension was centrifuged at 20,000xg for 1 min in a microcentrifuge. One hundred μl of the soluble fraction was removed and centrifuged again at 20,000xg for 1 min. Ten μl were taken from the soluble fraction and applied to a 4 to 12% gradient polyacrylamide gel after addition of non-reducing loading buffer. To prepare cleaved recombinant D1D2D3CysD1, StcE was added at a concentration of 1 μM to 1.5 μM (225 ng/μl) D1D2D3CysD1 and incubated for 0.5 hr at 37°C. After this incubation, 30 ng of cleaved D1D2D3CysD1 was applied to the gel, alongside 15 ng each of undigested D1D2D3CysD1 and D1D2D3, and 10 ng of D3, after addition of loading buffer. After gel electrophoresis, proteins were transferred to nitrocellulose membranes using an iBlot 2 dry blotting system (Thermo Fisher Scientific). Detection was done using polyclonal antibody raised against the murine Muc2 D3 assembly. This antibody is cross-reactive with the human recombinant MUC2 fragments. Membranes were blocked with 5% w/v bovine serum albumin in PBS containing 0.1% Tween 20. After 1 hr, purified antibody stock was diluted 1:1000 into the blocking solution. Secondary antibody was goat anti-rabbit conjugated to horseradish peroxidase.
Sample preparation for EM
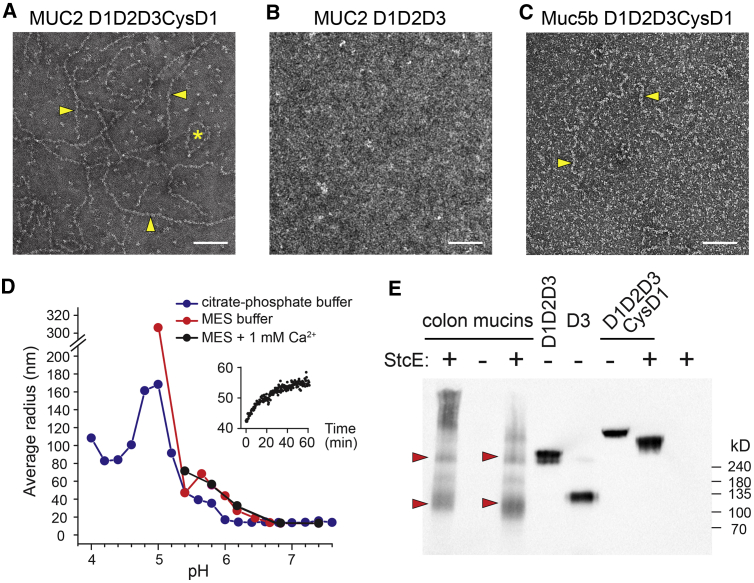
For negative staining, purified MUC2 D1D2D3CysD1 and D1D2D3 were diluted to a concentration of 1 mg/ml in 50 mM MES, pH 6.2, 225 mM NaCl, 10 mM CaCl 2 and incubated at 37°C for 7 hr. Muc5b D1D2D3CysD1 was diluted into 50 mM MES, pH 5.4, 225 mM NaCl, 10 mM CaCl 2 . After incubation, the proteins were diluted in their respective buffers to a concentration of 0.03 mg/ml, and 3 μl solution was applied to glow discharged carbon-coated 300 mesh copper grids (Electron Microscopy Sciences) for 30 s, followed by staining with 2% uranyl acetate solution. Samples were visualized using a Tecnai T12 electron microscope (Thermo Fisher Scientific) equipped with a OneView camera (Gatan). For CryoEM, purified MUC2 D1D2D3CysD1 was incubated at a concentration of 0.3 mg/ml in 50 mM MES, pH 5.7, 225 mM NaCl at 37°C for 24 hr. The incubated protein solution (3 μl) was pipetted onto glow discharged Quantifoil R1/2, 300 mesh copper grids. Grids were plunge frozen into liquid ethane cooled by liquid nitrogen using a Vitrobot plunger (Thermo Fisher Scientific) at 100% humidity.
Cryo-EM image acquisition
Cryo-EM data were collected on a Titan Krios G3i transmission electron microscope (Thermo Fisher Scientific) operated at 300 kV. Movies were recorded on a K3 direct detector (Gatan) installed behind a BioQuantum energy filter (Gatan) using a slit of 20 eV. Movies were recorded in counting mode at a nominal magnification of 105,000x, corresponding to a physical pixel size of 0.85 Å. The dose rate was set to 23 e - /pixel/s, and the total exposure time was 1.5 s, resulting in an accumulated dose of ~48 e - /Å 2 . Each movie was split into 45 frames of 0.033 s. Nominal defocus range was −1 to −2 μm. SerialEM was used for automated data collection ( Mastronarde, 2005 ), in which a single image was collected from the center of each hole. Image shift was used to navigate within 3x3 hole arrays, and stage shift to move between arrays. Beam tilt was adjusted to achieve coma-free alignment when applying image shift.
Cryo-EM image processing and atomic coordinate fitting
Image processing was performed using CryoSPARC software v2.9 ( Punjani et al., 2017 ). A total of 3242 acquired movies were subjected to patch motion correction, followed by patch CTF estimation. Of these, 2745 images showing CTF fit resolution better than 3.5 Å were selected for further processing. Initial particle picking was done using the Blob Picker function on a subset of 200 micrographs. About 32,000 particles were extracted, 2D classified into 50 classes, and 15 class averages with high resolution and visible secondary structure were used as templates for automated particle picking from the entire dataset. In total 987,943 particles were extracted and subjected to multiple rounds of 2D classification, in which 2D classes were selected for further processing based on the appearance of secondary structure elements, resulting in a dataset of 84,970 particles. These particles were used for ab initio 3D reconstruction, followed by homogeneous 3D refinement, which resulted in a refined map at 3.2 Å resolution. To extract more and better particles from the micrographs, 50 equally spaced re-projections of the new reconstruction were used as templates for another round of automated particle picking, resulting in 1,430,962 picked particles. The new dataset was, similarly, subjected to multiple rounds of 2D classifications, retaining classes with well-resolved features, and 293,080 particles were retained and used for 3D refinement. Subsequently, 3D heterogeneous refinement into 3 classes was performed, and one class, consisting of 178,136 particles, which showed the highest resolution, was homogeneously refined with C2 symmetry to 2.95 Å resolution. The final map was subjected to local resolution estimate and filtered accordingly. To generate 2D classes and reconstructions including multiple beads, particles were re-extracted with larger box sizes. The two-bead map shown in Figures S6 C, S7 B, and S7C was refined to 3.95 Å resolution without symmetry imposed. Model building, refinement, and analysis The previously reported MUC2 D3 dimer (PDB ID 6RBF ) was fitted manually into the single-bead cryo-EM map, and the rest of the model was manually built in Coot (Emsley et al., 2010). Each β sandwich VWD and helical-bundle C8 subdomain of regions D1 (residues 35-291 as numbered according to the mucin 2 precursor, Uniprot Q02817 ; domain boundaries are according to Nilsson et al. [2014 ]), D2 (residues 388-655), and D3 (residues 858-1117) ( Figure 1 C) were readily built into the structure model. In addition, density was evident for the TIL1 and E1 subdomains (residues 292-387) linking D1 to D2, as well as for most of TIL2 (residues 656-719) and E' (residues 822-857), which contribute to bridging D2 and D3. Partial density was also observed for the remainder of the D2-D3 bridge formed by E2 (residues 720-756) and TIL' (residues 757-821). The entire bridge between D2 and D3 was visible in the two-bead map ( Figures S7 B and S7C). The position of the CysD1 domain was clear in the one-bead map. The trajectory of the PTS region linking D3 with CysD1 could be seen in each map but not reliably modeled. The final model refined against the 2.95 Å map included MUC2 amino acids 35 to 721, 724 to 749, 780 to 793, 801 to 1197, and 1302 to 1391. The model was refined by cycles of real-space refinement using Phenix ( Adams et al., 2010 ) and manual rebuilding in Coot. The structure was analyzed and structure figures were generated using Pymol ( DeLano, 2002 ). Model geometry was assessed using Molprobity ( Chen et al., 2010 ).
VWF tubule modeling
A homology model of the VWF repeat unit was generated by a combination of known VWF structure fragments and use of the Modeller software ( Webb and Sali, 2016 ). The crystallographic structure of a monomeric mutant of the VWF D3 region (PDB code 6N29 ) ( Dong et al., 2019 ) was divided into three segments spanning residues 764 to 827, 828 to 862, and 864 to 1241. Each segment was positioned by least-squares fitting using Coot onto the appropriate region of the MUC2 bead. A homology model was generated using Modeller for the D1-D2 segment of VWF (residues 33 to 692). From this composite model, the C2-symmetry-related portion of the VWF repeating unit was generated. Modeling of the VWF tubule was done based on the published low-resolution reconstruction of the tubule ( Huang et al., 2008 ). The VWF repeat unit model was positioned with its two-fold axis perpendicular to the tubule axis and at a distance consistent with the reported inner and outer diameters of the tubule ( Huang et al., 2008 ). Helical symmetry was applied with 85.6° rotation and 26.2 Å rise, using Chimera ( Pettersen et al., 2004 ). Rotations around the two-fold symmetry axis of the bead were tested in 2° steps to achieve the closest match with domain contours on the inner and outer faces of the low-resolution reconstruction of the VWF tubule ( Huang et al., 2008 ), as the original maps were not available from the authors or from public repositories.
Glycopeptide analysis
Four hundred μl of 3 mg/ml MUC2 D1D2D3CysD1 was placed in a 10 kD molecular mass cut-off dialysis bag together with 10 μM StcE and dialyzed for 4 days at room temperature against 10 mL of Milli-Q water. The dialysate, containing StcE-generated glycopeptides, was then collected, lyophilized, and resuspended in 3% acetonitrile with 0.1% formic acid. Samples were analyzed using a nanoAcquity (Waters) nanoLC coupled to an Orbitrap Fusion Lumos (ThermoFisher) system. Resuspended glycopeptides were loaded onto a Symmetry C18 trap column (0.3 × 25 mm, 5 μm particle size, 100 Å pore size, Waters) and separated on a nanoEase HSS T3 (C18, 0.075 × 250 mm, 1.8 μm particle size, 100 Å pore size, Waters) using a gradient of 4 to 30% solvent B (acetonitrile, 0.1% formic acid) over 50 min. Data were acquired in Data Dependent Acquisition (DDA) mode, with primary scans set at 120,000 resolution and scan range of 150-1650 m/z. MS2 scans were performed on precursors with charge states 1-8, using 30 s dynamic exclusion. Each precursor underwent two separate MS2 events, either with higher-energy collision dissociation (HCD) at 30 normalized collision energy (NCE) or electron-transfer/higher-energy collision induced dissociation (EThcD) with HCD set at 15 NCE. Both events used isolation window of 1 m/z, 15,000 resolution, and first mass set to 100 m/z. DDA cycle was set to 3 s. Downstream analysis was performed using MetaMorpheus software ( Solntsev et al., 2018 ) with the O-Pair search function ( https://www.biorxiv.org/content/10.1101/2020.05.18.102327v1.full ). Search was performed against the MUC2 short PTS region protein sequence, using the O-glycan library in MetaMorpheus supplemented with glycan compositions from ( Larsson et al., 2011 ). Results were validated manually. CysD1 crystallization and structure solution CysD1 plate-like crystals appeared by the hanging drop vapor diffusion method over a well solution containing 100 mM citrate-phosphate buffer, pH 4.4, with 15% ethanol and 1% PEG 1K within 12 hr. For cryo protection, a crystal was transferred briefly to a drop containing 20% glycerol, 15% ethanol, 3% PEG 1K and 50 mM citrate-phosphate buffer, pH 4.4, mounted in a loop, and flash-frozen in a 100 K nitrogen stream. A single dataset of 690° continuous phi measurement with 1° frames was collected at a wavelength of 1.54 Å on a Rigaku MicroMax-007HF X-ray generator equipped with VariMax optics Cu-HF and R-Axis IV++ image plate detector. The CysD1 structure was solved by sulfur single-wavelength anomalous diffraction (SAD) using the SHELX program ( Sheldrick, 2015 ). The initial auto-built model was then iteratively rebuilt and refined using Coot and Phenix. A composite simulated annealing omit map was produced and inspected to ensure the accuracy of the final model. Model geometry was assessed using Molprobity, and no Ramachandran outliers were detected.
Computational methods for full-length MUC2 simulations
A representation of a filament composed of 7 consecutive MUC2 beads was generated using the atomic coordinates and rotation/translation matrix obtained from the D1D2D3CysD1 cryo-EM structure. Eight disordered tail regions were appended to the ends of specific CysD1 domains as described below. For simplicity, the CysD2 domain was not modeled structurally but was included within the 2938 amino acids of disordered tail polypeptide, and the set of carboxy-terminal domains following the long disordered segment was represented as a sphere with radius 40 Å. Spheres of tails appended to beads i and i+3 were linked to one another to represent dimerization of CTCK domains. Thus, beads 1 and 4, 2 and 5, 3 and 6, and 4 and 7 were linked. With this design, the central bead 4 was modeled with all tails in its vicinity present: two tails were appended to its two CysD1 domains, and two other tails (connecting beads 2 with 5 and 3 with 6) passed over it. The conformational ensemble of the modeled MUC2 tails was studied using coarse-grained simulations. Due to the high complexity of this system (in both size and plasticity), each amino acid was represented by a single sphere located at the position of the Cα atom, and the head regions of the filaments were kept static. The disordered tails were modeled as flexible excluded-volume polymers with enthalpic contributions from interactions between hydrophobic residues ( i.e ., isoleucine and valine), contributing to compaction of the chain. These interactions were modeled using a Lennard-Jones potential with sigma = 0.6 nm and epsilon = 1. To account for the abundance of prolines, conformational preferences were introduced into the model of the polypeptide: if at least 2 out of 4 consecutive Cα atoms belonged to prolines, the dihedral angle defined by those 4 atoms was constrained to 260°. The bulk of glycan modifications was modeled by varying the excluded volume (repulsive) term, which was assigned values of 4, 10 or 15 Å. The tail model was constructed in a fully extended conformation, which was first subjected to pulling forces to achieve a more compact conformation from which further condensation could be driven by intra- and inter-molecular hydrophobic interactions. To study the system at equilibrium, simulations were performed at constant temperature T = 100 (reduced units) for 100 ns. The coarse-grained Cα-based model was generated using SMOG2 ( Noel et al., 2016 ). The dynamics of the system were modeled by the Langevin equation, as implemented in GROMACS 2018.3 ( Pronk et al., 2013 ).
Preparation and imaging of colon sections
Mouse distal colons were removed, cut into 2-3 mm segments, and fixed in Karnovsky fixative (4% paraformaldehyde (PFA), 2% glutaraldehyde in 0.1 M cacodylate buffer, pH 7.4, containing 5 mM CaCl 2 ) overnight at room temperature. Samples were then washed 3 times in 0.1 M sodium cacodylate buffer and incubated for 1 hr with 1% osmium tetroxide, 0.5% K 2 Cr 2 O 7 , and 0.5% K 4 [Fe(CN) 6 ]·3H 2 O in 0.1 M sodium cacodylate buffer. Following further washing with cacodylate buffer followed by double-distilled water, samples were incubated for 30 min with 2% uranyl acetate dissolved in water. Sections were washed with water, dehydrated, infiltrated with Epon, and finally embedded in Epon to generate blocks. Thin sections were prepared, placed on grids, and imaged on a Tecnai T12 electron microscope.
Quantification and Statistical Analysis
Reported resolutions for cryo-EM maps are based upon the 0.143 Fourier Shell Correlation criterion and were calculated using CryoSPARC ( Figure S4 ; Table S1 ). Statistical validation performed on the deposited atomic models was done using Phenix ( Tables S1 and S3 ).
Materials Availability
The primary plasmids used in this study were deposited to Addgene (identifiers: MUC2 D1D2D3CysD1- 155214; MUC2 D1D2D3- 155215; MUC2 D3- 155216).
Experimental Model and Subject Details Mice
Colon mucin samples were collected from healthy 6-month-old C57Bl female mice. Mice were housed in the veterinary facility of Weizmann Institute, in a 12-hour light-dark cycle with access to food and water ad libitum , and their well-being was inspected daily. Experimental use of mice was approved by the institutional IACUC committee, approval number: 15000619-3. Mice were not previously subjected to any procedure or treatment. Mice were sacrificed by cervical dislocation, and colons were removed by dissection. Human embryonic kidney cell line (HEK293F) Suspension-adapted human embryonic kidney cells (HEK293F; FreeStyle 293-F) is a female cell line available from a commercial vendor (Thermo Fisher Scientific). Cells were grown in FreeStyle 293 Expression Medium (Thermo Fisher Scientific) at 37°C with 8% CO 2 and constant shaking.
Method Details Protein production and purification
The plasmids for producing D1D2D3 (human MUC residues 21 to 1259), D1D2D3CysD1 (human MUC residues 21 to 1397), and the D1D2D3CysD1 mutants were based on pcDNA3.1 and encoded a signal sequence at the amino terminus and a His 6 tag fused to the carboxy terminus. Plasmids were propagated in and purified from cells of the E. coli XL-1 strain. Proteins were produced by transient transfection of plasmids into HEK293F cells. Transfection was done using the PEI Max reagent (Polysciences, Inc.) with a 1:3 ratio (w/w) of DNA to PEI at a concentration of 1 million cells per milliliter. Six days after transfection, the culture medium was collected and centrifuged for 15 min at 500 g to pellet cells. The supernatant was then centrifuged for 15 min at 3000 g to pellet any remaining particulate matter. The supernatant from this second centrifugation was filtered through a 0.45 μm filter, and the His 6 -tagged proteins were purified by nickel-nitrilotriacetic acid (Ni-NTA) chromatography. Buffer was then exchanged to 10 mM Tris, pH 7.5 and 50 mM NaCl, and the proteins were concentrated to 3 mg/ml. To produce the CysD1 domain in isolation, residues 1299 to 1397 of human MUC2 were inserted into the pcDNA3.1 plasmid downstream of a segment encoding the sequence MRRCNSGSGPPPSLLLLLLWLLAVPGANAAPQGHHHHHHENLYFQGG, which includes the signal sequence from the protein QSOX1, a His 6 tag for purification, and a tobacco etch virus (TEV) protease cleavage site for tag removal. TEV protease cleavage left two non-native glycines fused to the amino terminus of the CysD1 domain. Transfection and Ni-NTA chromatography were performed as above. The eluted protein was dialyzed against 0.5X phosphate buffered saline (PBS) at room temperature overnight at a 25:1 molar ratio with TEV protease. After dialysis, Ni-NTA beads were added to the solution, and the suspension was mixed end-over-end for 20 min. The beads were then allowed to settle to remove TEV protease, the cleaved His 6 tag, and any remaining uncleaved material. The supernatant was collected, the cleaved protein was concentrated to 7 mg/ml, and the buffer was exchanged to 10 mM Tris, pH 7.5, 20 mM NaCl for crystallization. Dynamic light scattering Samples of purified recombinant D1D2D3CysD1 were placed in a clear bottom black 96 well plate and diluted to 0.3 mg/ml in 37°C pre-warmed 180 μM citric acid/disodium hydrogen phosphate buffer (citrate-phosphate buffer; McIlvaine buffer) or MES buffer with 150 mM NaCl, with or without 1 mM CaCl 2 . DLS data were recorded using a DynaPro Plate reader (WYATT Technology) pre-warmed to 37°C. The dead time at the beginning of each experiment due to plate insertion and temperature re-equilibration was about 6 min. Data were processed with the supplied DYNAMICS software (Wyatt Technology). The reported average radius was calculated between 40 and 120 min after the start of the experiment.
Antibody production The recombinant dimeric D3 assemblies of human
MUC2 (residues 858 to 1259) and mouse Muc2 (residues 856 to 1255), produced with an amino-terminal signal sequence and a carboxy-terminal His 6 tag and purified as for D1D2D3 and D1D2D3CysD1, were used to inoculate rabbits for polyclonal antibody production (Sigma-Aldrich Israel Ltd.). Antibodies were purified from serum by protein G chromatography, eluted with 100 mM glycine into tubes containing one-fifth the eluted volume of 1 M Tris pH 8. Peak fractions were dialyzed against PBS, concentrated to 3 mg/ml, and stored frozen.
Colon mucus digestion and western blotting
StcE digestion was used to liberate soluble mucin fragments from murine colon without mechanical disruption or reduction. Without StcE treatment, oxidized colon mucins were too large to be analyzed by gel electrophoresis or other methods. StcE enzyme ( Yu et al., 2012 ) was produced in the E. coli strain BL21(DE3), purified by Ni-NTA chromatography, and exchanged into PBS. Colon sections ~1 cm long were excised, and the lumen was gently filled, using a gel-loading pipette tip, with 50 μl of 10 μM StcE, supplemented with phenylmethylsulfonyl fluoride, leupeptin, and pepstatin A to inhibit other proteases. Colon sections were placed inside 1.5 mL centrifuge tubes and incubated at 37°C for 1 hr. The colon lumen was then flushed with 150 μl of PBS, and the flushed suspension was collected. The suspension was centrifuged at 20,000xg for 1 min in a microcentrifuge. One hundred μl of the soluble fraction was removed and centrifuged again at 20,000xg for 1 min. Ten μl were taken from the soluble fraction and applied to a 4 to 12% gradient polyacrylamide gel after addition of non-reducing loading buffer. To prepare cleaved recombinant D1D2D3CysD1, StcE was added at a concentration of 1 μM to 1.5 μM (225 ng/μl) D1D2D3CysD1 and incubated for 0.5 hr at 37°C. After this incubation, 30 ng of cleaved D1D2D3CysD1 was applied to the gel, alongside 15 ng each of undigested D1D2D3CysD1 and D1D2D3, and 10 ng of D3, after addition of loading buffer. After gel electrophoresis, proteins were transferred to nitrocellulose membranes using an iBlot 2 dry blotting system (Thermo Fisher Scientific). Detection was done using polyclonal antibody raised against the murine Muc2 D3 assembly. This antibody is cross-reactive with the human recombinant MUC2 fragments. Membranes were blocked with 5% w/v bovine serum albumin in PBS containing 0.1% Tween 20. After 1 hr, purified antibody stock was diluted 1:1000 into the blocking solution. Secondary antibody was goat anti-rabbit conjugated to horseradish peroxidase.
Sample preparation for EM
For negative staining, purified MUC2 D1D2D3CysD1 and D1D2D3 were diluted to a concentration of 1 mg/ml in 50 mM MES, pH 6.2, 225 mM NaCl, 10 mM CaCl 2 and incubated at 37°C for 7 hr. Muc5b D1D2D3CysD1 was diluted into 50 mM MES, pH 5.4, 225 mM NaCl, 10 mM CaCl 2 . After incubation, the proteins were diluted in their respective buffers to a concentration of 0.03 mg/ml, and 3 μl solution was applied to glow discharged carbon-coated 300 mesh copper grids (Electron Microscopy Sciences) for 30 s, followed by staining with 2% uranyl acetate solution. Samples were visualized using a Tecnai T12 electron microscope (Thermo Fisher Scientific) equipped with a OneView camera (Gatan). For CryoEM, purified MUC2 D1D2D3CysD1 was incubated at a concentration of 0.3 mg/ml in 50 mM MES, pH 5.7, 225 mM NaCl at 37°C for 24 hr. The incubated protein solution (3 μl) was pipetted onto glow discharged Quantifoil R1/2, 300 mesh copper grids. Grids were plunge frozen into liquid ethane cooled by liquid nitrogen using a Vitrobot plunger (Thermo Fisher Scientific) at 100% humidity.
Cryo-EM image acquisition
Cryo-EM data were collected on a Titan Krios G3i transmission electron microscope (Thermo Fisher Scientific) operated at 300 kV. Movies were recorded on a K3 direct detector (Gatan) installed behind a BioQuantum energy filter (Gatan) using a slit of 20 eV. Movies were recorded in counting mode at a nominal magnification of 105,000x, corresponding to a physical pixel size of 0.85 Å. The dose rate was set to 23 e - /pixel/s, and the total exposure time was 1.5 s, resulting in an accumulated dose of ~48 e - /Å 2 . Each movie was split into 45 frames of 0.033 s. Nominal defocus range was −1 to −2 μm. SerialEM was used for automated data collection ( Mastronarde, 2005 ), in which a single image was collected from the center of each hole. Image shift was used to navigate within 3x3 hole arrays, and stage shift to move between arrays. Beam tilt was adjusted to achieve coma-free alignment when applying image shift.
Cryo-EM image processing and atomic coordinate fitting
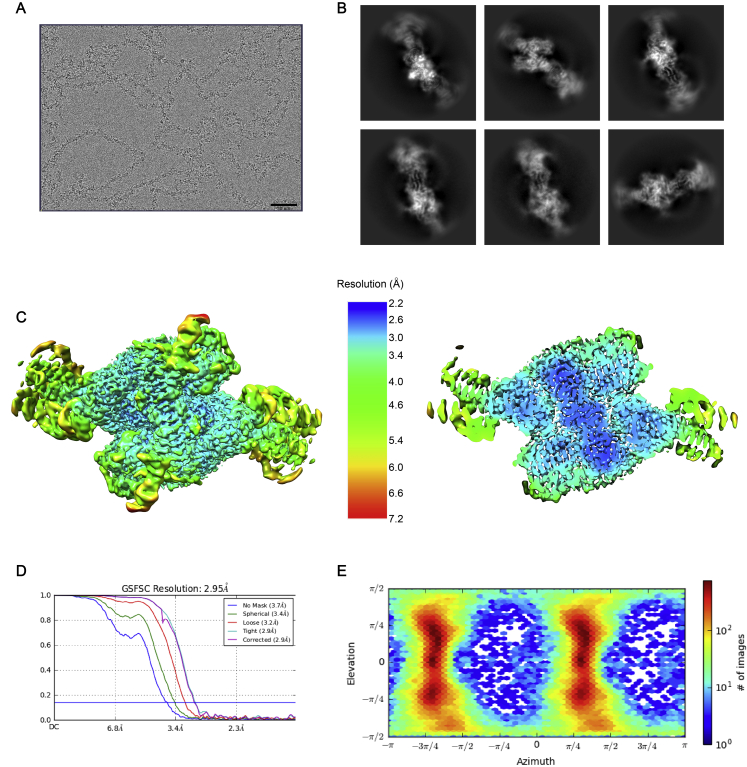
Image processing was performed using CryoSPARC software v2.9 ( Punjani et al., 2017 ). A total of 3242 acquired movies were subjected to patch motion correction, followed by patch CTF estimation. Of these, 2745 images showing CTF fit resolution better than 3.5 Å were selected for further processing. Initial particle picking was done using the Blob Picker function on a subset of 200 micrographs. About 32,000 particles were extracted, 2D classified into 50 classes, and 15 class averages with high resolution and visible secondary structure were used as templates for automated particle picking from the entire dataset. In total 987,943 particles were extracted and subjected to multiple rounds of 2D classification, in which 2D classes were selected for further processing based on the appearance of secondary structure elements, resulting in a dataset of 84,970 particles. These particles were used for ab initio 3D reconstruction, followed by homogeneous 3D refinement, which resulted in a refined map at 3.2 Å resolution. To extract more and better particles from the micrographs, 50 equally spaced re-projections of the new reconstruction were used as templates for another round of automated particle picking, resulting in 1,430,962 picked particles. The new dataset was, similarly, subjected to multiple rounds of 2D classifications, retaining classes with well-resolved features, and 293,080 particles were retained and used for 3D refinement. Subsequently, 3D heterogeneous refinement into 3 classes was performed, and one class, consisting of 178,136 particles, which showed the highest resolution, was homogeneously refined with C2 symmetry to 2.95 Å resolution. The final map was subjected to local resolution estimate and filtered accordingly. To generate 2D classes and reconstructions including multiple beads, particles were re-extracted with larger box sizes. The two-bead map shown in Figures S6 C, S7 B, and S7C was refined to 3.95 Å resolution without symmetry imposed. Model building, refinement, and analysis The previously reported MUC2 D3 dimer (PDB ID 6RBF ) was fitted manually into the single-bead cryo-EM map, and the rest of the model was manually built in Coot (Emsley et al., 2010). Each β sandwich VWD and helical-bundle C8 subdomain of regions D1 (residues 35-291 as numbered according to the mucin 2 precursor, Uniprot Q02817 ; domain boundaries are according to Nilsson et al. [2014 ]), D2 (residues 388-655), and D3 (residues 858-1117) ( Figure 1 C) were readily built into the structure model. In addition, density was evident for the TIL1 and E1 subdomains (residues 292-387) linking D1 to D2, as well as for most of TIL2 (residues 656-719) and E' (residues 822-857), which contribute to bridging D2 and D3. Partial density was also observed for the remainder of the D2-D3 bridge formed by E2 (residues 720-756) and TIL' (residues 757-821). The entire bridge between D2 and D3 was visible in the two-bead map ( Figures S7 B and S7C). The position of the CysD1 domain was clear in the one-bead map. The trajectory of the PTS region linking D3 with CysD1 could be seen in each map but not reliably modeled. The final model refined against the 2.95 Å map included MUC2 amino acids 35 to 721, 724 to 749, 780 to 793, 801 to 1197, and 1302 to 1391. The model was refined by cycles of real-space refinement using Phenix ( Adams et al., 2010 ) and manual rebuilding in Coot. The structure was analyzed and structure figures were generated using Pymol ( DeLano, 2002 ). Model geometry was assessed using Molprobity ( Chen et al., 2010 ).
VWF tubule modeling
A homology model of the VWF repeat unit was generated by a combination of known VWF structure fragments and use of the Modeller software ( Webb and Sali, 2016 ). The crystallographic structure of a monomeric mutant of the VWF D3 region (PDB code 6N29 ) ( Dong et al., 2019 ) was divided into three segments spanning residues 764 to 827, 828 to 862, and 864 to 1241. Each segment was positioned by least-squares fitting using Coot onto the appropriate region of the MUC2 bead. A homology model was generated using Modeller for the D1-D2 segment of VWF (residues 33 to 692). From this composite model, the C2-symmetry-related portion of the VWF repeating unit was generated. Modeling of the VWF tubule was done based on the published low-resolution reconstruction of the tubule ( Huang et al., 2008 ). The VWF repeat unit model was positioned with its two-fold axis perpendicular to the tubule axis and at a distance consistent with the reported inner and outer diameters of the tubule ( Huang et al., 2008 ). Helical symmetry was applied with 85.6° rotation and 26.2 Å rise, using Chimera ( Pettersen et al., 2004 ). Rotations around the two-fold symmetry axis of the bead were tested in 2° steps to achieve the closest match with domain contours on the inner and outer faces of the low-resolution reconstruction of the VWF tubule ( Huang et al., 2008 ), as the original maps were not available from the authors or from public repositories.
Glycopeptide analysis
Four hundred μl of 3 mg/ml MUC2 D1D2D3CysD1 was placed in a 10 kD molecular mass cut-off dialysis bag together with 10 μM StcE and dialyzed for 4 days at room temperature against 10 mL of Milli-Q water. The dialysate, containing StcE-generated glycopeptides, was then collected, lyophilized, and resuspended in 3% acetonitrile with 0.1% formic acid. Samples were analyzed using a nanoAcquity (Waters) nanoLC coupled to an Orbitrap Fusion Lumos (ThermoFisher) system. Resuspended glycopeptides were loaded onto a Symmetry C18 trap column (0.3 × 25 mm, 5 μm particle size, 100 Å pore size, Waters) and separated on a nanoEase HSS T3 (C18, 0.075 × 250 mm, 1.8 μm particle size, 100 Å pore size, Waters) using a gradient of 4 to 30% solvent B (acetonitrile, 0.1% formic acid) over 50 min. Data were acquired in Data Dependent Acquisition (DDA) mode, with primary scans set at 120,000 resolution and scan range of 150-1650 m/z. MS2 scans were performed on precursors with charge states 1-8, using 30 s dynamic exclusion. Each precursor underwent two separate MS2 events, either with higher-energy collision dissociation (HCD) at 30 normalized collision energy (NCE) or electron-transfer/higher-energy collision induced dissociation (EThcD) with HCD set at 15 NCE. Both events used isolation window of 1 m/z, 15,000 resolution, and first mass set to 100 m/z. DDA cycle was set to 3 s. Downstream analysis was performed using MetaMorpheus software ( Solntsev et al., 2018 ) with the O-Pair search function ( https://www.biorxiv.org/content/10.1101/2020.05.18.102327v1.full ). Search was performed against the MUC2 short PTS region protein sequence, using the O-glycan library in MetaMorpheus supplemented with glycan compositions from ( Larsson et al., 2011 ). Results were validated manually. CysD1 crystallization and structure solution CysD1 plate-like crystals appeared by the hanging drop vapor diffusion method over a well solution containing 100 mM citrate-phosphate buffer, pH 4.4, with 15% ethanol and 1% PEG 1K within 12 hr. For cryo protection, a crystal was transferred briefly to a drop containing 20% glycerol, 15% ethanol, 3% PEG 1K and 50 mM citrate-phosphate buffer, pH 4.4, mounted in a loop, and flash-frozen in a 100 K nitrogen stream. A single dataset of 690° continuous phi measurement with 1° frames was collected at a wavelength of 1.54 Å on a Rigaku MicroMax-007HF X-ray generator equipped with VariMax optics Cu-HF and R-Axis IV++ image plate detector. The CysD1 structure was solved by sulfur single-wavelength anomalous diffraction (SAD) using the SHELX program ( Sheldrick, 2015 ). The initial auto-built model was then iteratively rebuilt and refined using Coot and Phenix. A composite simulated annealing omit map was produced and inspected to ensure the accuracy of the final model. Model geometry was assessed using Molprobity, and no Ramachandran outliers were detected.
Computational methods for full-length MUC2 simulations
A representation of a filament composed of 7 consecutive MUC2 beads was generated using the atomic coordinates and rotation/translation matrix obtained from the D1D2D3CysD1 cryo-EM structure. Eight disordered tail regions were appended to the ends of specific CysD1 domains as described below. For simplicity, the CysD2 domain was not modeled structurally but was included within the 2938 amino acids of disordered tail polypeptide, and the set of carboxy-terminal domains following the long disordered segment was represented as a sphere with radius 40 Å. Spheres of tails appended to beads i and i+3 were linked to one another to represent dimerization of CTCK domains. Thus, beads 1 and 4, 2 and 5, 3 and 6, and 4 and 7 were linked. With this design, the central bead 4 was modeled with all tails in its vicinity present: two tails were appended to its two CysD1 domains, and two other tails (connecting beads 2 with 5 and 3 with 6) passed over it. The conformational ensemble of the modeled MUC2 tails was studied using coarse-grained simulations. Due to the high complexity of this system (in both size and plasticity), each amino acid was represented by a single sphere located at the position of the Cα atom, and the head regions of the filaments were kept static. The disordered tails were modeled as flexible excluded-volume polymers with enthalpic contributions from interactions between hydrophobic residues ( i.e ., isoleucine and valine), contributing to compaction of the chain. These interactions were modeled using a Lennard-Jones potential with sigma = 0.6 nm and epsilon = 1. To account for the abundance of prolines, conformational preferences were introduced into the model of the polypeptide: if at least 2 out of 4 consecutive Cα atoms belonged to prolines, the dihedral angle defined by those 4 atoms was constrained to 260°. The bulk of glycan modifications was modeled by varying the excluded volume (repulsive) term, which was assigned values of 4, 10 or 15 Å. The tail model was constructed in a fully extended conformation, which was first subjected to pulling forces to achieve a more compact conformation from which further condensation could be driven by intra- and inter-molecular hydrophobic interactions. To study the system at equilibrium, simulations were performed at constant temperature T = 100 (reduced units) for 100 ns. The coarse-grained Cα-based model was generated using SMOG2 ( Noel et al., 2016 ). The dynamics of the system were modeled by the Langevin equation, as implemented in GROMACS 2018.3 ( Pronk et al., 2013 ).
Preparation and imaging of colon sections
Mouse distal colons were removed, cut into 2-3 mm segments, and fixed in Karnovsky fixative (4% paraformaldehyde (PFA), 2% glutaraldehyde in 0.1 M cacodylate buffer, pH 7.4, containing 5 mM CaCl 2 ) overnight at room temperature. Samples were then washed 3 times in 0.1 M sodium cacodylate buffer and incubated for 1 hr with 1% osmium tetroxide, 0.5% K 2 Cr 2 O 7 , and 0.5% K 4 [Fe(CN) 6 ]·3H 2 O in 0.1 M sodium cacodylate buffer. Following further washing with cacodylate buffer followed by double-distilled water, samples were incubated for 30 min with 2% uranyl acetate dissolved in water. Sections were washed with water, dehydrated, infiltrated with Epon, and finally embedded in Epon to generate blocks. Thin sections were prepared, placed on grids, and imaged on a Tecnai T12 electron microscope.
Computational methods for full-length MUC2 simulations
A representation of a filament composed of 7 consecutive MUC2 beads was generated using the atomic coordinates and rotation/translation matrix obtained from the D1D2D3CysD1 cryo-EM structure. Eight disordered tail regions were appended to the ends of specific CysD1 domains as described below. For simplicity, the CysD2 domain was not modeled structurally but was included within the 2938 amino acids of disordered tail polypeptide, and the set of carboxy-terminal domains following the long disordered segment was represented as a sphere with radius 40 Å. Spheres of tails appended to beads i and i+3 were linked to one another to represent dimerization of CTCK domains. Thus, beads 1 and 4, 2 and 5, 3 and 6, and 4 and 7 were linked. With this design, the central bead 4 was modeled with all tails in its vicinity present: two tails were appended to its two CysD1 domains, and two other tails (connecting beads 2 with 5 and 3 with 6) passed over it. The conformational ensemble of the modeled MUC2 tails was studied using coarse-grained simulations. Due to the high complexity of this system (in both size and plasticity), each amino acid was represented by a single sphere located at the position of the Cα atom, and the head regions of the filaments were kept static. The disordered tails were modeled as flexible excluded-volume polymers with enthalpic contributions from interactions between hydrophobic residues ( i.e ., isoleucine and valine), contributing to compaction of the chain. These interactions were modeled using a Lennard-Jones potential with sigma = 0.6 nm and epsilon = 1. To account for the abundance of prolines, conformational preferences were introduced into the model of the polypeptide: if at least 2 out of 4 consecutive Cα atoms belonged to prolines, the dihedral angle defined by those 4 atoms was constrained to 260°. The bulk of glycan modifications was modeled by varying the excluded volume (repulsive) term, which was assigned values of 4, 10 or 15 Å. The tail model was constructed in a fully extended conformation, which was first subjected to pulling forces to achieve a more compact conformation from which further condensation could be driven by intra- and inter-molecular hydrophobic interactions. To study the system at equilibrium, simulations were performed at constant temperature T = 100 (reduced units) for 100 ns. The coarse-grained Cα-based model was generated using SMOG2 ( Noel et al., 2016 ). The dynamics of the system were modeled by the Langevin equation, as implemented in GROMACS 2018.3 ( Pronk et al., 2013 ).
📊 Figures
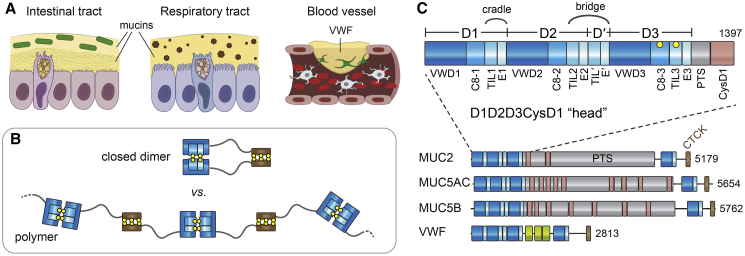
Figureu00a01
Mucins and von Willebrand Factor (A) Functions of mucins and VWF. Green rods, bacteria of the intestinal microbiome; brown hexagons, particulate matter in the respiratory tract; green cells associated...
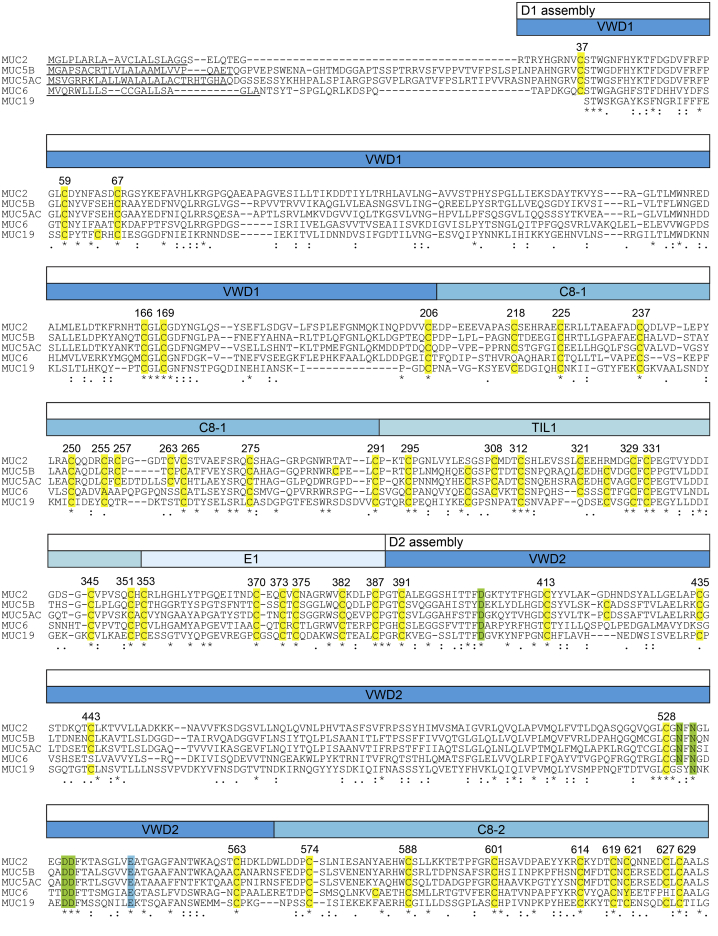
Figureu00a0S1
Amino Acid Sequences of Gel-Forming Mucins, Related to Figures 1 and 3 T-coffee ( Notredame etu00a0al., 2000 ) was used to align the amino-terminal regions of human Mucin 2 (MUC2), Mucin 5B (MUC5B), M...
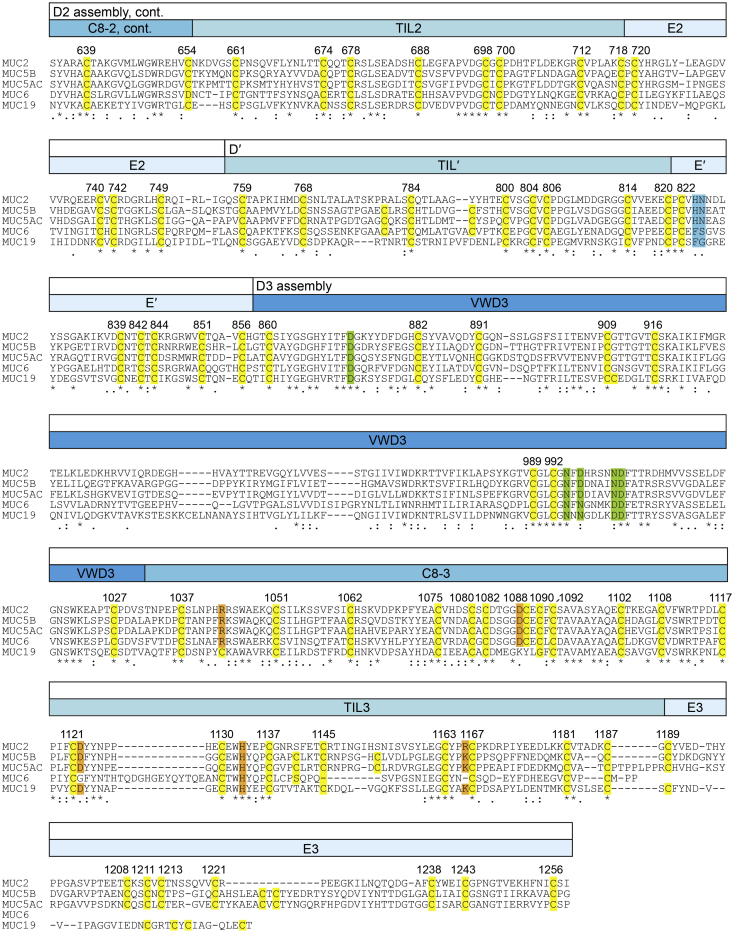
Figureu00a0S2
Amino Acid Sequences of Gel-Forming Mucins, Related to Figures 1 , 3 , and 4 Continuation of the alignment presented in Figureu00a0S1. In green are calcium-binding residues in VWD3, and in blue are ch...
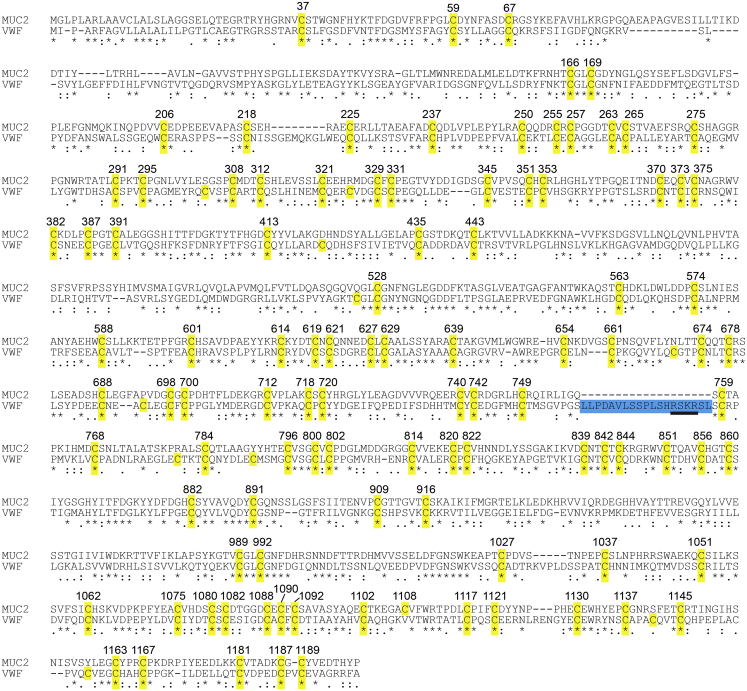
Figureu00a0S3
Amino Acid Sequence Alignment of MUC2 and VWF, Related to Figures 1 and 5 T-coffee was used to align the amino-terminal regions of human Mucin 2 (MUC2) and human von Willebrand factor (VWF). Cysteines...
Figureu00a02
Filament Formation by the MUC2 Head (A) Filament formation was visualized by negative stain EM for MUC2 D1D2D3CysD1 following incubation at pH 6.2 with 10u00a0mM CaCl 2 . Arrowheads point out beaded f...
Figureu00a0S4
Cryo-EM Analysis of the MUC2 Filament, Related to Figureu00a03 (A) Representative dose- and motion-corrected micrograph. Scale bar is 50u00a0nm. Despite the frequent kinks in the chains, a predominant...
Figureu00a03
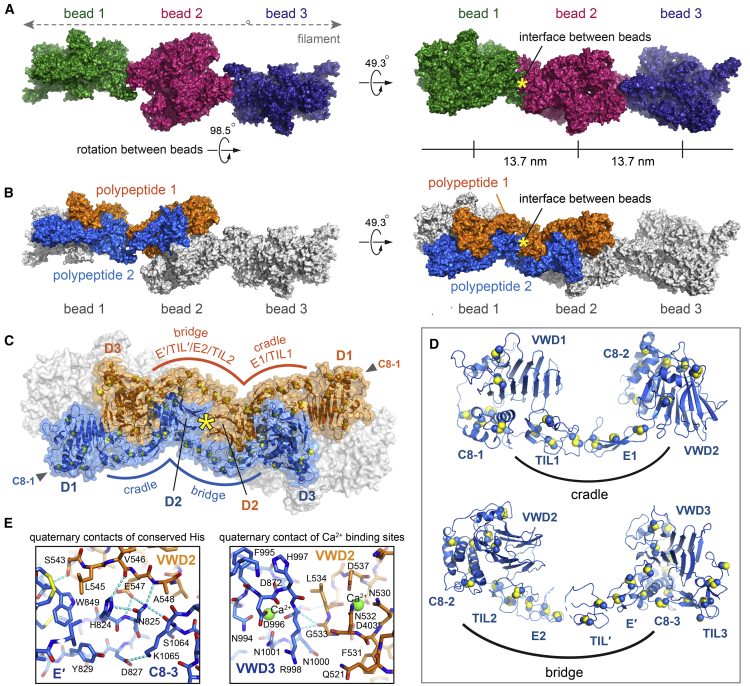
Structure of the MUC2 Head Filament (A) Three beads in the MUC2 filament are shown with rotation and translation indicated. The asterisk in this and other panels marks a two-fold rotational symmetry a...
Figureu00a0S5
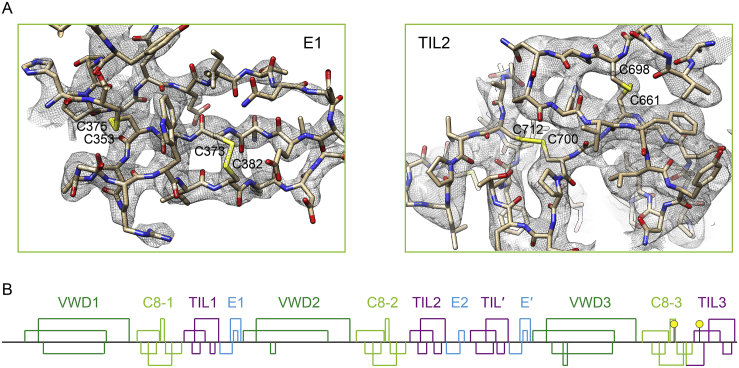
Mapping of MUC2 Disulfides, Related to Figureu00a03 (A) Representative regions of the one-bead map, corresponding to the E1 and TIL2 domains, are shown together with the refined model. Disulfide bonde...
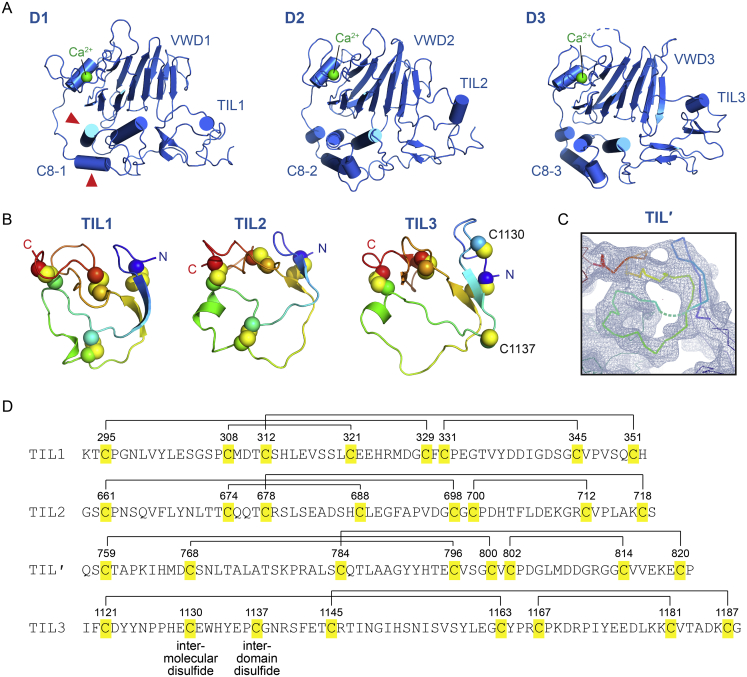
Figureu00a0S6
Structures of D Assemblies and TIL Modules, Related to Figureu00a03 (A) The D1, D2, and D3 assemblies of MUC2 are presented in the same orientation after structural alignment using Pymol ( DeLano, 200...
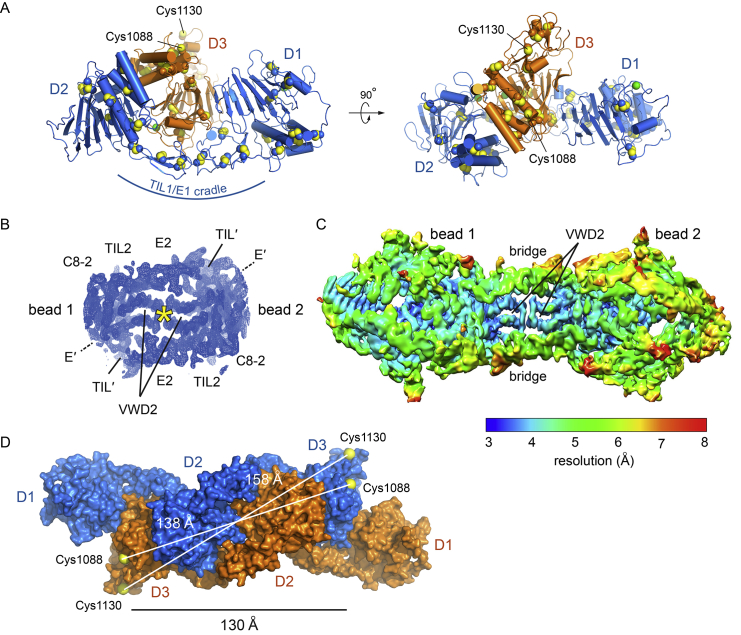
Figureu00a0S7
Cradle and Bridge, Related to Figureu00a03 (A) The D1-D2 region from one polypeptide (blue) is shown interacting with the D3 region from another polypeptide (orange) as observed in the beaded filament...
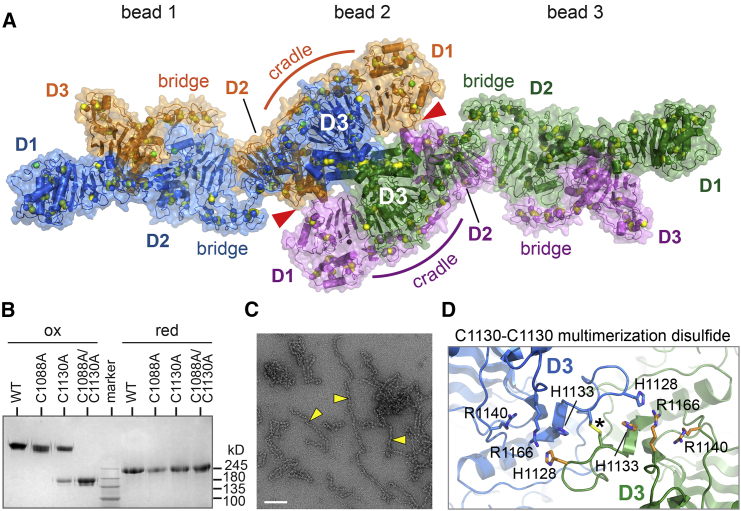
Figureu00a04
Intermolecular Disulfide Bonding in the MUC2 Filament (A) The MUC2 bead is formed by the interaction of two intertwined polypeptide pairs (pair 1: blue and orange; pair 2: magenta and green). The gree...
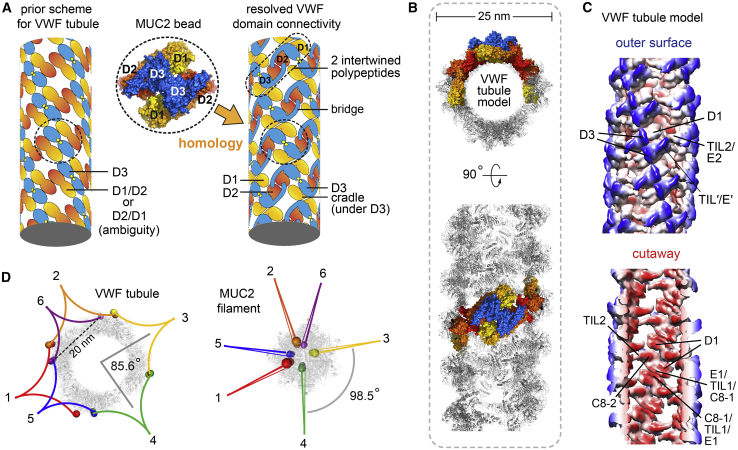
Figureu00a05
Comparison of MUC2 with the VWF Tubule (A) The MUC2 bead structure resolves ambiguities in a VWF tubule model based on low-resolution helical reconstruction ( Huang etu00a0al., 2008 ; Springer, 2014 )...
Figureu00a06
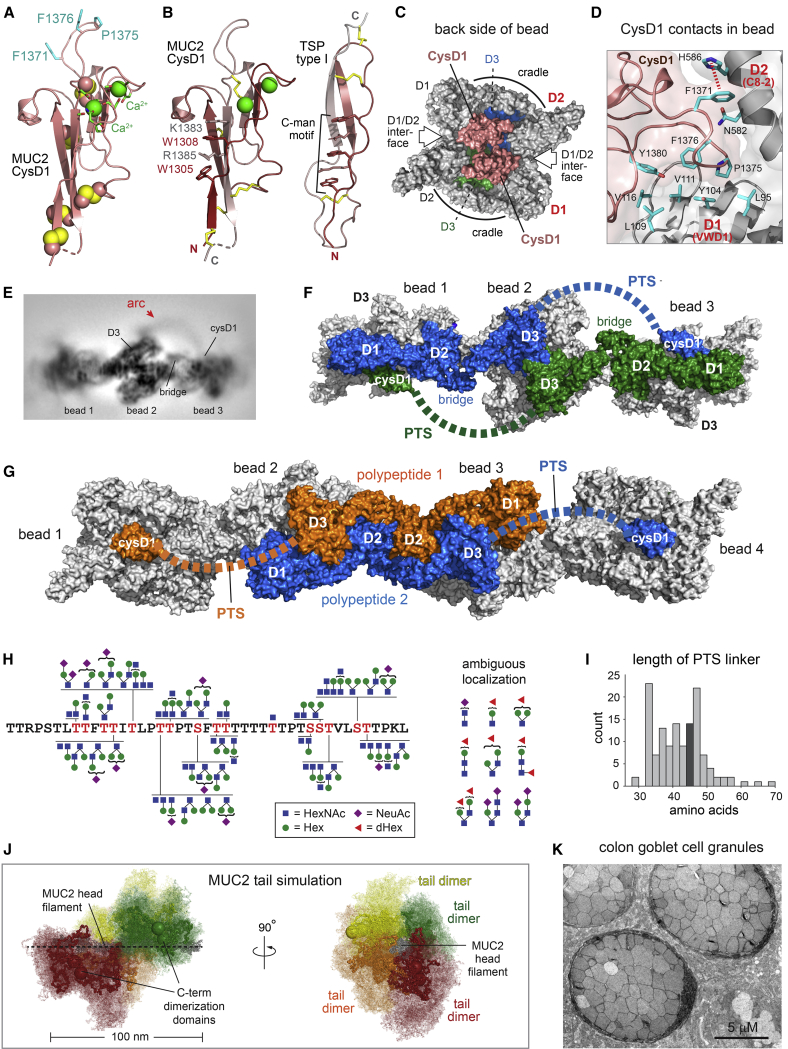
CysD1 Domain Structure, O-Glycosylated PTS Linker, and MUC2 Tail Modeling (A) MUC2 CysD1 domain. Calcium ions (green spheres) are shown at their van der Waals radii and are 7.7u00a0u00c5 apart (see al...
Figureu00a0S8
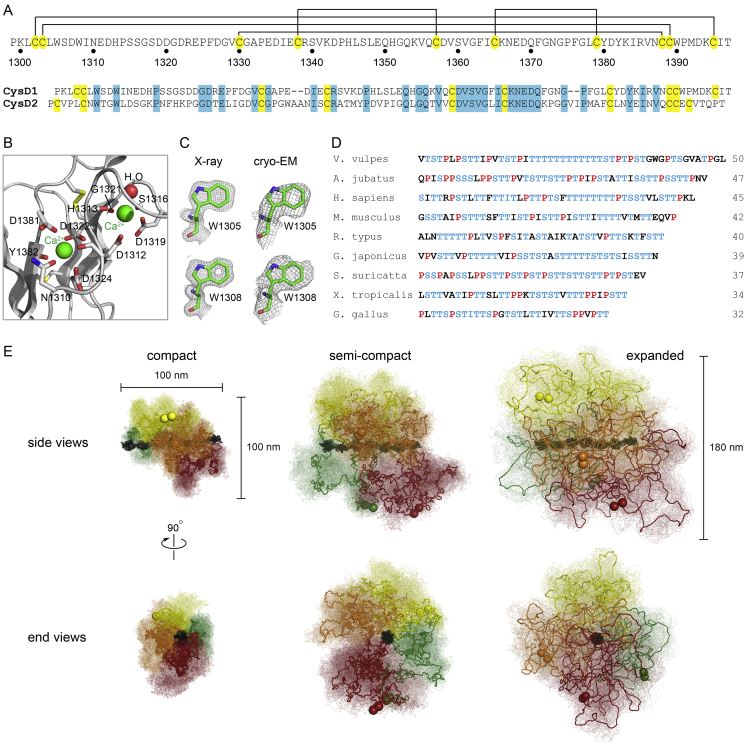
CysD1 Structure and PTS Region Comparison, Related to Figureu00a06 (A) Disulfide map of MUC2 CysD1 and alignment of MUC2 CysD1 and CysD2 sequences. Amino acid numbering corresponds to the MUC2 precurs...
Figureu00a07
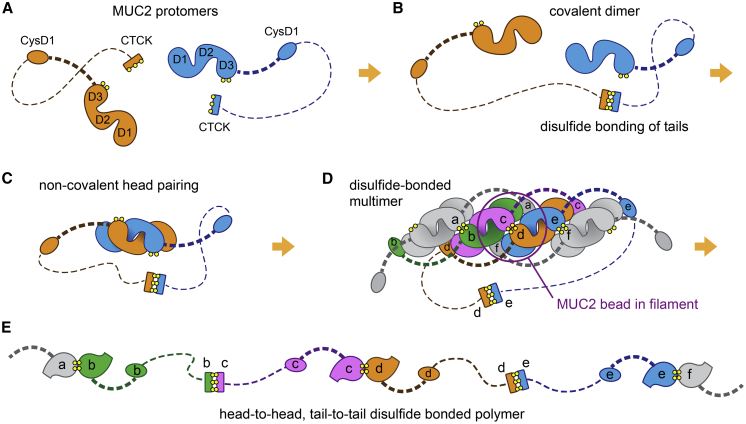
Stepwise Mucin Assembly Mechanism (A) Schematic of the MUC2 protomer. Dashed lines correspond to PTS regions (not drawn to scale); thicker dashed line represents the ~40 amino-acid segment between D3 ...
Figure images are served from the NIH/NLM PubMed Central Open Access Subset or Europe PMC; copyright remains with the publishers and authors.
💬 Discussion
0 commentsNo comments yet. Be the first to start a discussion!
Leave a Comment