Abstract
AbstractTheDrosophilaegg chamber, whose development is divided into 14 stages, is a well-established model for developmental biology. However, visual stage determination can be a tedious, subjective and time-consuming task prone to errors. Our study presents an objective, reliable and repeatable automated method for quantifying cell features and classifying egg chamber stages based on DAPI images. The proposed approach is composed of two steps: 1) a feature extraction step and 2) a statistical modeling step. The egg chamber features used are egg chamber size, oocyte size, egg chamber ratio and distribution of follicle cells. Methods for determining the on-site of the polytene stage and centripetal migration are also discussed. The statistical model uses linear and ordinal regression to explore the stage-feature relationships and classify egg chamber stages. Combined with machine learning, our method has great potential to enable discovery of hidden developmental mechanisms.
🔬 Techniques
🔭 Microscopes
🧬 Organisms
✨ Fluorophores
🧪 Sample Preparation
🏭 Microscope Brands
🧪 Reagent Suppliers
💻 Software Details
💻 Code & Software
💾 Data Repositories
🏛️ Research Organizations (ROR)
Affiliated research institutions:
📋 Methods
Experimental Applications Stage identification of the appearance of Broad expression
During egg chamber development, a germline ligand, Delta, induces somatic Notch signaling from stage 5 2 , and Notch signaling directly regulates the expression of its downstream target, broad ( br ), in follicle cells. During the process, the N icd -Su(H)-Mam trimeric complex directly binds to the Su(H) binding site located at the br enhancer, brE, region 5 . Br protein level is highly upregulated at stage 6, yet it has been reported that Br could be detected at low dosage as early as stage 5 based on egg chamber morphology 5 . To confirm these findings, we examined some validated stage-5 egg chamber images by our feature extraction algorithm, and found that a few egg chambers (20%, n = 10) did not show Br expression ( Fig. 7A ), while a majority (80%, n = 10) had early Br presence ( Fig. 7B ), confirming the existence of Br from stage 5, and suggesting Br is very sensitive to Notch signaling. Confirmation of egg chambers with germline Delta mutation entering midoogenesis The expression pattern of Br could be detected as early as stage 5, and later on, and is usable as one marker of midoogenesis (post-stage 5). However, in germline Delta clones, Br expression was suppressed 5 . That the expression of Br was no longer a reliable marker to label post-stage 5 egg chambers, posed a problem, and this problem applies to other cell-stage markers as well. Our toolbox provides an alternative approach to determine accurate stages. For instance, in Fig. 7C , while there was no detectable Br in the egg chamber within the germline Delta clones, our data extracted from DAPI images based on the computational model successfully predicted that this egg chamber was actually in stage 8 ( Fig. 7C ), which belongs to midoogenesis 53 , consistent with the general germline cell morphology of the egg chamber. Clarification of the cease of mitosis in stage-6 egg chambers During oogenesis, the follicle cells sequentially undergo three distinctive cell cycle programs: the mitotic cycle (early oogenesis), endocycle (midoogenesis), and gene amplification (late oogenesis) 53 . Some researchers considered that the mitotic cycle includes stages 1–6, endocycle stages 7–10A, and gene amplification stages 10B-13 3 4 10 34 54 , while others believed the mitotic cycle only includes stages 1–5 1 2 38 . We applied this computational method to egg chamber images that were stained with the mitotic marker, PH3, to detect mitosis in follicle cells. We found that stage-5 egg chambers (100%, n = 17) had PH3 staining ( Fig. 7D ), suggesting follicle cells still underwent the mitotic cycle at that stage. Consistently, stage-6 egg chambers (100%, n = 15) showed the absence of PH3 staining ( Fig. 7E ). It seems clear that mitosis ceases from stage 6, and therefore endocycle should be considered to start from stage 6 as well. Notch signaling is known to appear from stage 5, and induce the mitotic cycle/endocycle (M/E) switch. However, its activation receives gradual response. Some downstream genes like br respond early 5 , others respond later, including Cut 3 . Egg chambers take time to coordinate signaling output to induce the M/E switch, and the differentiation of the follicle cells becomes apparent from stage 7 2 6 . This complex coordination process might start the M/E switch in the follicle cells at stage 5, successfully inhibit mitosis at stage 6, and fully enter in endocycle and induce differentiation at stage 7. Therefore, we propose the M/E switch occurs at stages 6/7.
Show full methods section
Experimental Applications Stage identification of the appearance of Broad expression
During egg chamber development, a germline ligand, Delta, induces somatic Notch signaling from stage 5 2 , and Notch signaling directly regulates the expression of its downstream target, broad ( br ), in follicle cells. During the process, the N icd -Su(H)-Mam trimeric complex directly binds to the Su(H) binding site located at the br enhancer, brE, region 5 . Br protein level is highly upregulated at stage 6, yet it has been reported that Br could be detected at low dosage as early as stage 5 based on egg chamber morphology 5 . To confirm these findings, we examined some validated stage-5 egg chamber images by our feature extraction algorithm, and found that a few egg chambers (20%, n = 10) did not show Br expression ( Fig. 7A ), while a majority (80%, n = 10) had early Br presence ( Fig. 7B ), confirming the existence of Br from stage 5, and suggesting Br is very sensitive to Notch signaling. Confirmation of egg chambers with germline Delta mutation entering midoogenesis The expression pattern of Br could be detected as early as stage 5, and later on, and is usable as one marker of midoogenesis (post-stage 5). However, in germline Delta clones, Br expression was suppressed 5 . That the expression of Br was no longer a reliable marker to label post-stage 5 egg chambers, posed a problem, and this problem applies to other cell-stage markers as well. Our toolbox provides an alternative approach to determine accurate stages. For instance, in Fig. 7C , while there was no detectable Br in the egg chamber within the germline Delta clones, our data extracted from DAPI images based on the computational model successfully predicted that this egg chamber was actually in stage 8 ( Fig. 7C ), which belongs to midoogenesis 53 , consistent with the general germline cell morphology of the egg chamber. Clarification of the cease of mitosis in stage-6 egg chambers During oogenesis, the follicle cells sequentially undergo three distinctive cell cycle programs: the mitotic cycle (early oogenesis), endocycle (midoogenesis), and gene amplification (late oogenesis) 53 . Some researchers considered that the mitotic cycle includes stages 1–6, endocycle stages 7–10A, and gene amplification stages 10B-13 3 4 10 34 54 , while others believed the mitotic cycle only includes stages 1–5 1 2 38 . We applied this computational method to egg chamber images that were stained with the mitotic marker, PH3, to detect mitosis in follicle cells. We found that stage-5 egg chambers (100%, n = 17) had PH3 staining ( Fig. 7D ), suggesting follicle cells still underwent the mitotic cycle at that stage. Consistently, stage-6 egg chambers (100%, n = 15) showed the absence of PH3 staining ( Fig. 7E ). It seems clear that mitosis ceases from stage 6, and therefore endocycle should be considered to start from stage 6 as well. Notch signaling is known to appear from stage 5, and induce the mitotic cycle/endocycle (M/E) switch. However, its activation receives gradual response. Some downstream genes like br respond early 5 , others respond later, including Cut 3 . Egg chambers take time to coordinate signaling output to induce the M/E switch, and the differentiation of the follicle cells becomes apparent from stage 7 2 6 . This complex coordination process might start the M/E switch in the follicle cells at stage 5, successfully inhibit mitosis at stage 6, and fully enter in endocycle and induce differentiation at stage 7. Therefore, we propose the M/E switch occurs at stages 6/7.
Materials and Methods Fly strains and genetics
The following fly strains were used: hsFLP;;FRT82Bubi- RFP , FRT82BDl rev10 /TM6B (amorphic allele) 5 . w 1118 was used as a wild-type control, cultured with standard Bloomington medium, and fed with yeast paste two days before dissection. For FLP/FRT clone induction 56 57 and slide preparation, previously described procedures were followed 3 58 .
Immunohistochemistry and image acquirement
Immunohistochemistry and image acquisition were carried out as previously described 3 . The following primary and secondary antibodies were used: mouse anti-Br-Core (25E9) (1:30; Development Studies Hybridoma Bank, USA), rabbit anti-PH3 (1:200; Millipore), Alexa Fluor secondary antibodies (1:400; Invotrogen). DAPI (1:500; Invitrogen) was applied to stain nuclei. Images were acquired with a Zeiss LSM 510 confocal microscope. The DAPI images should be single cross sections in the middle plane, and represents the largest area size. Cropping of a single egg chamber was processed in Image J.
Image processing methods
Quantitative features were extracted from DAPI images using scripts written in MATLAB (MathWorks, MA, USA). The egg chamber area was measured as the convex hull of the cells belonging to that sample. Principle component analysis on the pixel locations within the egg chamber was used to identify the P-A axis. Egg chamber ratio was quantified by the ratio of the deviation along major and minor axes. We used this measurement instead of the absolute height and width of the egg chamber to accommodate possible distortion of the egg chamber during image preparation and processing. For late stages, oocyte size boundary was identified along the middle axis passing through the midsagittal plane image of the egg chamber by aligning with the direction of P-A axis. The follicle cells and nurse cells were separated by the combination procedure of using egg chamber boundary and connected regions in the image. The distribution of the follicle cells was measured by 12 dimensional vectors representing the quantity of follicle cells within 12 equally-spaced sectors along the 360 whole circle discretization started from the anterior end. Uniformity was measured by ∆-distance between the learned distribution and uniform distribution. A watershed algorithm was applied on the separated nurse cells to detect blob-like chromosomes during the late S phases at stage 4. Detection of possible centripetal cell migration was focused on the nurse cell/oocyte boundary region. The feature extraction algorithm has been implemented and tested on Matlab 2013b and newer. This toolbox is deposited at Github for free download ( https://github.com/qx0731/Morphological-features-from-DAPI-image-for-egg-chamber-stage-identification ).
Quantitative methods
The egg chamber size was measured in μm 2 . Oocyte size was measured in relative area as a percentage of the whole egg chamber size. To explore the relationship between the egg chamber features of different stages, we examined three features: egg chamber size, oocyte size and egg chamber ratio. Boxplot and linear regression were conducted on egg chamber stage and the three features, respectively. DAPI images (n = 172) ranging from stage 2 to stage 12 were used in the experiments. Ordinal regression was applied to predict an ordinal dependent variable given one or more independent variables. In this paper, we conducted three ordinal regressions, each addressing one feature with respect to egg chamber stage. Classification boundaries were computed for each feature respectively. To evaluate the follicle cell distribution of stage 8 and stage 9, a two-samples t -test was used to show the significant difference between these two stages, and one follicle cell classification cutoff for stage 8 and 9 was also learned by finding the intercept of two fitted Gaussian models.
Image processing methods
Quantitative features were extracted from DAPI images using scripts written in MATLAB (MathWorks, MA, USA). The egg chamber area was measured as the convex hull of the cells belonging to that sample. Principle component analysis on the pixel locations within the egg chamber was used to identify the P-A axis. Egg chamber ratio was quantified by the ratio of the deviation along major and minor axes. We used this measurement instead of the absolute height and width of the egg chamber to accommodate possible distortion of the egg chamber during image preparation and processing. For late stages, oocyte size boundary was identified along the middle axis passing through the midsagittal plane image of the egg chamber by aligning with the direction of P-A axis. The follicle cells and nurse cells were separated by the combination procedure of using egg chamber boundary and connected regions in the image. The distribution of the follicle cells was measured by 12 dimensional vectors representing the quantity of follicle cells within 12 equally-spaced sectors along the 360 whole circle discretization started from the anterior end. Uniformity was measured by ∆-distance between the learned distribution and uniform distribution. A watershed algorithm was applied on the separated nurse cells to detect blob-like chromosomes during the late S phases at stage 4. Detection of possible centripetal cell migration was focused on the nurse cell/oocyte boundary region. The feature extraction algorithm has been implemented and tested on Matlab 2013b and newer. This toolbox is deposited at Github for free download ( https://github.com/qx0731/Morphological-features-from-DAPI-image-for-egg-chamber-stage-identification ).
Quantitative methods
The egg chamber size was measured in μm 2 . Oocyte size was measured in relative area as a percentage of the whole egg chamber size. To explore the relationship between the egg chamber features of different stages, we examined three features: egg chamber size, oocyte size and egg chamber ratio. Boxplot and linear regression were conducted on egg chamber stage and the three features, respectively. DAPI images (n = 172) ranging from stage 2 to stage 12 were used in the experiments. Ordinal regression was applied to predict an ordinal dependent variable given one or more independent variables. In this paper, we conducted three ordinal regressions, each addressing one feature with respect to egg chamber stage. Classification boundaries were computed for each feature respectively. To evaluate the follicle cell distribution of stage 8 and stage 9, a two-samples t -test was used to show the significant difference between these two stages, and one follicle cell classification cutoff for stage 8 and 9 was also learned by finding the intercept of two fitted Gaussian models.
📊 Figures
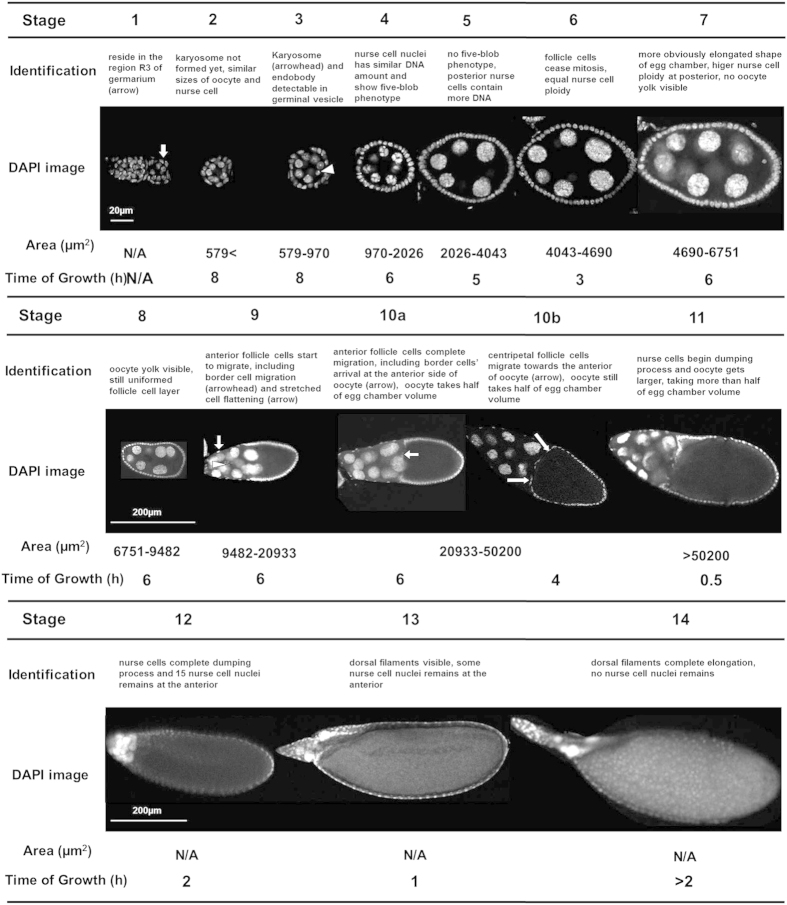
Figure 1
Identification of 14 stages of Drosophila egg chamber.
Characteristics of different egg chamber stages.
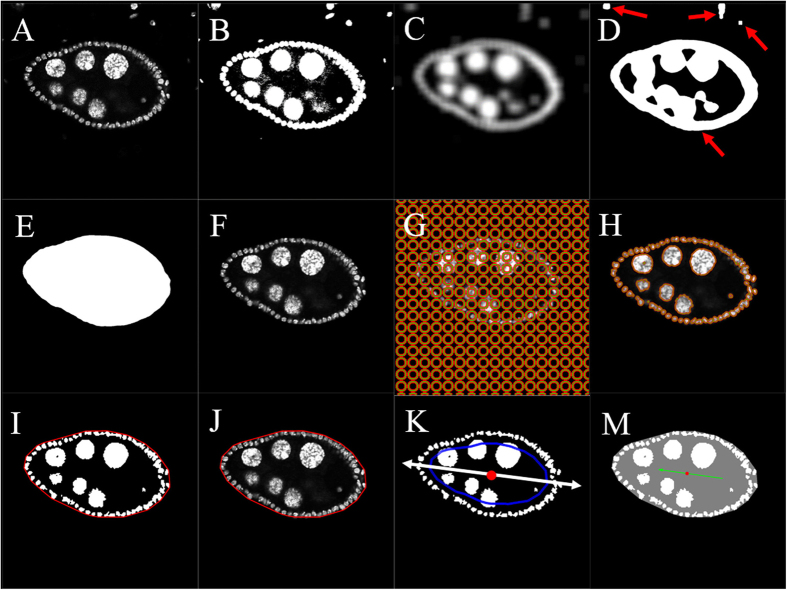
Figure 2
Extraction procedure for egg chamber size, egg chamber ratio and egg chamber orientation.
( A ) Original image. ( B ) First post-thresholding image using Otsuu2019s method. ( C ) Image after average filter. ( D ) Second post-thresholding image using Otsuu2019s method on ( C ). There were f...
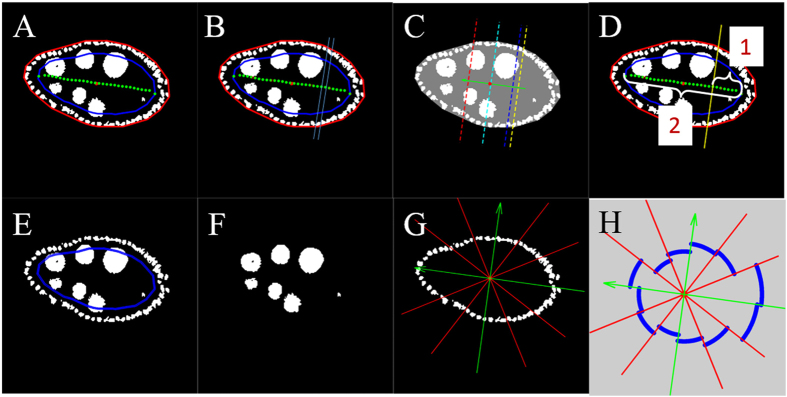
Figure 3
Determination of oocyte size and follicle cell distribution.
( A ) Constructed middle axis (green curve) in binary image along posterior-anterior direction with each point numerically ordered along P-A direction. ( B ) One example of band (in cyan). The boundar...
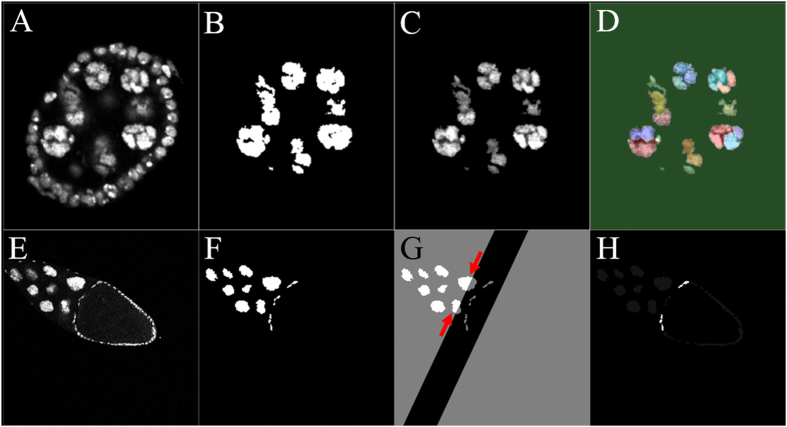
Figure 4
Detection of blob-like chromosomes in polytene nuclei and centripetal cell migration.
( A ) Original image of a stage-4 egg chamber. ( B ) Detected mask of nurse cells. ( C ) Detected nurse cells in original intensities. ( D ) Watershed algorithm output. Each nurse cell had been furthe...
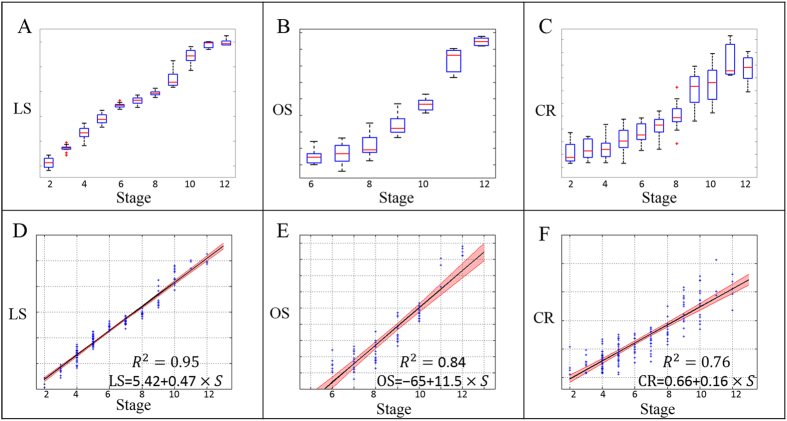
Figure 5
Boxplot and regression analysis.
Boxplot showed the medians and dispersions of samples within each stage group; regression analysis modeled the relationship between stages and feature. ( A ) Boxplot of logarithm of egg chamber size (...
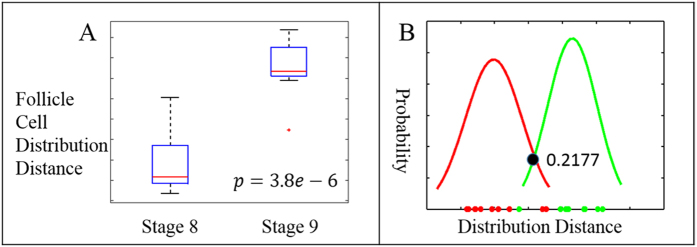
Figure 6
Analysis of follicle cell distribution distance between stage 8 and 9.
( A ) Boxplot of follicle cell distribution distance of stage 8 and 9. Two-sample t u2013test gives significant value p <u20090.000004. ( B ) Fitted Gaussian curves of follicle cell distribution di...
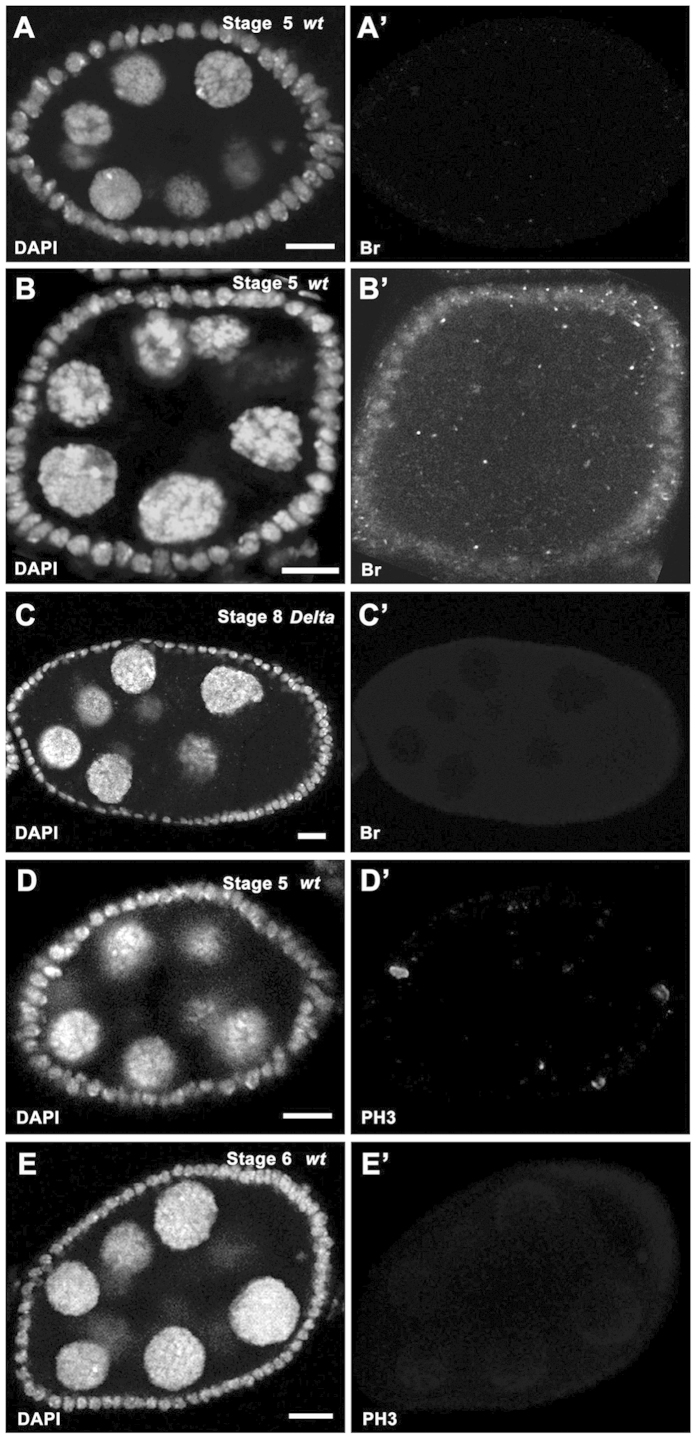
Figure 7
Experimental applications of stage identification.
In all panels, DAPI staining (white in Au2013E ) marks cell nuclei. ( A-Au2019 ) Br expression (white in Au2019 ) was absent in a stage-5 wildtype egg chamber (egg chamber size: 2273.6u2009u03bcm 2 )....
Figure images are served from the NIH/NLM PubMed Central Open Access Subset or Europe PMC; copyright remains with the publishers and authors.
💬 Discussion
0 commentsNo comments yet. Be the first to start a discussion!
Leave a Comment