Abstract
The formation of interstitial axonal branches involves the severing of microtubules at sites where new branches form. Here we wished to ascertain whether basic fibroblast growth factor (bFGF) enhances axonal branching through alterations in proteins involved in the severing of microtubules. We found that treatment of cultured hippocampal neurons with bFGF heightens expression of both katanin and spastin, which are proteins that sever microtubules in the axon. In addition, treatment with bFGF enhances phosphorylation of tau at sites expected to cause it to dissociate from microtubules. This is important because tau regulates the access of katanin to the microtubule. In live-cell imaging experiments, axons of neurons treated with bFGF displayed greater numbers of dynamic free ends of microtubules, as well as greater numbers of short mobile microtubules. Entirely similar enhancement of axonal branching, short microtubule transport, and frequency of microtubule ends was observed when spastin was overexpressed in the neurons. Depletion of either katanin or spastin with siRNA diminished but did not eliminate the enhancement in branching elicited by bFGF. Collectively, these results indicate that bFGF enhances axonal branch formation by augmenting the severing of microtubules through both a spastin-based mode and a katanin-based mode.
🔬 Techniques
🔭 Microscopes
💻 Software
✨ Fluorophores
🧪 Sample Preparation
🔬 Cell Lines
🏭 Microscope Brands
🧪 Reagent Suppliers
📷 Detectors
🔎 Objectives
💻 Software Details
🏛️ Research Organizations (ROR)
Affiliated research institutions:
📋 Methods
Cell Culture and Transfection
Cultures of rat hippocampal neurons were prepared as previously described ( Qiang et al. , 2006 ; Yu et al. , 2008 ). DNA constructs were transfected into the dissociated neurons before plating, using the Amaxa Nucleofector (Amaxa Biosystems, Köln, Germany). After nucleofection, the neurons were plated onto poly- l -lysine–treated glass coverslips as previously described ( Qiang et al. , 2006 ; Yu et al. , 2008 ). For some experiments, the coverslips were also coated with laminin after the polylysine treatment because this was found to promote faster and straighter growth of axons. bFGF (Promega, Madison, WI, Cat. no. 9PIG507) was applied to some of the neuronal cultures at a concentration of 20 ng/ml ( Szebenyi et al. , 2001 ). DNA constructs included enhanced green fluorescent protein (EGFP)-α-tubulin (Clontech, Palo Alto, CA), EGFP-EB3 (provided by Dr. Niels Galjart, Erasmus Medical Center), and mCherry-spastin (prepared in our laboratory). For the spastin construct, we used the M85 isoform of spastin, which is the predominant isoform expressed in developing neurons ( Claudiani et al. , 2005 ; Connell et al. , 2008 ; Mancuso and Rugarli, 2008 ; Solowska et al. , 2008 ; Yu et al. , 2008 ). For controls, we used the appropriate constructs for EGFP or/and mCherry. For studies involving siRNA, neurons were transfected with a pool of four sequences specific to rat spastin, p60-katanin, or p80-katanin (purchased as “smartpools” from Dharmacon, Boulder, CO, Accession numbers: XM-343018 , L-080249-01 , and M-092761-00 , respectively) or with a nonspecific control sequence (Dharmacon, Cat. no. D-001206-03-20). Transfections with the siRNA smartpools were performed using the Nucleofector as previously described ( Yu et al. , 2005 , 2008 ; Qiang et al. , 2006 ). After 2 d in culture to permit protein depletion, the neurons treated with siRNA were replated so that neurites could grow anew in the near absence of the relevant protein targeted by the siRNA.
Show full methods section
Cell Culture and Transfection
Cultures of rat hippocampal neurons were prepared as previously described ( Qiang et al. , 2006 ; Yu et al. , 2008 ). DNA constructs were transfected into the dissociated neurons before plating, using the Amaxa Nucleofector (Amaxa Biosystems, Köln, Germany). After nucleofection, the neurons were plated onto poly- l -lysine–treated glass coverslips as previously described ( Qiang et al. , 2006 ; Yu et al. , 2008 ). For some experiments, the coverslips were also coated with laminin after the polylysine treatment because this was found to promote faster and straighter growth of axons. bFGF (Promega, Madison, WI, Cat. no. 9PIG507) was applied to some of the neuronal cultures at a concentration of 20 ng/ml ( Szebenyi et al. , 2001 ). DNA constructs included enhanced green fluorescent protein (EGFP)-α-tubulin (Clontech, Palo Alto, CA), EGFP-EB3 (provided by Dr. Niels Galjart, Erasmus Medical Center), and mCherry-spastin (prepared in our laboratory). For the spastin construct, we used the M85 isoform of spastin, which is the predominant isoform expressed in developing neurons ( Claudiani et al. , 2005 ; Connell et al. , 2008 ; Mancuso and Rugarli, 2008 ; Solowska et al. , 2008 ; Yu et al. , 2008 ). For controls, we used the appropriate constructs for EGFP or/and mCherry. For studies involving siRNA, neurons were transfected with a pool of four sequences specific to rat spastin, p60-katanin, or p80-katanin (purchased as “smartpools” from Dharmacon, Boulder, CO, Accession numbers: XM-343018 , L-080249-01 , and M-092761-00 , respectively) or with a nonspecific control sequence (Dharmacon, Cat. no. D-001206-03-20). Transfections with the siRNA smartpools were performed using the Nucleofector as previously described ( Yu et al. , 2005 , 2008 ; Qiang et al. , 2006 ). After 2 d in culture to permit protein depletion, the neurons treated with siRNA were replated so that neurites could grow anew in the near absence of the relevant protein targeted by the siRNA.
Microtubule Transport Assay
To image the transport of microtubules in axons, the neurons were transfected with EGFP-α-tubulin. In some experiments, control neurons (not treated with bFGF) were compared with neurons treated with bFGF. In other cases, control neurons (expressing mCherry) were compared with neurons expressing mCherry-spastin. The latter was to ascertain any potential changes elicited by spastin overexpression. In other experiments, neurons were transfected with control or spastin siRNA and then transfected with the EGFP-α-tubulin construct 2 d later and then replated. To assist in monitoring transport of microtubules over relatively long and straight trajectories, the neurons were plated onto poly- l -lysine with laminin (see above). Imaging was conducted 24–48 h after plating or replating. Individual unfasciculated axons with clearly identifiable directionality of growth from the cell body were chosen for analysis so that anterograde and retrograde movements could be identified with certainty. We used the Zeiss inverted Observer Z1 microscope (Carl Zeiss, Jena, Germany), with a Zeiss incubation chamber, interfaced with the MicroPoint Mosaic Digital Diaphragm system from Photonics Instruments (St. Charles, IL), coupled to an argon ion laser. The Zeiss incubation chamber provides optimal culture conditions of 37°C and 5% CO 2 . The photonic laser Mosaic system was used to photobleach regions of the axons in similar manner to our earlier studies on microtubule transport ( Hasaka et al. , 2004 ; He et al. , 2005 ; Ahmad et al. , 2006 ; Myers and Baas, 2007 ). Only one photobleached region was made on each axon analyzed. This region was always 40–50 μm in length and always was located roughly equidistant from the cell body and the tip of the axon. A 100× 1.3 NA Plan Apo oil immersion objective and a GFP filter set (Chroma Technology, Brattleboro, VT) were used for acquiring fluorescence images. The CCD camera and most aspects of the microscope were controlled by Axiovision 4.1 software (Zeiss) running on an Intel Xeon processor-based computer (Fujitsu Siemens, Berlin, Germany) with the Windows XP Professional operating system (Microsoft, Seattle, WA). The intensity of epifluorescence illumination was attenuated to 30% to reduce photobleaching and photodamage during acquisition; 2 × 2 binning was applied to increase signal intensity. Images were acquired at 1.8-s intervals, with ∼280–320-ms exposure time. Time-lapse images were saved as “zvi” files and analyzed using Axiovision 4.1 software. Motion analysis was performed only on axons that displayed at least one microtubule that was visible without digital processing. Additional analysis was conducted using digital contrast adjustments within the “Image Properties” application of Axiovision 4.1. Statistics were performed using the Student's t test.
EB3 Live-Cell Imaging
To image the assembly of microtubules from their plus ends, we expressed fluorescently tagged EB3, which is a microtubule “end binding protein” that tracks with the plus ends of microtubules during bouts of rapid assembly ( Stepanova et al. , 2003 ). We have used this approach in a number of our studies on microtubule behaviors in cultured neurons ( Hasaka et al. , 2004 ; Ahmad et al. , 2006 ; Myers et al. , 2006 ; Nadar et al. , 2008 ). To visualize EB3 comets within the axon of the cultured neurons in the experiments involving bFGF, we transfected neurons with EGFP-EB3 and cultured in medium containing bFGF. To image EGFP-EB3 within the axons of spastin-overexpressing neurons, we cotransfected neurons with both EGFP-EB3 and mCherry-spastin. Images were acquired at a rate of 1 per second excluding camera exposure times to time-lapse movies. Depending on the fluorescence intensity of EB3, exposure time ranged from 250 to 350 ms so that the real-time imaging of individual axons ranged from 2 to 4 min. As with the microtubule transport assay described above, we used the Zeiss inverted Observer Z1 microscope with the Zeiss incubation chamber, and we analyzed only one region per axon that always located roughly equidistant from the cell body and the tip of the axon. The region we analyzed was always 50–70 μm in length, a bit longer than the length analyzed in the microtubule transport studies. Details on the objective, camera, software, illumination, and binning were also the same as described above for the microtubule transport studies. EB3 quantification was performed using Axiovision “measure” module. Numbers of EB3 comets, average speeds of the comets and longevities of the comets were analyzed in details. Frames extracted for still images were exported from Axiovision as TIFF files and processed in Photoshop 7 (Adobe Photosystems, San Jose, CA). Statistics were performed using the Student's t test.
Primary Antibodies Used for Western Blotting and Immunofluorescence Analyses
Primary antibodies included the following: monoclonal: tau1 (anti-dephosphorylated tau, obtained from Dr. Lester Binder of Northwest University; Binder et al. , 1985 ), tau5 (anti-total tau, also obtained from Binder; Papasozomenos and Binder, 1987 ), anti-β tubulin directly conjugated with Cy3 (Sigma, St. Louis, MO, Cat. no. C4585), anti-GAPDH (Ambion, Austin, TX, Cat. no. AM4300); Polyclonal: anti-spastin (AAA spastin antibody; Solowska et al. , 2008 ), tauR1 (anti-total tau, obtained from Binder; Berry et al. , 2004 ), anti-P60-katanin ( Yu et al. , 2005 ), anti-P80-katanin ( Yu et al. , 2005 ), and anti-GFP (Abcam, Cambridge, MA, Cat. no. ab6556).
Western Blotting
Western blotting was conducted as in our previous studies for siRNA experiments, to ensure that over 95% of the spastin protein had been depleted before the replating step ( Qiang et al. , 2006 ; Yu et al. , 2008 ). Western blotting was also used for experiments aimed at ascertaining changes in the levels of various proteins during treatment of neurons with bFGF. For the latter, Western blotting was conducted on cultures that had been exposed to bFGF for 4, 24, or 72 h.
Immunofluorescence Analyses
Procedures of the immunofluorescence studies were performed as previously described ( Yu et al. , 2005 , 2008 ; Qiang et al. , 2006 ). For the experiments on microtubule distribution after experimental manipulations, the cultures were simultaneously fixed and extracted 24–48 h after plating. For the experiments relevant to the ratio images of tau1/tauR1, the cultures were fixed and then extracted after fixation 24–72 h after plating. Primary antibodies against proteins of interest (same as used for the Western blotting, see above; except that we used the polyclonal antibody tauR1 for staining total tau) were applied followed by appropriate secondary antibodies. Images (except those using tau1 and tauR1 antibodies) were obtained on an Axiovert 200M microscope (Carl Zeiss) equipped with a high-resolution CCD (Orca, Hamamatsu, Japan). The images were obtained using identical camera, microscope, and imaging criteria such as gain, brightness and contrast, and exposure time. In some cases, fluorescence images were subjected to the “invert” function in Adobe Photoshop (San Jose, CA) that converts blacks to whites and whites to blacks and inverts gray levels proportionally, because we found that fine details were more clearly visualized. The resulting images are referred to as “inverted images.” In one set of studies, ratio images were generated of cultures double-labeled with tau1 and tauR1 antibodies using the Pascal confocal microscope. Statistics were performed using the Student's t test.
Supplementary Material [Supplemental Material]
📊 Figures
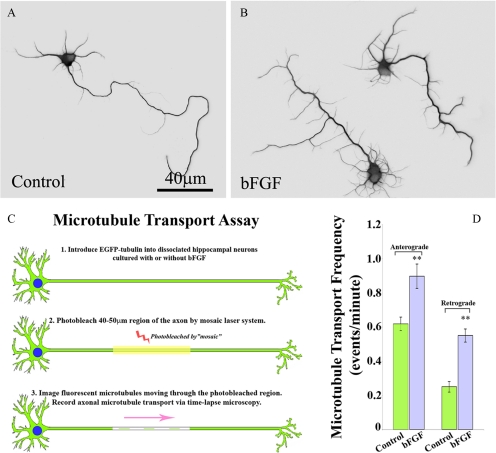
Figure 1.
bFGF alters the morphology of hippocampal neurons and microtubule transport in the axon. (A and B) Immunostains of microtubules in cultured hippocampal neurons. To reveal cellular morphology in greate...
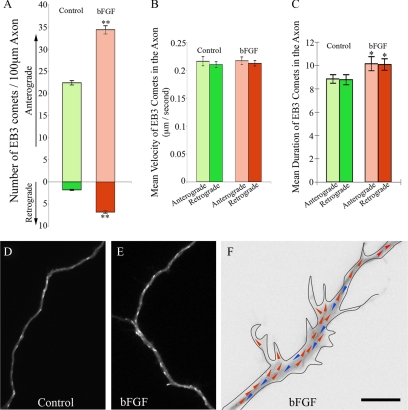
Figure 2.
bFGF increases the number of EB3 comets in the axon and their average duration. (A) Quantitative analyses of the number of EB3 comets within control and bFGF-treated axons. bFGF increases the number o...
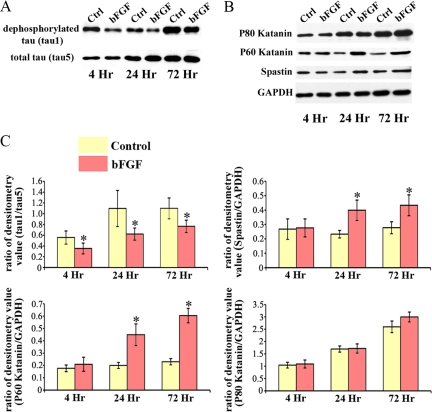
Figure 3.
Profile of proteins relevant to microtubule severing is changed in the presence of bFGF. (A and B) Western blots of whole cell extracts probed with antibodies for dephosphorylated tau (tau1), total ta...
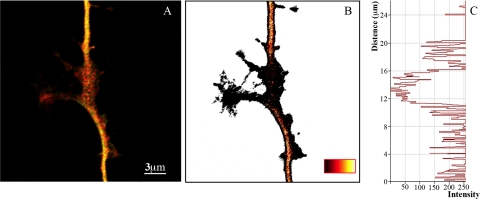
Figure 4.
Tau phosphorylation is elevated in regions of impending axonal branching. (A) Overlay fluorescence images of tau1 (green) and tauR1 (red) in the axonal shaft and in a region of impending axonal branch...
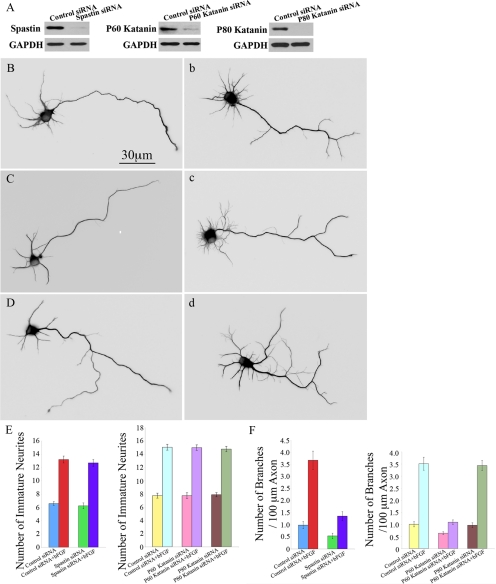
Figure 5.
Morphological analyses of hippocampal neurons exposed to bFGF and depleted of spastin, P60-katanin or P80-katanin. (A) Western blots of whole cell extracts probed with antibodies for spastin, P60-kata...
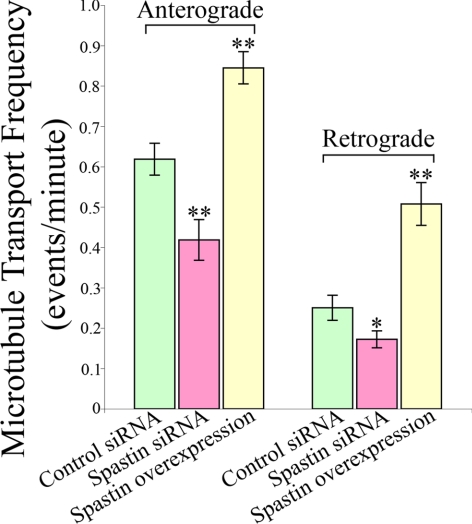
Figure 6.
The frequency of microtubule transport changes when microtubule severing is experimentally enhanced or suppressed. Quantitative analyses of the frequencies of microtubule transport in both anterograde...
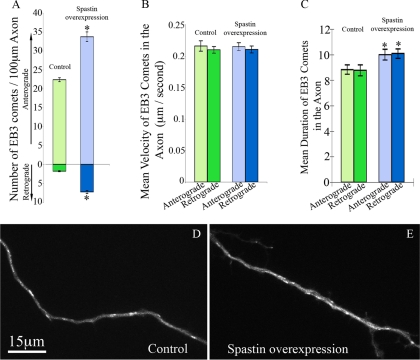
Figure 7.
Overexpression of spastin alters the behavior of EB3 comets in a manner similar to bFGF. (A) Quantitative analyses of the number of EB3 comets within the axons of control neurons and neurons overexpre...
Figure images are served from the NIH/NLM PubMed Central Open Access Subset or Europe PMC; copyright remains with the publishers and authors.
💬 Discussion
0 commentsNo comments yet. Be the first to start a discussion!
Leave a Comment