Abstract
In this paper, we describe the effects of the combination of topographical, mechanical, chemical and intracellular electrical stimuli on a co-culture of fibroblasts and skeletal muscle cells. The co-culture was anisotropically grown onto an engineered micro-grooved (10 µm-wide grooves) polyacrylamide substrate, showing a precisely tuned Young's modulus (∼ 14 kPa) and a small thickness (∼ 12 µm). We enhanced the co-culture properties through intracellular stimulation produced by piezoelectric nanostructures (i.e., boron nitride nanotubes) activated by ultrasounds, thus exploiting the ability of boron nitride nanotubes to convert outer mechanical waves (such as ultrasounds) in intracellular electrical stimuli, by exploiting the direct piezoelectric effect. We demonstrated that nanotubes were internalized by muscle cells and localized in both early and late endosomes, while they were not internalized by the underneath fibroblast layer. Muscle cell differentiation benefited from the synergic combination of topographical, mechanical, chemical and nanoparticle-based stimuli, showing good myotube development and alignment towards a preferential direction, as well as high expression of genes encoding key proteins for muscle contraction (i.e., actin and myosin). We also clarified the possible role of fibroblasts in this process, highlighting their response to the above mentioned physical stimuli in terms of gene expression and cytokine production. Finally, calcium imaging-based experiments demonstrated a higher functionality of the stimulated co-cultures.
🔬 Techniques
🔭 Microscopes
💻 Software
✨ Fluorophores
🧪 Sample Preparation
🔬 Cell Lines
🏭 Microscope Brands
🧪 Reagent Suppliers
📷 Detectors
💻 Software Details
🏛️ Research Organizations (ROR)
Affiliated research institutions:
📋 Methods
Flat and Micro-grooved Polyacrylamide Gel Preparation and Functionalization The hydrogels used in this study were prepared by modifying existing protocols for polyacrylamide (PA) gel preparation [41] , [42] . Figure 1 outlines the fabrication steps needed for the development of such thin, free-standing gels. Briefly, microfabricated Si molds ( Figure 1a ) and a pre-treatment of glass substrates with O 2 plasma ( Figure 1b ) were used to obtain flat or micro-grooved free-standing thin hydrogels, which were then properly functionalized by cross-linking fibronectin on their surfaces ( Figure 1c ), thus allowing their use as substrates for cell culture. 10.1371/journal.pone.0071707.g001 Figure 1 Schematics of the experimental procedure followed for fabricating and functionalizing polyacrylamide gels. (a) Fabrication of µG Si molds by means of photolithographic processes; (b) procedure to obtain free-standing flat and µG hydrogels; (c) hydrogel functionalization procedure, based on the activation of a photoresponsive cross-linker and fibronectin deposition. For simplicity, only a flat sample is reported. In details, glass coverslips were treated with O 2 plasma (200 mTorr pressure, 6.8 W, 60 sec, Plasma Cleaner, Gambetti s.r.l. Italia), then covered with 100 μL of a solution composed of 10% acrylamide/BIS-acrylamide (29∶1 ratio, Sigma-Aldrich) in dd-H 2 O supplemented with 1/200 volume of 10% ammonium persulfate (Sigma) and 1/2000 volume of N, N, N′, N′-tetramethylethylenediamine (TEMED, Sigma). Micro-grooved Si molds, obtained by means of standard photolithographic processes or flat Si molds, both previously treated for 20 min with trymethylchlorosilane (Carlo Erba), were placed upside-down on the top of the acrylamide solution drop. After ∼30 min, the polymerization process was completed; the Si molds were detached from the PA gels, which were rinsed with 50 mM 4-(2-hydroxyethyl)-1-piperazineethanesulfonic acid (HEPES, Sigma) at pH = 8.5 on a shaker. After a few hours in liquid, the hydrogels detached from the supporting glass coverslips, thus allowing free-standing substrates to be obtained. To properly functionalize them, hydrogels were covered with 1 mM sulfosuccinimidyl 6-(4′-azido-2′-nitrophenylamino)hexanoate (sulfo-SANPAH, Thermo Scientific) and exposed for 5 min to a 30 W UV lamp at a distance of 15 cm. Darkened sulfo-SANPAH solution was removed and the photoactivation procedure was repeated. Gels were washed with two changes of 50 mM HEPES (pH = 8.5), 15 min each, on a shaker, and then treated with a 20 μg/mL fibronectin (Sigma) that was allowed to react overnight at 4°C. Coated gels were then washed with phosphate buffered saline (PBS, EuroClone) and soaked for ∼ 45 min in culture medium at 37°C before cell seeding. Si Mold and PA Gel Characterization Microfabricated Si molds were characterized by scanning electron microscope (SEM) and atomic force microscope (AFM). SEM images were obtained with an EVO MA15 SEM (Zeiss) equipped with LaB 6 source and working at a 10 kV accelerating voltage. AFM scans were performed by using an Innova Scanning Probe Microscope (Veeco). Measurements were performed in air, at room temperature and operating in tapping mode, with oxide-sharpened silicon probes (RTESPA-CP) at a resonant frequency of ∼ 300 kHz. AFM images were processed by means of a Gwyddion SPM software analysis tool. Bright field images of PA gels showing the micro-grooves transferred from molds to gels were obtained by an optical microscope (Hirox KH 7700 Digital 3D video microscope with objective lenses covering a magnification range from 35X to 7000X). PA gel thickness was assessed by means of a profilometer (Kla-Tencor P6, low-force head configuration surface profiler with 2 μm, 60 degree stylus radius). Gel mechanical properties were evaluated by performing traction tests with an INSTRON 4464 Mechanical Testing System, using a ±10 N load cell. Gels were carefully taken with tweezers and placed between two ad hoc designed aluminium clamps. All samples were pulled at a constant speed of 5 mm/min, until reaching sample failure. Data were recorded at a frequency of 100 Hz; stress was calculated as the load divided by the cross-section area of tensile specimens, while strain was calculated as the ratio between the extension and the initial length of tensile specimens. The elastic modulus for each tested sample was then calculated starting from its stress/strain curve. Fibronectin coating quantitative characterization was performed by leaving fibronectin-coated hydrogels in PBS and analyzing the sample supernatant for 14 days after functionalization. At this aim, we analyzed the protein (fibronectin) content in the supernatant by using a Bio Tex SynergyMX spectrophotometer reading absorbance at 280 nm. A 2 μl drop of supernatant was placed in each well of a TAKE 3 plate and the data were elaborated using Gen5 software. TRITC-fibronectin (20 μg/mL, Invitrogen) was then used to visually assess protein coating stability on sample surfaces. Samples were imaged at different time points to check if the protein (showing red fluorescence) remained on the gels after incubation in the cell culture medium. All fluorescence images were acquired by using an inverted fluorescence microscope (Eclipse Ti) equipped with TRITC, FITC and DAPI filters (Nikon), with a cooled CCD camera (DS-5MC USB2, Nikon) and with NIS Elements imaging software.
Show full methods section
Flat and Micro-grooved Polyacrylamide Gel Preparation and Functionalization The hydrogels used in this study were prepared by modifying existing protocols for polyacrylamide (PA) gel preparation [41] , [42] . Figure 1 outlines the fabrication steps needed for the development of such thin, free-standing gels. Briefly, microfabricated Si molds ( Figure 1a ) and a pre-treatment of glass substrates with O 2 plasma ( Figure 1b ) were used to obtain flat or micro-grooved free-standing thin hydrogels, which were then properly functionalized by cross-linking fibronectin on their surfaces ( Figure 1c ), thus allowing their use as substrates for cell culture. 10.1371/journal.pone.0071707.g001 Figure 1 Schematics of the experimental procedure followed for fabricating and functionalizing polyacrylamide gels. (a) Fabrication of µG Si molds by means of photolithographic processes; (b) procedure to obtain free-standing flat and µG hydrogels; (c) hydrogel functionalization procedure, based on the activation of a photoresponsive cross-linker and fibronectin deposition. For simplicity, only a flat sample is reported. In details, glass coverslips were treated with O 2 plasma (200 mTorr pressure, 6.8 W, 60 sec, Plasma Cleaner, Gambetti s.r.l. Italia), then covered with 100 μL of a solution composed of 10% acrylamide/BIS-acrylamide (29∶1 ratio, Sigma-Aldrich) in dd-H 2 O supplemented with 1/200 volume of 10% ammonium persulfate (Sigma) and 1/2000 volume of N, N, N′, N′-tetramethylethylenediamine (TEMED, Sigma). Micro-grooved Si molds, obtained by means of standard photolithographic processes or flat Si molds, both previously treated for 20 min with trymethylchlorosilane (Carlo Erba), were placed upside-down on the top of the acrylamide solution drop. After ∼30 min, the polymerization process was completed; the Si molds were detached from the PA gels, which were rinsed with 50 mM 4-(2-hydroxyethyl)-1-piperazineethanesulfonic acid (HEPES, Sigma) at pH = 8.5 on a shaker. After a few hours in liquid, the hydrogels detached from the supporting glass coverslips, thus allowing free-standing substrates to be obtained. To properly functionalize them, hydrogels were covered with 1 mM sulfosuccinimidyl 6-(4′-azido-2′-nitrophenylamino)hexanoate (sulfo-SANPAH, Thermo Scientific) and exposed for 5 min to a 30 W UV lamp at a distance of 15 cm. Darkened sulfo-SANPAH solution was removed and the photoactivation procedure was repeated. Gels were washed with two changes of 50 mM HEPES (pH = 8.5), 15 min each, on a shaker, and then treated with a 20 μg/mL fibronectin (Sigma) that was allowed to react overnight at 4°C. Coated gels were then washed with phosphate buffered saline (PBS, EuroClone) and soaked for ∼ 45 min in culture medium at 37°C before cell seeding. Si Mold and PA Gel Characterization Microfabricated Si molds were characterized by scanning electron microscope (SEM) and atomic force microscope (AFM). SEM images were obtained with an EVO MA15 SEM (Zeiss) equipped with LaB 6 source and working at a 10 kV accelerating voltage. AFM scans were performed by using an Innova Scanning Probe Microscope (Veeco). Measurements were performed in air, at room temperature and operating in tapping mode, with oxide-sharpened silicon probes (RTESPA-CP) at a resonant frequency of ∼ 300 kHz. AFM images were processed by means of a Gwyddion SPM software analysis tool. Bright field images of PA gels showing the micro-grooves transferred from molds to gels were obtained by an optical microscope (Hirox KH 7700 Digital 3D video microscope with objective lenses covering a magnification range from 35X to 7000X). PA gel thickness was assessed by means of a profilometer (Kla-Tencor P6, low-force head configuration surface profiler with 2 μm, 60 degree stylus radius). Gel mechanical properties were evaluated by performing traction tests with an INSTRON 4464 Mechanical Testing System, using a ±10 N load cell. Gels were carefully taken with tweezers and placed between two ad hoc designed aluminium clamps. All samples were pulled at a constant speed of 5 mm/min, until reaching sample failure. Data were recorded at a frequency of 100 Hz; stress was calculated as the load divided by the cross-section area of tensile specimens, while strain was calculated as the ratio between the extension and the initial length of tensile specimens. The elastic modulus for each tested sample was then calculated starting from its stress/strain curve. Fibronectin coating quantitative characterization was performed by leaving fibronectin-coated hydrogels in PBS and analyzing the sample supernatant for 14 days after functionalization. At this aim, we analyzed the protein (fibronectin) content in the supernatant by using a Bio Tex SynergyMX spectrophotometer reading absorbance at 280 nm. A 2 μl drop of supernatant was placed in each well of a TAKE 3 plate and the data were elaborated using Gen5 software. TRITC-fibronectin (20 μg/mL, Invitrogen) was then used to visually assess protein coating stability on sample surfaces. Samples were imaged at different time points to check if the protein (showing red fluorescence) remained on the gels after incubation in the cell culture medium. All fluorescence images were acquired by using an inverted fluorescence microscope (Eclipse Ti) equipped with TRITC, FITC and DAPI filters (Nikon), with a cooled CCD camera (DS-5MC USB2, Nikon) and with NIS Elements imaging software.
Cell Cultures
Normal human dermal fibroblasts (nHDFs) were purchased from Lonza (Cat. # CC-2511). C2C12 myoblasts were purchased from ATTC (Cat. # CRL-1772). Both cell types were expanded in proliferation medium, composed of 90% Dulbecco’s Modified Eagle’s Medium (DMEM, Euroclone) supplemented with 10% Fetal Bovine Serum (FBS, Euroclone), 100 IU/mL penicillin (EuroClone), 100 μg/mL streptomycin (EuroClone) and 2 mM L-glutamine (Sigma). During culture, the cells were maintained at 37°C in a saturated humidity atmosphere containing 95% air and 5% CO 2 . nHDFs (passage 80%. If not differently specified, chemicals were purchased from Sigma-Aldrich (St. Louis, MO, USA). Glycol chitosan (GC) was used for the dispersion and stabilization of BNNTs. Dispersion was prepared with PBS. BNNTs (10 mg) were mixed with 10 ml of a 0.1% GC solution in a polystyrene tube. The samples were sonicated for 12 h (by a Bransonic sonicator 2510, Danbury, CT, USA) with an output power of 20 W for all the experiments, resulting in a stable GC-BNNT dispersion by the non-covalent coating of the nanotube walls with GC. Microphotographs of the final dispersion of BNNTs were obtained with a FEI 200 FIB microscope. BNNTs were added to the differentiation medium of BNNT-treated samples at a concentration of 10 μg/mL, thus inducing their internalization by cells. Internalized BNNTs were stimulated daily, during cell differentiation, by means of outer ultrasound sources. Stimulation was carried out by using a Bransonic sonicator 2510 and by partially immersing the culture plate (properly sailed with parafilm) in the ultrasound bath for 10 s every day, applying 20 W power and 40 kHz frequency. The choice of this stimulation protocol derived from preliminary tests on co-cultured cells, which highlighted that an higher stimulation frequency (more than one stimulation per day) and/or a greater time of stimulation (>10 s) implied an increased cell mortality, especially at later stages of differentiation. Inductive Coupled Plasma Mass Spectrometry (ICP-MS) Analysis BNNT internalization was assessed by measuring the boron content in cell lysates. Cells were extensively rinsed with PBS to avoid any residual of extracellular BNNTs, then they were trypsinized and collected in a centrifuge tube. Cells were then provided with 1 mL of nitric acid (68% in H 2 O) and incubated overnight at room temperature, in order to completely disrupt any organic component. Afterwards, the samples were freeze-dried and the presence of boron in the samples was evaluated by ICP-MS (Thermo X Series). To this purpose, samples were digested overnight in the presence of hydrofluoric acid (0.1 mL, 40%, (w/v)) and ultrasounds. Then, 9.9 mL of aqueous nitric acid solution (2% (w/v)) were added. The samples (n = 3) were analyzed by ICP-MS for the quantification of internalized boron. Boron content (directly proportional to BNNTs internalized by cells) was thus quantitatively assessed. Transmission Electron Microscopy (TEM) Imaging and Electron Energy Loss Spectroscopy (EELS) Analysis Scanning TEM-high angle annular dark field (STEM-HAADF) was employed to visualize C2C12 myoblasts co-cultured with nHDFs, incubated with GC-conjugated BNNTs. Samples were fixed in 2% glutaraldehyde in 0.1 M cacodylate buffer for 2 h, washed several times in the same buffer, post-fixed in 1% osmium tetroxide in d-H 2 O, stained overnight at 4°C in 0.5% uranyl acetate in d-H 2 O, dehydrated in a graded ethanol series, and embedded in SPURR resin. To release the embedded cells from their substrates, the samples were transferred between liquid nitrogen and hot water. Planar and transverse sections of about 70 nm in thickness were cut with a diamond knife on an ultramicrotome Leica EM UC6. STEM-HAADF investigations were carried out using a Jeol JEM-2200FS TEM, equipped with a field emission gun operated at 200 kV and with an Omega filter. To identify the BNNTs, electron energy loss spectra (EELS) were acquired by scanning a 1 nm electron beam on selected features in STEM-HAADF mode. In Vitro Assays With regard to genetic analyses, the expression of ten genes responsible for skeletal muscle differentiation was evaluated at two time points (D3 and D7) by quantitative real-time polymerase chain reaction (qRT-PCR). Total RNA from experimental groups was isolated using a protocol with TRIzol (Invitrogen) and Rneasy Minikit (Qiagen). After RNA extraction, cDNA was prepared from 1 μg RNA using Taqman Reverse transcription reagents (AppliedBiosystems). The reference sample was represented by C2C12 cells in proliferation state, at 70% confluence on polystyrene flasks, not provided with any differentiative stimulus. qRT-PCR was performed using Power SYBR Green PCR Master Mix and detection was carried out by means of an ABI PRISM 7500 System (Applied Biosystems). Quantification of target genes was performed in respect of the reference GAPDH gene, using the following formula: relative expression = 2 [–(Ct sample – Ct GAPDH)] . The mean minimal cycle threshold values (Ct) were calculated from quadruplicate reactions. Then, the relative gene expression in each experimental group was normalized to the relative gene expression found in the reference sample. Regarding immunocytochemistry procedures, cells were fixed at the timepoints (D3 and D7) by using 4% paraformaldehyde (Sigma-Aldrich) in PBS for 15 min and permeabilized by using 0.1% Triton X-100 in PBS for 15 min, following a standard procedure. Oregon Green® 488 phalloidin (Invitrogen) and 1 µM DAPI (Invitrogen) were used to stain F-actin and cell nuclei, respectively, at D3. Fluorescence images were acquired by a confocal fluorescence microscope (LSM 510 Meta, Carl Zeiss), equipped with TRITC, FITC and DAPI filters. At D7, cells were stained for α-actinin (anti-α-actinin, from abcam) and myosin heavy chain (MHC) (anti-MHC, from Santa Cruz Biotechnology) with respectively Oregon green- and rhodamine-conjugated IgGs (Invitrogen), used as secondary antibodies. Fluorescence images were acquired by confocal microscope.
Cytokine Measurements
Fibroblast (nHDF) culture supernatants were assayed for cytokines using a Bio-plex human 17-plex panel immunoassay kit (Bio-Rad, http://www.bio-rad.com ) and cytokine concentrations were determined using Bio-Plex Manager 5, according to manufacturer’s instructions. The 17-Plex panel consisted of the following analytes: interleukin-1 (IL-1β), IL-2, IL-4, IL-5, IL-6, IL-7, IL-8; IL-10, IL-12(p70), IL-13, IL-17, granulocyte colony-stimulating factor (G-CSF), granulocyte/macrophage colony-stimulating factor (GM-CSF), interferon (IFN-γ), monocyte chemotactic protein (MCP-1 (MCAF)), macrophage inflammatory protein (MIP-1β), and tumor necrosis factor (TNF-α). Supernatant media samples were collected, centrifuged and frozen. Samples and controls were run in triplicate, standards and blanks in duplicate. Only seven analytes were detected; the others were below the lower detection limit.
Calcium Transients Imaging
C2C12 cultures at D7 were loaded with 5 µM Fura-2 pentacetoxymethyl ester (Sigma-Aldrich) in Krebs’-Ringer’s-HEPES solution (KRH, with the following composition (in mM): 125 NaCl, 5 KCl,1.2 MgSO 4 , 1.2 KH 2 PO 4 , 2 CaCl 2 , 6 glucose, and 25 HEPES-NaOH, pH 7.4) containing 10 mg/ml bovine serum albumin (Sigma-Aldrich) for 45 minutes at 37°C, washed in the same solution and transferred to the recording chamber of an inverted microscope (Leica DMI6000) equipped with a calcium imaging unit Polychrome V (TILL Photonics, Germany). Data were collected with Imaging Worckbench 6.0 software. Regions of interest (ROI), corresponding to multinucleated myotubes, were properly drawn. After a short period for baseline acquisition, C2C12 cells were sequentially stimulated with 2 mM caffeine (Sigma-Aldrich) and 100 µM Acetylcholine (Sigma-Aldrich), to evaluate the functional response of myotubes grown in the different experimental conditions.
Statistical Analyses
The data collected were subjected to analysis of variance in order to evaluate the statistically significant differences among samples. A t -test was performed for comparison between two groups, while Holm–Sidak tests were performed for comparisons among several groups. Significance was set at 5%.
Supporting Information Table S1 Summary of the most used abbreviations in the paper (in alphabetic order). (DOC) Click here for additional data file. Table S2 List of the genes used as markers for skeletal muscle differentiation and corresponding primer sequences. The sequences were designed to be specific for mouse cells (they do not detect human samples). (DOC) Click here for additional data file. Table S3 List of the genes used as markers for ECM protein production and corresponding primer sequences. The sequences were designed to be specific for human cells (they do not detect mouse samples). (DOC) Click here for additional data file.
📊 Figures
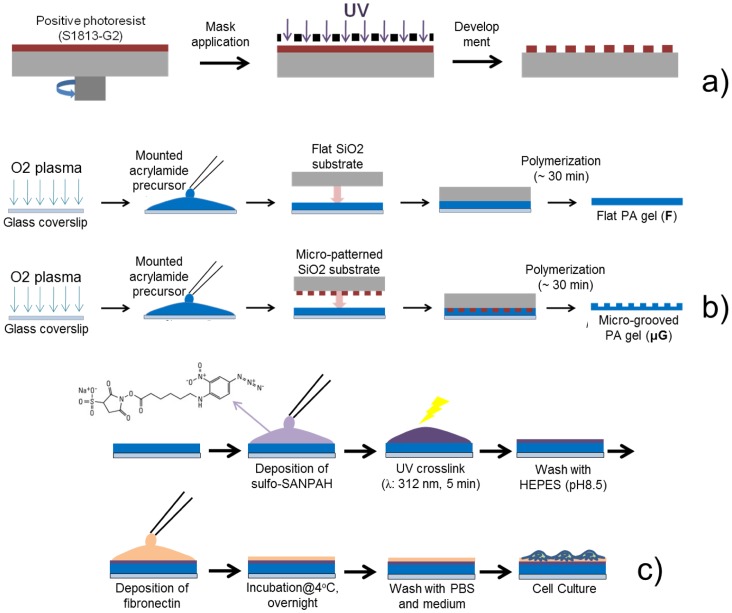
Figure 1
Schematics of the experimental procedure followed for fabricating and functionalizing polyacrylamide gels.
(a) Fabrication of u00b5G Si molds by means of photolithographic processes; (b) procedure to obtain free-standing flat and u00b5G hydrogels; (c) hydrogel functionalization procedure, based on the acti...
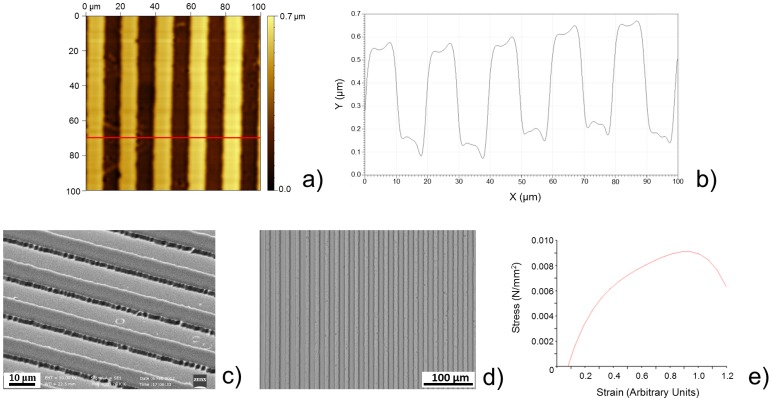
Figure 2
Results of topographical and mechanical characterization.
AFM image (100 u00b5m u00d7 100 u00b5m) of a micro-grooved (u00b5G) Si mold (a) and height profile (b) corresponding to the red line in the AFM image; (c) SEM image of a u03bcG Si mold; (d) optical im...
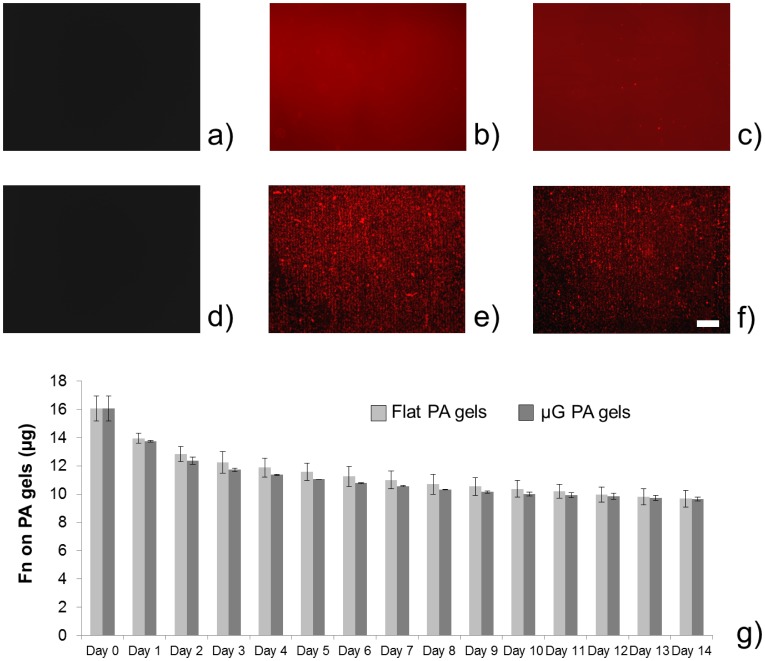
Figure 3
Stability of fibronectin coating on the polyacrilamide gels.
Gels were treated with sulfo-SANPAH (see Experimental section), coated with a 20 u03bcg/ml fibronectin solution, incubated overnight at 4u00b0C and maintained in culture medium (a-f) or PBS (g) for 2 ...
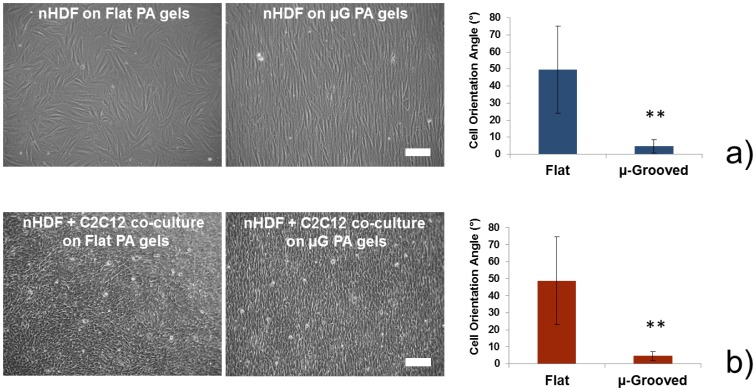
Figure 4
Cell orientation on F and u03bcG hydrogels 24 h after seeding.
(a) Bright field images (scale baru200a=u200a100 u03bcm) and quantitative cell orientation angle measurements reveal that nHDFs are isotropically oriented on flat PA gels (orientation angle close to 4...
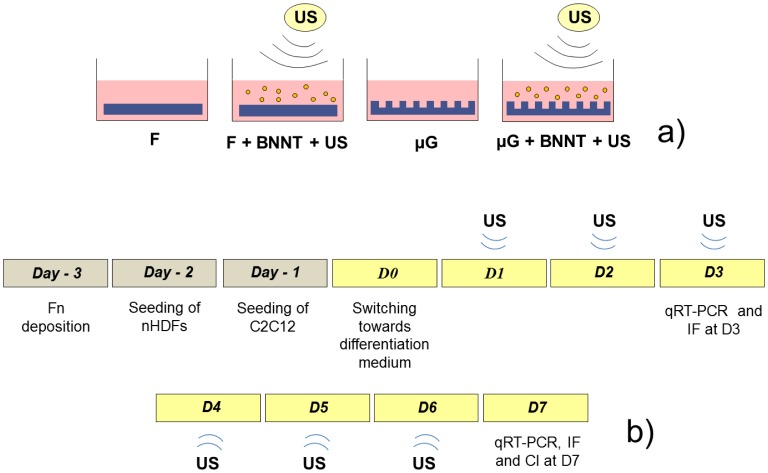
Figure 5
Schematics of the experimental layout.
The different sample types are schematically represented in (a). Cells cultured on flat PA gels are provided with simple differentiation medium (F) or with differentiation medium supplemented with 10 ...
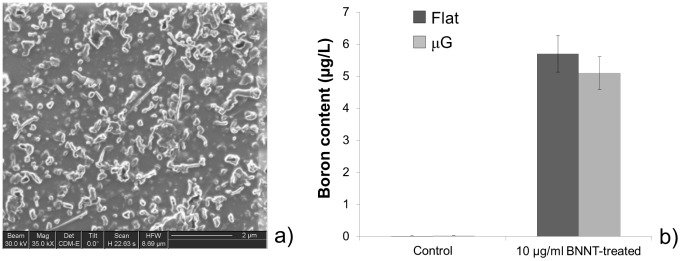
Figure 6
Characterization of CG-BNNT dispersion and results of quantitative internalization tests.
(a) FIB image of a CG-BNNT (10 u03bcg/ml) dispersion; (b) elemental analysis performed by ICP-MS analysis, revealing boron content in BNNT-treated cell lysates (on both flat and u03bcG PA gels) and in...
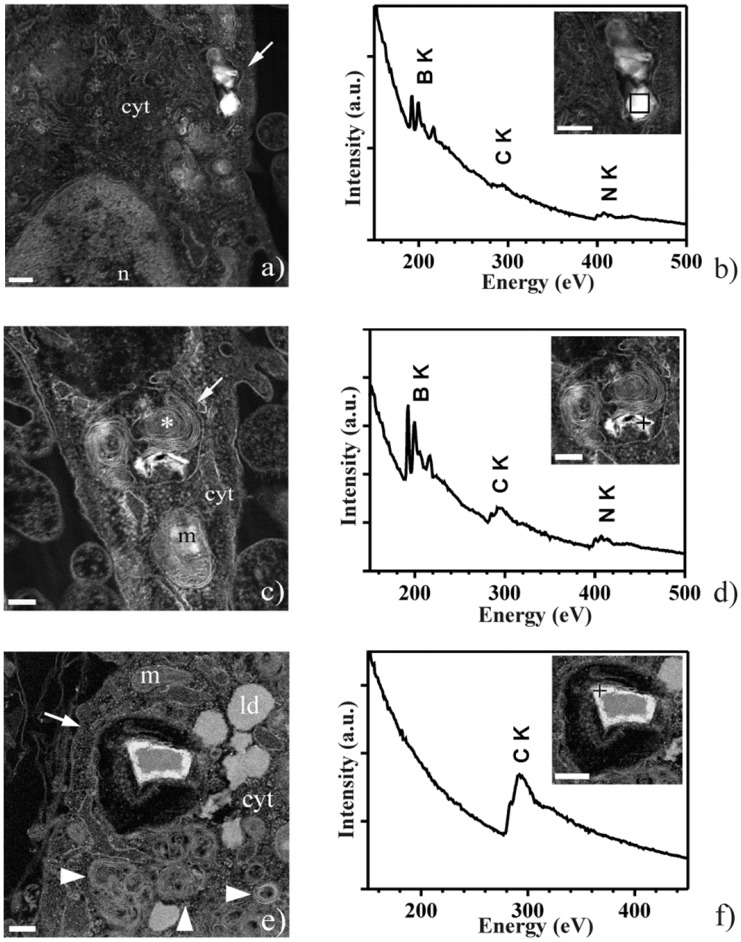
Figure 7
Proof of presence and intracellular localization of GC-conjugated BNNTs inside C2C12 myoblasts co-cultured with nHDFs via scanning TEM-high angle annular dark field (STEM-HAADF) coupled with energy electron loss spectroscopy (EELS).
(a) STEM-HAADF image of part of a myoblast. The arrow points to an early endosome containing the GC-conjugated BNNTs. (b) EEL spectrum collected from the area boxed in the inset, showing the core-loss...
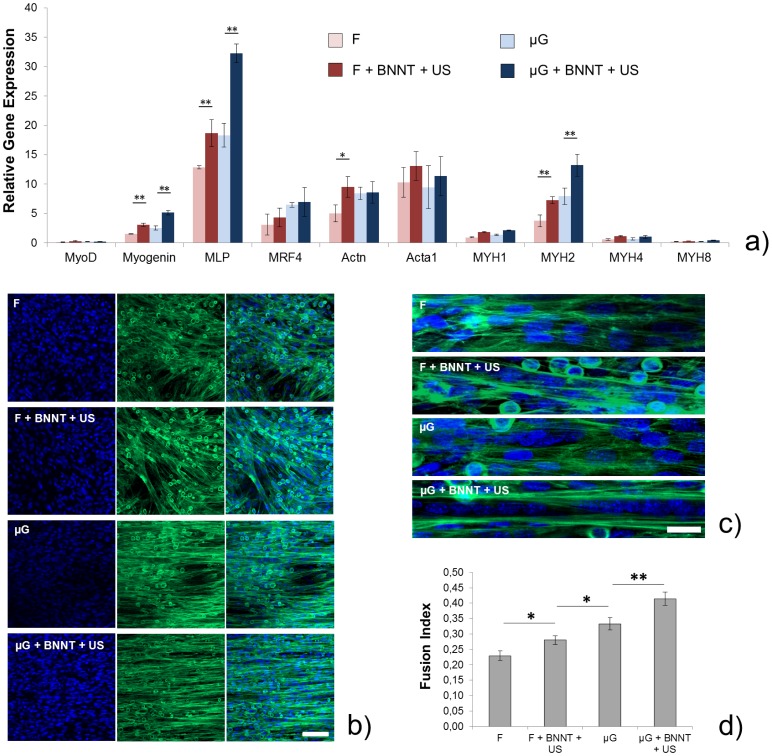
Figure 8
Evaluation of skeletal muscle differentiation for the different samples at D3.
(a) Relative gene expression levels for ten genes important for skeletal muscle differentiation, compared between the different experimental groups (F, F+BNNT+US, u03bcG and u03bcG+BNNT+US). mRNA anal...
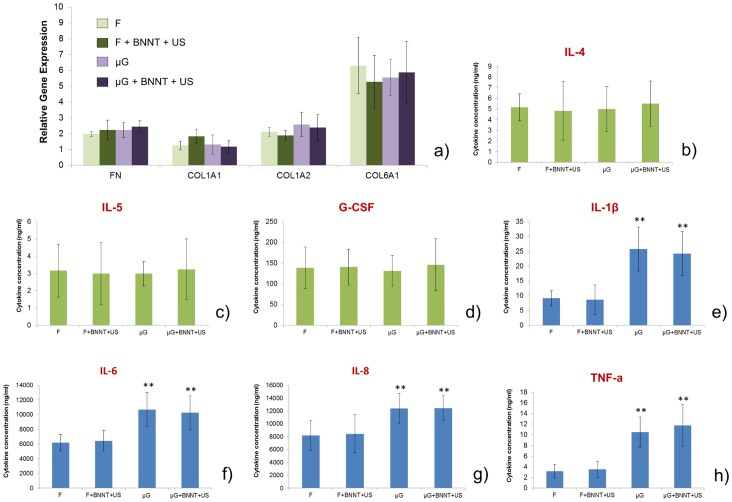
Figure 9
Investigation of the role of human fibroblasts in the skeletal muscle differentiation process.
(a) Relative gene expression levels for genes encoding the production of ECM proteins for nHDFs cultured on the different sample types at D3. The investigated genes encoded the expression of fibronect...
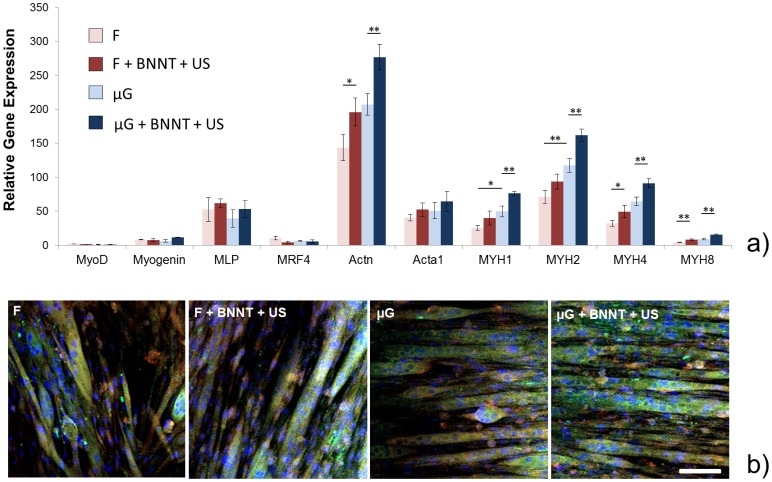
Figure 10
Evaluation of skeletal muscle differentiation for the different samples at D7.
(a) Relative gene expression levels for ten genes important for skeletal muscle differentiation, compared between the different experimental groups (F, F+BNNT+US, u03bcG and u03bcG+BNNT+US). mRNA anal...
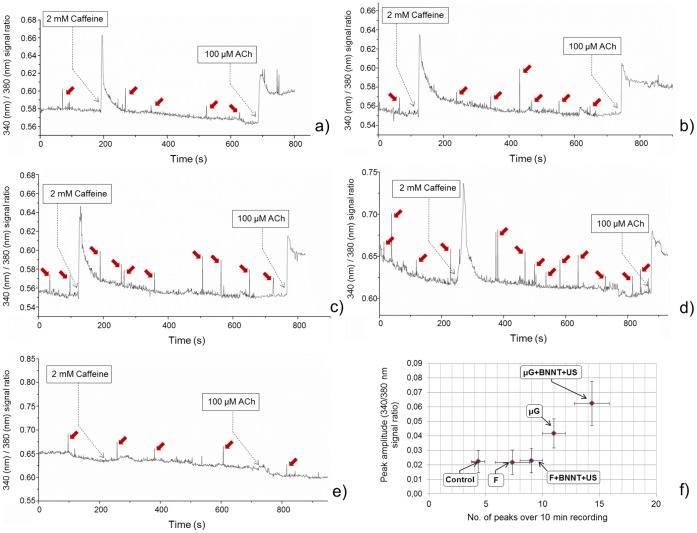
Figure 11
Intracellular (340 nm)/extracellular (380 nm) [Ca 2+ ] ratio signals recorded in ROI corresponding to single myotubes.
The different experimental conditions were tested: F (a), F+BNNT+US (b), u03bcG (c) and u03bcG+BNNT+US (d). As control, the signal corresponding to a single undifferentiated C2C12 cell was also acquir...
Figure images are served from the NIH/NLM PubMed Central Open Access Subset or Europe PMC; copyright remains with the publishers and authors.
💬 Discussion
0 commentsNo comments yet. Be the first to start a discussion!
Leave a Comment