Abstract
Abstract The mitotic spindle ensures the faithful segregation of chromosomes. Here we combine the first large-scale serial electron tomography of whole mitotic spindles in early C. elegans embryos with live-cell imaging to reconstruct all microtubules in 3D and identify their plus- and minus-ends. We classify them as kinetochore (KMTs), spindle (SMTs) or astral microtubules (AMTs) according to their positions, and quantify distinct properties of each class. While our light microscopy and mutant studies show that microtubules are nucleated from the centrosomes, we find only a few KMTs directly connected to the centrosomes. Indeed, by quantitatively analysing several models of microtubule growth, we conclude that minus-ends of KMTs have selectively detached and depolymerized from the centrosome. In toto , our results show that the connection between centrosomes and chromosomes is mediated by an anchoring into the entire spindle network and that any direct connections through KMTs are few and likely very transient.
🔬 Techniques
🔭 Microscopes
🧬 Organisms
💻 Software
✨ Fluorophores
🧪 Sample Preparation
🏭 Microscope Brands
🧪 Reagent Suppliers
📷 Detectors
💻 Software Details
💾 Data Repositories
🏛️ Research Organizations (ROR)
Affiliated research institutions:
📋 Methods
Worm strains, RNA interference and feeding clones All C. elegans strains were cultured at either 16 °C or 25 °C (ref. 53 ). The following strains were used in this study: wild-type N2 Bristol; MAS37 (unc-119(ed3) III; [pie-1::epb-2-gfp;unc-119(+)] 54 . RNAi experiments were performed by feeding 55 . Worms for zyg-1 (RNAi) were grown for 24 h at 25 °C on feeding plates. The feeding clone for zyg-1 (F59E12.2) was provided by A. Hyman (Dresden, Germany).
Sample preparation for electron microscopy Wild-type N2
C. elegans hermaphrodites were dissected in M9 buffer, and single embryos early in mitosis were selected and transferred to cellulose capillary tubes (Leica Microsystems, Vienna, Austria) with an inner diameter of 200 μm. The embryos were observed with a stereomicroscope until either metaphase or anaphase and then immediately cryo-immobilized using an EM PACT2 high-pressure freezer equipped with a rapid transfer system (Leica Microsystems, Vienna, Austria) 56 . Freeze substitution was performed over 3 days at −90 °C in anhydrous acetone containing 1% OsO 4 and 0.1% uranyl acetate using an automatic freeze substitution machine (EM AFS, Leica Microsystems, Vienna, Austria). Epon/Araldite infiltrated samples were flat embedded in a thin layer of resin, polymerized for 3 days at 60 °C, and selected by light microscopy for re-mounting on dummy blocks. Serial semi-thick sections (300 nm) were cut using an Ultracut UCT Microtome (Leica Microsystems, Vienna, Austria). Sections were collected on Formvar-coated copper slot grids and poststained with 2% uranyl acetate in 70% methanol followed by Reynold's lead citrate 57 .
Show full methods section
Worm strains, RNA interference and feeding clones All C. elegans strains were cultured at either 16 °C or 25 °C (ref. 53 ). The following strains were used in this study: wild-type N2 Bristol; MAS37 (unc-119(ed3) III; [pie-1::epb-2-gfp;unc-119(+)] 54 . RNAi experiments were performed by feeding 55 . Worms for zyg-1 (RNAi) were grown for 24 h at 25 °C on feeding plates. The feeding clone for zyg-1 (F59E12.2) was provided by A. Hyman (Dresden, Germany).
Sample preparation for electron microscopy Wild-type N2
C. elegans hermaphrodites were dissected in M9 buffer, and single embryos early in mitosis were selected and transferred to cellulose capillary tubes (Leica Microsystems, Vienna, Austria) with an inner diameter of 200 μm. The embryos were observed with a stereomicroscope until either metaphase or anaphase and then immediately cryo-immobilized using an EM PACT2 high-pressure freezer equipped with a rapid transfer system (Leica Microsystems, Vienna, Austria) 56 . Freeze substitution was performed over 3 days at −90 °C in anhydrous acetone containing 1% OsO 4 and 0.1% uranyl acetate using an automatic freeze substitution machine (EM AFS, Leica Microsystems, Vienna, Austria). Epon/Araldite infiltrated samples were flat embedded in a thin layer of resin, polymerized for 3 days at 60 °C, and selected by light microscopy for re-mounting on dummy blocks. Serial semi-thick sections (300 nm) were cut using an Ultracut UCT Microtome (Leica Microsystems, Vienna, Austria). Sections were collected on Formvar-coated copper slot grids and poststained with 2% uranyl acetate in 70% methanol followed by Reynold's lead citrate 57 .
Data acquisition by electron tomography
Colloidal gold particles (15 nm; Sigma-Aldrich) were attached to both sides of semi-thick sections collected on copper slot grids to serve as fiducial markers for subsequent image alignment. For dual-axis electron tomography 58 , series of tilted views were recorded using a TECNAI F30 transmission electron microscope (FEI Company, Eindhoven, The Netherlands) operated at 300 kV. Images were captured every 1° over a ±60° range and a pixel size of 2.3 nm using a Gatan US1000 CCD camera (2k × 2k). For each serial section two montages of 2 × 3 frames were collected and combined to a supermontage using the IMOD software package to cover the pole-to-pole distance of the spindles 59 . For image processing, the tilted views were aligned using the positions of the colloidal gold particles as fiducial markers. Tomograms were computed for each tilt axis using the R-weighted back-projection algorithm 60 . For double-tilt data sets two montages, each consisting of six tomograms, were aligned to each other and combined to a supermontage 58 . To cover a large volume of the pole-to-pole region of each mitotic spindle, we recorded on average 24 consecutive serial sections per spindle. 3D reconstruction and automatic segmentation of microtubules We used the IMOD software package ( http://bio3d.colourado.edu/imod ) that contains all of the programs needed for calculating electron tomograms 59 . Reconstructed tomograms were flattened and the two acquired montages of each section were combined to a supermontage using the edgepatches, fitpatches and tomostitch commands contained in the IMOD package. We applied the Amira software package with an extension to the filament editor of the Amira visualization and data analysis software for the segmentation and automatic tracing of microtubules 61 . We also used the Amira software to stitch the obtained 3D models in z to create full volumes of the recorded spindles 62 . The automatic segmentation of the spindle microtubules was followed by a visual inspection of the traced microtubules within the tomograms and correction of the individual microtubule tracings. Corrections included: manual tracing of undetected microtubules, connection of microtubules and deletions of tracing artifacts (for example, membranes of vesicles). Approximately 5% of microtubules needed to be corrected.
Data analysis
Data analysis was performed using either the Amira software (Visualization Sciences Group, Bordeaux, France) or by Matlab (R2015b, The MathWorks, Nitick, USA). Neighbourhood density of microtubules . The microtubule neighbourhood densities for 2D slices in comparison to random samples were computed in two steps. First, slices were defined along the centrosome-to-chromosomes axis for each half spindle. In addition, a cone was defined along the same axis, starting at the centre of the mother centriole and opening with an angle of 18.4° towards the chromosomes ( Fig. 1i ). The intersection area of this cone with each slice thus determined the regions for the microtubule density measurements. Second, the radial distribution function was estimated. For each microtubule point, the local density in a range of radial distances was computed. The mean over all microtubules provided an estimate for the radial distribution function as a neighbourhood density. For the normalization, we used 10,000 sets of randomly placed microtubules with the same total number as in the experiment. KMT attachment to chromosomes . To correlate the number of KMTs attaching to the chromosome surface, we assumed the shape of the chromosome surface available for KMT attachment to be a rectangle. This area of each rectangle corresponding to a chromosome was then correlated to the number of KMT attaching to the individual chromosome. Length distribution of microtubules . For the analysis of the microtubules length distributions ( Fig. 3a,b ), we checked whether the microtubules that leave the reconstructed tomographic volume affect our results (∼11 μm × 16.5 μm × 6 μm for each half spindle). We removed microtubules with one end point
📊 Figures
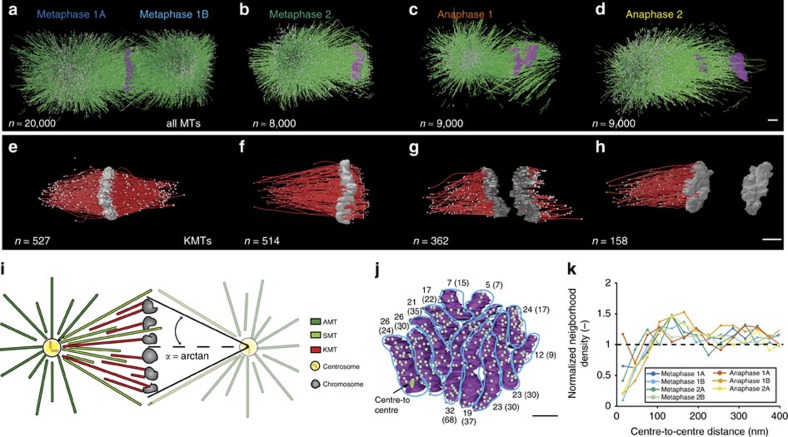
Figure 1
Three-dimensional reconstruction of spindle and KMTs.
( a ) Model of microtubules and chromosomes of a full metaphase spindle. ( b ) Model of a half spindle in metaphase. ( c , d ) Models of half spindles in anaphase. ( e u2013 h ) Corresponding 3D model...
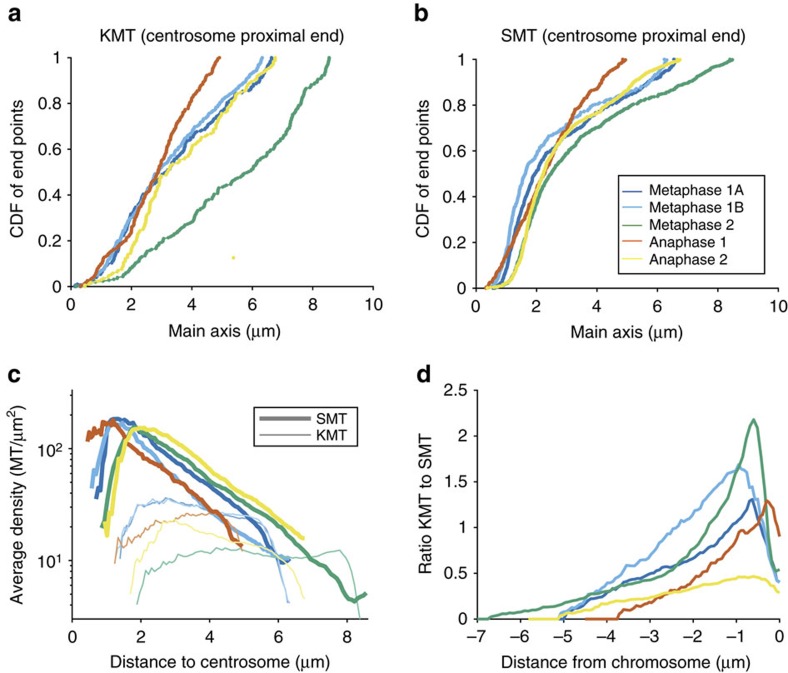
Figure 2
Analysis of endpoint position and density of KMTs.
( a ) Plot showing the fraction of ends of SMTs located within a region around the centrosome. ( b ) Fraction of ends of KMTs located within a region around the centrosome. ( c ) Density of KMTs and S...
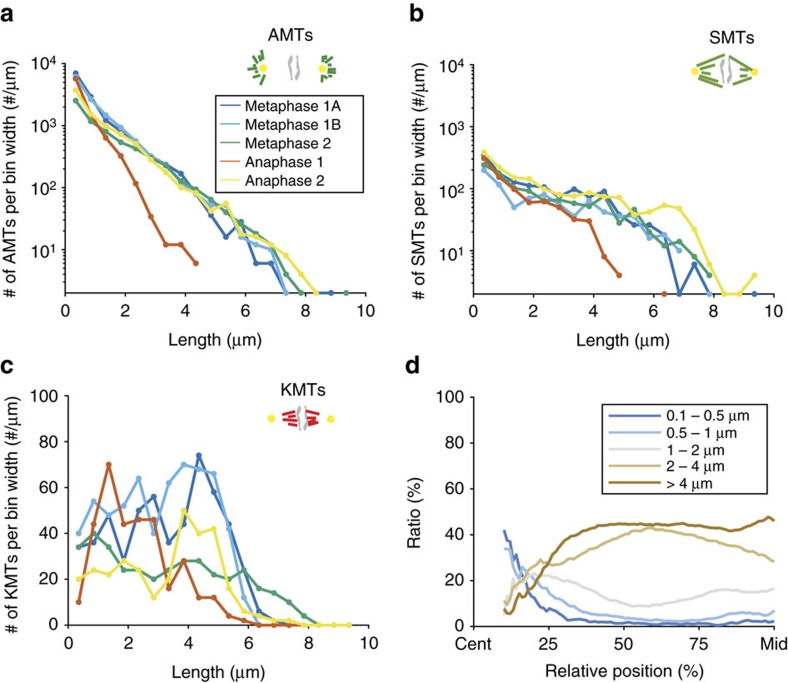
Figure 3
Microtubule length distributions.
( a ) Length distribution of AMTs. ( b ) Length distribution of SMTs. ( c ) Length distribution of KMTs. ( d ) Fraction of SMTs and AMTs within distinct length groups (as indicated by colours, average...
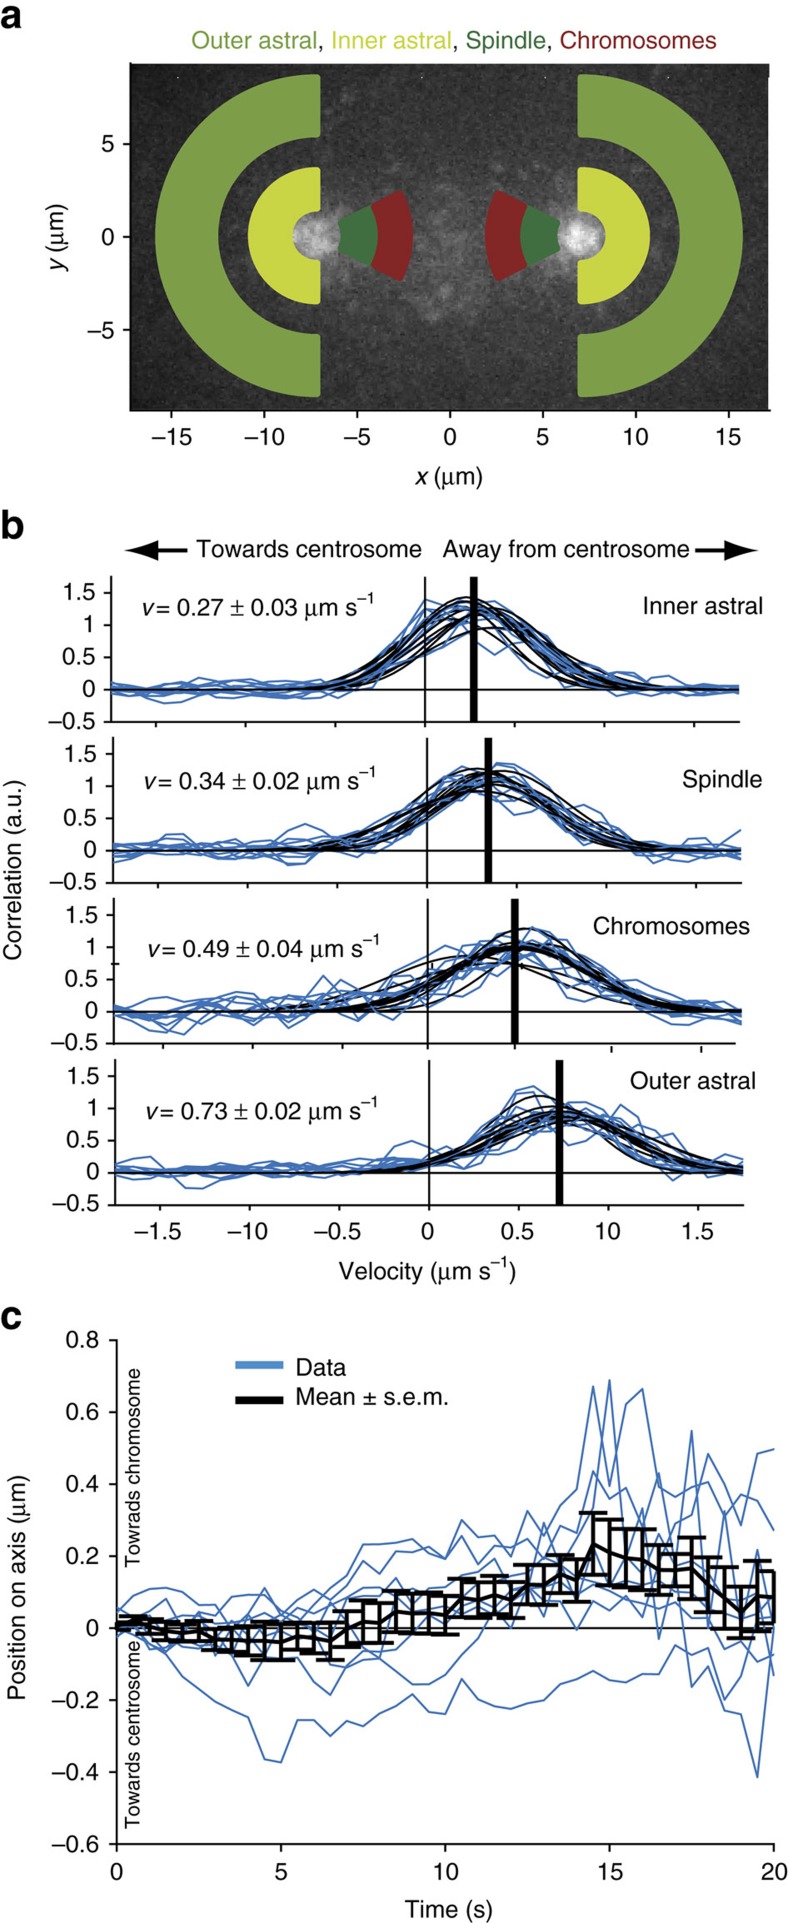
Figure 4
Directionality and growth velocity of KMTs.
( a ) Schematic image of different regions used for the analysis of EBP-2. ( b ) Cross-correlation of EBP-2 comets for u0394 t =0.6u2009s (blue lines) and measured in the regions as indicated in a . T...
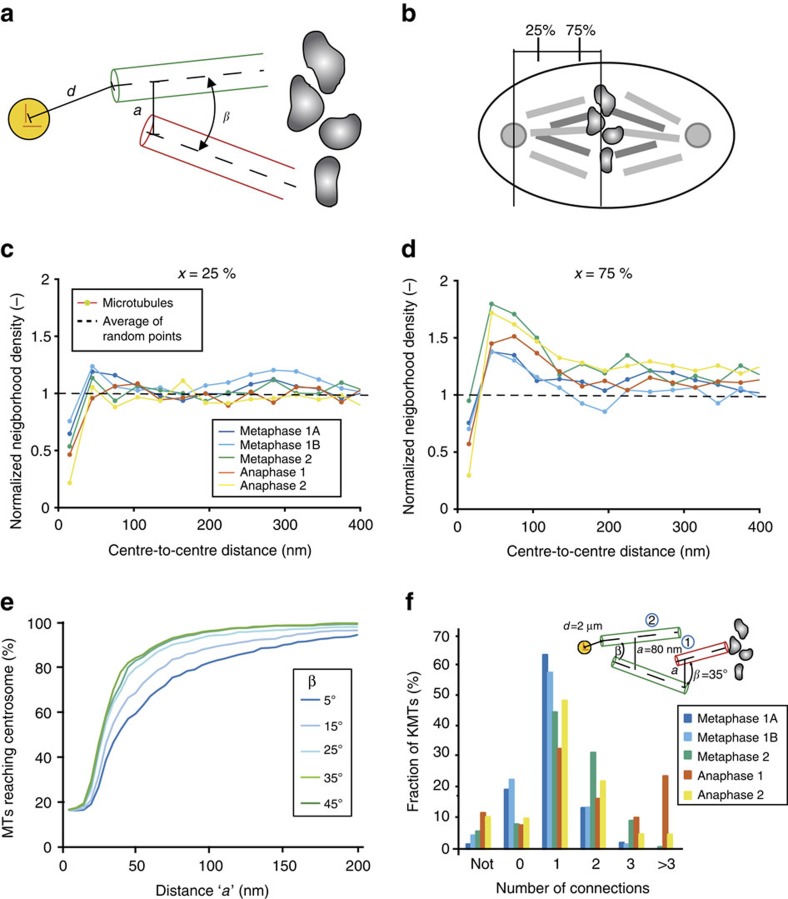
Figure 5
Relative arrangement of kinetochore and spindle microtubules.
( a ) Parameters for the characterization of microtubuleu2013microtubule interactions. d , distance from centrosome centre to a pole-proximal microtubule end (green); a closest centre-to-centre distan...
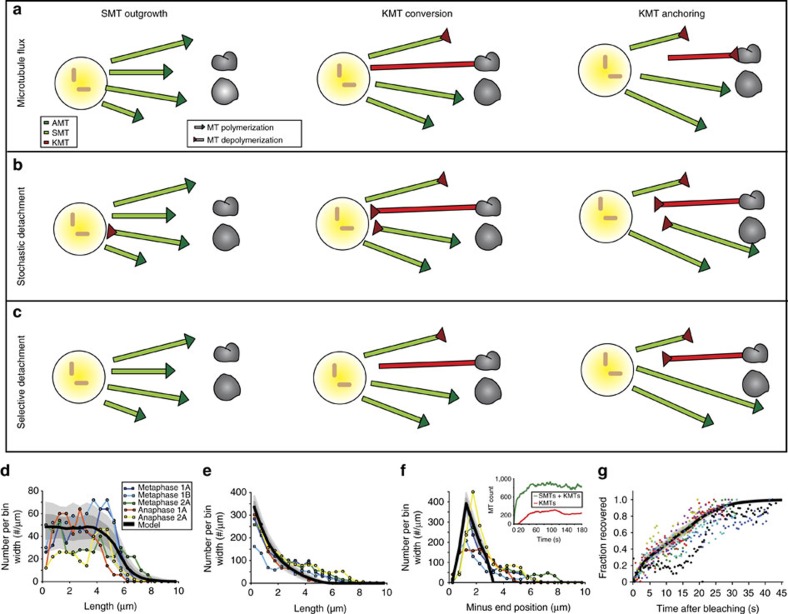
Figure 6
Models of KMT formation in C. elegans.
( a ) Microtubule flux model, SMTs grow out from the centrosome and will either undergo catastrophe or, upon connecting to a kinetochore, become a KMT. KMTs will then transition to a shrinking state, ...
Figure images are served from the NIH/NLM PubMed Central Open Access Subset or Europe PMC; copyright remains with the publishers and authors.
💬 Discussion
0 commentsNo comments yet. Be the first to start a discussion!
Leave a Comment