Abstract
The immune cells named T lymphocytes circulate around the body fulfilling their role in immunosurveillance by monitoring the tissues for injury or infection. To migrate from the blood into the tissues, they make use of the integrin LFA-1 which is exclusively expressed by immune cells. These highly motile cells attach and migrate on substrates expressing the LFA-1 ligand ICAM-1. The molecular events signaling LFA-1 activation and adhesion are now reasonably well identified, but the process of detaching LFA-1 adhesions is less understood. The cysteine protease calpain is involved in turnover of integrin-mediated adhesions in less motile cell types. In this study we have explored the involvement of calpain in turnover of LFA-1-mediated adhesions of T lymphocytes. Using live cell imaging and immunohistochemistry, we demonstrate that turnover of adhesions depends on the Ca2+-dependent enzyme, calpain 2. Inhibition of calpain activity by means of siRNA silencing or pharmacological inhibition results in inefficient disassembly of LFA-1 adhesions causing T lymphocyte elongation and shedding of LFA-1 clusters behind the migrating T lymphocytes. We show that calpain 2 is distributed throughout the T lymphocyte, but is most active at the trailing edge as detected by expression of its fluorescent substrate CMAC,t-BOC-Leu-Met. Extracellular Ca2+ entry is essential for the activity of calpain 2 that is constantly maintained as the T lymphocytes migrate. Use of T cells from a patient with mutation in ORAI1 revealed that the major calcium-release-activated-calcium channel is not the ion channel delivering the Ca2+. We propose a model whereby Ca2+ influx, potentially through stretch activated channels, is sufficient to activate calpain 2 at the trailing edge of a migrating T cell and this activity is essential for the turnover of LFA-1 adhesions.
🔬 Techniques
🔭 Microscopes
💻 Software
✨ Fluorophores
🧪 Sample Preparation
🔬 Cell Lines
🏭 Microscope Brands
🧪 Reagent Suppliers
💻 Software Details
🏛️ Research Organizations (ROR)
Affiliated research institutions:
📋 Methods
Inhibitors, antibodies and other reagents LFA-1 mAbs 38 and YTH 81.5 were produced at Cancer Research UK and Fab' fragments of mAb YTH81.5 directly conjugated to Alexa-488 fluorochrome as previously described [3] . Calpain 2 mAb 3A11D12 was kindly provided by Dr. Mitsuchi Inomata [50] . The following mAbs were purchased: calpain 1, Calbiochem; calpain 2, Research Diagnostics; α-tubulin, Sigma. The calpain inhibitors were purchased from Merck Biosciences: calpeptin (50 µg/ml unless stated) and PD150606 (50 µg/ml). The following reagents were purchased as indicated: 2-APB, Merck Bioscience; lanthanum chloride (LaCl 3 ), Sigma; SKF-96365, Sigma; pre-designed siRNAs for calpain 1 (ID 146578), calpain 2 (ID 112796 and 145947), and siRNA control #2 were all from Ambion; CAPN1 13 and 10, CAPN2 1 and 6 and negative control were from Qiagen. Cell isolation, culture and electroporation Peripheral blood mononuclear cells were prepared from single donor leukocyte buffy coats (National Blood Service) and T cells expanded as previously described and used between days 10 and 14 [21] . The human CD3 - leukemic T cell line, HSB2 was maintained in RPMI 1640/10% FCS [51] . Human polyclonal, non-transformed T cell lines from an ORAI1-mutated patient and wild type control were generated as previously described [34] and maintained in RPMI/10% FCS in the presence of IL-2. For siRNA knockdown experiments, HSB2 T cells line were washed twice in OptiMEM+GlutaMAX (Invitrogen) and electroporation was performed on 2×10 7 cells with 200–400 nM siRNAs using a Gene Pulser with Capacitance Extender (Bio-Rad) set at 960 µFD and 260 mV as previously described [3] . The siRNA-electroporated cells were maintained in RPMI 1640/10% FCS for 24 h prior to use. The efficiency of knockdown was evaluated by Western blot analysis for calpain with quantification using NIH image 1.63 software. Microscopy i. Video microscopy 35 mm glass bottomed petri dishes (MatTek Corp., Ashland Mass. USA) or or µ-slides VI (Ibidi, Thistle Scientific Ltd, Glasgow, UK) were coated overnight at 4°C with 3 µg/ml ICAM-Fc then blocked for non-specific binding with 2.5% BSA/PBS for 1 h at RT as previously [3] . T cells were washed with HBSS and 10 5 cells added to dishes containing HBSS/20 mM HEPES. Cells migrated for 15 min at 37°C prior to initiation of the experiment. Images were captured with an Olympus MTV3 Inverted microscope and a 20× lens or a Zeiss Axiovert 135TV Inverted microscope and a 63× lens plus AQM 2001 Kinetic Acquisition Manager software (Kinetic Imaging Ltd., Bromborough, UK). Cells were tracked using Motion Analysis software (Kinetic Imaging Ltd.) and data analysed using a Mathematica notebook (Wolfram Research Europe Ltd, Long Hanborough, UK) developed by Daniel Zicha (Cancer Research UK, London). ii.
Show full methods section
Inhibitors, antibodies and other reagents LFA-1 mAbs 38 and YTH 81.5 were produced at Cancer Research UK and Fab' fragments of mAb YTH81.5 directly conjugated to Alexa-488 fluorochrome as previously described [3] . Calpain 2 mAb 3A11D12 was kindly provided by Dr. Mitsuchi Inomata [50] . The following mAbs were purchased: calpain 1, Calbiochem; calpain 2, Research Diagnostics; α-tubulin, Sigma. The calpain inhibitors were purchased from Merck Biosciences: calpeptin (50 µg/ml unless stated) and PD150606 (50 µg/ml). The following reagents were purchased as indicated: 2-APB, Merck Bioscience; lanthanum chloride (LaCl 3 ), Sigma; SKF-96365, Sigma; pre-designed siRNAs for calpain 1 (ID 146578), calpain 2 (ID 112796 and 145947), and siRNA control #2 were all from Ambion; CAPN1 13 and 10, CAPN2 1 and 6 and negative control were from Qiagen. Cell isolation, culture and electroporation Peripheral blood mononuclear cells were prepared from single donor leukocyte buffy coats (National Blood Service) and T cells expanded as previously described and used between days 10 and 14 [21] . The human CD3 - leukemic T cell line, HSB2 was maintained in RPMI 1640/10% FCS [51] . Human polyclonal, non-transformed T cell lines from an ORAI1-mutated patient and wild type control were generated as previously described [34] and maintained in RPMI/10% FCS in the presence of IL-2. For siRNA knockdown experiments, HSB2 T cells line were washed twice in OptiMEM+GlutaMAX (Invitrogen) and electroporation was performed on 2×10 7 cells with 200–400 nM siRNAs using a Gene Pulser with Capacitance Extender (Bio-Rad) set at 960 µFD and 260 mV as previously described [3] . The siRNA-electroporated cells were maintained in RPMI 1640/10% FCS for 24 h prior to use. The efficiency of knockdown was evaluated by Western blot analysis for calpain with quantification using NIH image 1.63 software. Microscopy i. Video microscopy 35 mm glass bottomed petri dishes (MatTek Corp., Ashland Mass. USA) or or µ-slides VI (Ibidi, Thistle Scientific Ltd, Glasgow, UK) were coated overnight at 4°C with 3 µg/ml ICAM-Fc then blocked for non-specific binding with 2.5% BSA/PBS for 1 h at RT as previously [3] . T cells were washed with HBSS and 10 5 cells added to dishes containing HBSS/20 mM HEPES. Cells migrated for 15 min at 37°C prior to initiation of the experiment. Images were captured with an Olympus MTV3 Inverted microscope and a 20× lens or a Zeiss Axiovert 135TV Inverted microscope and a 63× lens plus AQM 2001 Kinetic Acquisition Manager software (Kinetic Imaging Ltd., Bromborough, UK). Cells were tracked using Motion Analysis software (Kinetic Imaging Ltd.) and data analysed using a Mathematica notebook (Wolfram Research Europe Ltd, Long Hanborough, UK) developed by Daniel Zicha (Cancer Research UK, London). ii.
Live cell imaging of LFA-1 distribution
T cells (2×10 5 /ml) were labelled with Alexa488-conjugated YTH81.5 Fab' fragments (10 µg/ml) for 15 min at 37°C, washed and added to ICAM-1Fc-coated MatTek dishes as described above. T cells were allowed to migrate for 20 min ±50 µg/ml calpeptin, then images were taken at 10 second intervals using a Zeiss Axiovert microscope and a LSM-510 laser scanning system. iii.
Live cell imaging of calpain activity T cells or HSB2
T cells at 5×10 6 cells/ml were labelled with the calpain substrate CMAC, t -BOC-Leu-Met (20 µM; Invitrogen) for 10 min at 37°C [52] , washed and added to ICAM-1Fc-coated MatTek or µ-slide VI dishes as described above. Images were taken using a Zeiss Axiovert microscope with Blue Diode and a LSM-510 laser scanning system within 20 min. iv.
Confocal microscopy
T lymphoblasts ± calpeptin, exposed to ICAM-1Fc coated coverslips for 40 min at 37°C, were fixed with 3% formaldehyde in HBSS for 20 min at RT. Coverslips were incubated with 10 µg/ml of LFA-1 mAb in HBSS containing 0.25% BSA for 1 h at RT. Cells were permeabilised with 0.1% Triton-X-100, for 4 min at RT then incubated with 2.5 units/ml Alexa 546-phalloidin and Alexa 488-goat anti-mouse IgG (1∶200; Invitrogen) for 1 h at RT. Finally, coverslips were mounted in Mowiol antifadent (Merck Biosciences) and images collected on a Zeiss Axioplan microscope with a LSM510 laser scanning system. v. Live cell imaging of T cell Ca 2+ T cells were labelled with Fluo-4 (1 mM; Invitrogen) plus 10% w/v Pluronic 127 (Invitrogen) for 60 min at 37°C, washed and added to ICAM-1Fc-coated dishes (MatTek) as described above. Cells were visualized by phase contrast and the Ca 2+ flux by excitation at 480 nm and emission at 516 nm. Images were taken at 30 sec intervals using a Zeiss Axioplan microscope with a LSM510 laser scanning system. SDS-PAGE and Western blotting of calpain siRNA treated HSB2 cell extracts HSB2 T cells were lysed at 5×10 7 /ml for 20 min on ice in 50 mM Tris pH7.4 containing 150 mM NaCl, 1% Triton X-100, 20 µg/ml PMSF and a complete protease inhibitor cocktail tablet (Roche). The lysate was microfuged for 15 min to remove insoluble material. Proteins were separated under reducing conditions by SDS-PAGE. After transfer to nitrocellulose membrane and incubation with antibodies, bound antibody was detected with HRP-conjugated sheep anti-mouse Ig (GE Healthcare, UK) and ECL Western blotting detection reagents (GE Healthcare).
Statistical Analysis
The significance of the migration assays was determined using 2 Way Anova (Mathematica notebook (Wolfram Research) further developed by Daniel Zicha (Cancer Research UK)). The significance of other analyses ( Fig. 2A , 3D ) was tested using the unpaired Student t test (GraphPad Prism software version 5 for Macintosh computers). Fisher's Exact Test was used to the analyse the pooled data from 2-5 experiments represented in Fig. 5D . The following significant differences are as indicated: *, P
📊 Figures
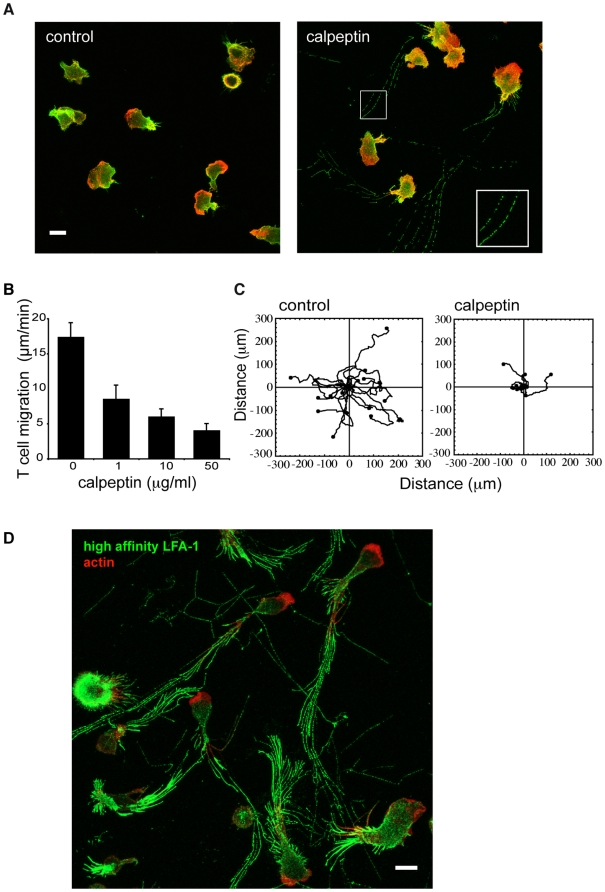
Figure 1
Calpain regulation of T cell migration.
( A ) T lymphoblasts were allowed to migrate for 15 min on ICAM-1 in the presence or absence of calpain inhibitor, calpeptin, before fixation. Total LFA-1 was detected using anti-LFA-1 mAb 38 and F-ac...

Figure 2
The effect of calpain inhibition and location of active calpain in T cells.
( A ) Effect of calpain inhibition on T cell morphology. The proportion of untreated and calpeptin-treated T cells with a detached uropod (nu200a=u200a50 per data set). Representative images of untrea...

Figure 3
Effect of Ca 2+ channel inhibitors on calpain activity and T cell migration.
Effect of ion channel inhibitors 2-APB (50 u00b5M), SKF-96365 (100 u00b5M), LaCl 3 (2 mM) on the following ( Au2013D ): ( A ) Calpain activity as detected by expression of calpain substrate CMAC, t -B...
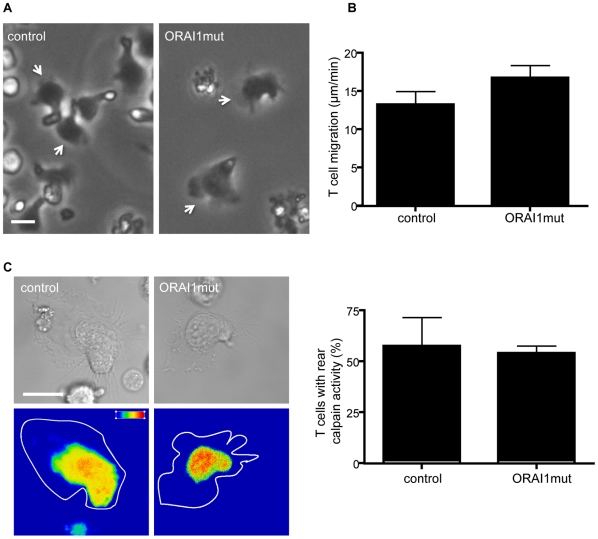
Figure 4
Investigation of ORAI1 mutant T cell calpain activity and migration.
( A ) Morphology of control and ORAI1 mutant T cell lines migrating on ICAM-1. White arrow indicates the leading edge of the T cell; nu200a=u200a3 complete sets of experiments for each cell line; ( B ...

Figure 5
Calpain activity at the rear of the T cell is due to calpain 2.
( A ) Immunofluorescent staining of fixed T cells migrating on ICAM-1. The images are composites of Z sections taken through the cell. Calpain mAbsu200a=u200agreen; F-actinu200a=u200ared. Scale baru20...
Figure images are served from the NIH/NLM PubMed Central Open Access Subset or Europe PMC; copyright remains with the publishers and authors.
💬 Discussion
0 commentsNo comments yet. Be the first to start a discussion!
Leave a Comment