Abstract
Accurate chromosome segregation requires assembly of the multiprotein kinetochore complex. Prior work has identified more than 100 different kinetochore components in human cells. However, little is known about the regulatory processes that specify their assembly upon mitotic entry and disassembly at mitotic exit. In this paper, we used a live-cell imaging-based assay to quantify kinetochore disassembly kinetics and systematically analyze the role of potential regulatory mechanisms in controlling kinetochore assembly state. We find that kinetochore assembly and disassembly was driven primarily by mitotic phosphorylation downstream of cyclin-dependent kinase (CDK). In addition, we demonstrate that nuclear exclusion of the Ndc80 complex helped restrict kinetochore formation to mitosis. Combining constitutive CDK-dependent phosphorylation of CENP-T and forced nuclear localization of the Ndc80 complex partially prevented kinetochore disassembly at mitotic exit and led to chromosome segregation defects in subsequent divisions. In total, we find that the coordinated temporal regulation of outer kinetochore assembly is essential for accurate cell division.
🔬 Techniques
🧬 Organisms
💻 Software
✨ Fluorophores
🧪 Sample Preparation
🔬 Cell Lines
🏭 Microscope Brands
🧪 Reagent Suppliers
📷 Detectors
💻 Software Details
🏛️ Research Organizations (ROR)
Affiliated research institutions:
📋 Methods
Cell culture and transfection
Human cell lines were maintained in DMEM supplemented with 100 U/ml streptomycin, 100 U/ml penicillin, 2 mM glutamine, and 10% (vol/vol) fetal calf serum. All cells were cultured at 37°C with 5% CO 2 . HeLa LacZeo/TO cells (a gift from S. Taylor, University of Manchester, Manchester, England, UK) were maintained in 2 µg/ml Blasticidin and 200 µg/ml Zeocin. Cells expressing tetracycline-inducible GFP LAP or mCherry LAP fusions were generated by Flp recombinase–mediated integration of a pCDNA5-FRT-TO–based plasmid (Invitrogen). Cells were then maintained in 2 µg/ml Blasticidin and 400 µg/ml Hygromycin B. Clonal cell lines constitutively expressing GFP LAP or mCherry LAP fusions were generated using retroviral infection of HeLa cells with a pBABE-blast– or pBABE-Puromycin–based vector. See Table S1 for a list of cell lines used in this study. Transient transfection of cells with plasmids encoding mCherry-Ran T24N and mCherry-Dsn1 K-R was performed with transfection reagent (Effectene; QIAGEN) according to the manufacturer’s instructions. Codon-optimized and RNAi-resistant CENP-T (Mr. Gene) was used in all experiments. RNAi-resistant Ndc80 was generated by site-directed mutation (Agilent Technologies) of siRNA-targeting nucleotides in the human coding sequence. siRNA transfections were performed using Lipofectamine RNAiMAX (Invitrogen) according to the manufacturer’s instructions. Cells were analyzed 48 h after siRNA transfection unless stated otherwise. Nontargeting control siRNAs and gene-specific siRNAs were obtained from Thermo Fisher Scientific. Single siRNAs were used against CENP-T (5′-CGGAGAGCCCUGCUUGAAA-3′), Ndc80/Hec1 (5′-GAAGUUCAAAAGCUGGAUGAUCUU-3′), and PP2R2A–B55-α (5′-CUGCAGAUGAUUUGCGGAUUAUU-3′; Schmitz et al., 2010 ), and a pool of siRNAs was used against Skp1A (5′-CUACUUGCAUGUAAAGAAU-3′, 5′-GGAGAAAUGUAACUGGACA-3′, 5′-CUAGUAUGAUGGAAAGUUU-3′, and 5′-CGCAAGACCUUCAAUAUCA-3′).
Show full methods section
Cell culture and transfection
Human cell lines were maintained in DMEM supplemented with 100 U/ml streptomycin, 100 U/ml penicillin, 2 mM glutamine, and 10% (vol/vol) fetal calf serum. All cells were cultured at 37°C with 5% CO 2 . HeLa LacZeo/TO cells (a gift from S. Taylor, University of Manchester, Manchester, England, UK) were maintained in 2 µg/ml Blasticidin and 200 µg/ml Zeocin. Cells expressing tetracycline-inducible GFP LAP or mCherry LAP fusions were generated by Flp recombinase–mediated integration of a pCDNA5-FRT-TO–based plasmid (Invitrogen). Cells were then maintained in 2 µg/ml Blasticidin and 400 µg/ml Hygromycin B. Clonal cell lines constitutively expressing GFP LAP or mCherry LAP fusions were generated using retroviral infection of HeLa cells with a pBABE-blast– or pBABE-Puromycin–based vector. See Table S1 for a list of cell lines used in this study. Transient transfection of cells with plasmids encoding mCherry-Ran T24N and mCherry-Dsn1 K-R was performed with transfection reagent (Effectene; QIAGEN) according to the manufacturer’s instructions. Codon-optimized and RNAi-resistant CENP-T (Mr. Gene) was used in all experiments. RNAi-resistant Ndc80 was generated by site-directed mutation (Agilent Technologies) of siRNA-targeting nucleotides in the human coding sequence. siRNA transfections were performed using Lipofectamine RNAiMAX (Invitrogen) according to the manufacturer’s instructions. Cells were analyzed 48 h after siRNA transfection unless stated otherwise. Nontargeting control siRNAs and gene-specific siRNAs were obtained from Thermo Fisher Scientific. Single siRNAs were used against CENP-T (5′-CGGAGAGCCCUGCUUGAAA-3′), Ndc80/Hec1 (5′-GAAGUUCAAAAGCUGGAUGAUCUU-3′), and PP2R2A–B55-α (5′-CUGCAGAUGAUUUGCGGAUUAUU-3′; Schmitz et al., 2010 ), and a pool of siRNAs was used against Skp1A (5′-CUACUUGCAUGUAAAGAAU-3′, 5′-GGAGAAAUGUAACUGGACA-3′, 5′-CUAGUAUGAUGGAAAGUUU-3′, and 5′-CGCAAGACCUUCAAUAUCA-3′).
Immunofluorescence and microscopy
Where indicated, cells were incubated with 20 µM MG132 (Sigma-Aldrich), 5 µM Flavopiridol (CDKi; Sigma-Aldrich), 10 µM BI2536 (Plk1 inhibitor [Plki]; Tocris Bioscience), 2 µM AZ3146 (Mps1i; Tocris Bioscience), 2 µM ZM447439 (Aurora B inhibitor; Tocris Bioscience), or 0.66 µM nocodazole before fixation or live-cell imaging. For immunofluorescence analysis, cells were grown on glass coverslips. Where indicated, cytoplasmic contents were preextracted before fixation by incubation for 2 min in PBS + 1% (vol/vol) Triton X-100. Cells were fixed by incubation for 15 min in PBS + 4% (vol/vol) formaldehyde before incubation for 30 min in TBS + 3% (wt/vol) BSA + 0.1% (vol/vol) Triton X-100. Antibodies used for staining are listed in Table S2 . Cy2-, Cy3-, and Cy5-conjugated secondary antibodies were obtained from Jackson ImmunoResearch Laboratories, Inc. All antibodies were diluted in TBS + 3% BSA and incubated with cells for 1 h at room temperature. DNA was visualized by a 5-min incubation with 10 µg/ml Hoechst in PBS. Images were acquired on a deconvolution microscope (DeltaVision Core; Applied Precision) equipped with a charge-coupled device camera (CoolSNAP HQ2; Photometrics). For fixed-cell analysis, 40 z sections were acquired at 0.2-µm steps using a 60×, 1.3 NA U-Plan Apochromat objective (Olympus). Images were acquired at room temperature through glycerol-based mounting media. Cy2, Cy3, Cy5, or Hoechst florescence was observed using appropriate filters. Images were deconvolved using 10 cycles of enhanced ratio deconvolution on DeltaVision software (Applied Precision). For time-lapse imaging, cells were imaged in CO 2 -independent media (Invitrogen) at 37°C. Images were acquired every 2 min using six z sections at 0.7-µm intervals using a 40× U-Plan Apochromat/340 NA objective (Olympus). GFP or mCherry fluorescence was observed using appropriate filters. To quantify fluorescent intensity, maximum intensity projections were generated, and individual kinetochores were analyzed at each frame using MetaMorph software (Molecular Devices). Integrated fluorescence intensity was measured in a 7 × 7–pixel region containing a kinetochore. Background was subtracted by subtracting from this the integrated intensity from a 7 × 7–pixel region of cytoplasm in the same cell. At least 10 kinetochores were analyzed per cell. To visualize chromosome movement during live-cell imaging, cells were incubated for 30 min in 1 µg/ml Hoechst. Media were replaced with CO 2 -independent media without Hoechst before imaging. Online supplemental material Fig. S1 assesses factors controlling kinetochore assembly kinetics. Fig. S2 shows that inhibition of CDK, but not other mitotic kinases, affects kinetochore assembly. Fig. S3 shows that inhibition of Ndc80 complex disassembly does not cause immediate mitotic defects.
Table
S1 shows cell lines used in this study.
Table
S2 shows antibodies used to visualize kinetochore proteins. Online supplemental material is available at http://www.jcb.org/cgi/content/full/jcb.201301006/DC1 .
Online supplemental material Fig. S1 assesses factors controlling kinetochore assembly kinetics. Fig. S2 shows that inhibition of CDK, but not other mitotic kinases, affects kinetochore assembly. Fig. S3 shows that inhibition of Ndc80 complex disassembly does not cause immediate mitotic defects.
Table
S1 shows cell lines used in this study.
Table
S2 shows antibodies used to visualize kinetochore proteins. Online supplemental material is available at http://www.jcb.org/cgi/content/full/jcb.201301006/DC1 .
📊 Figures
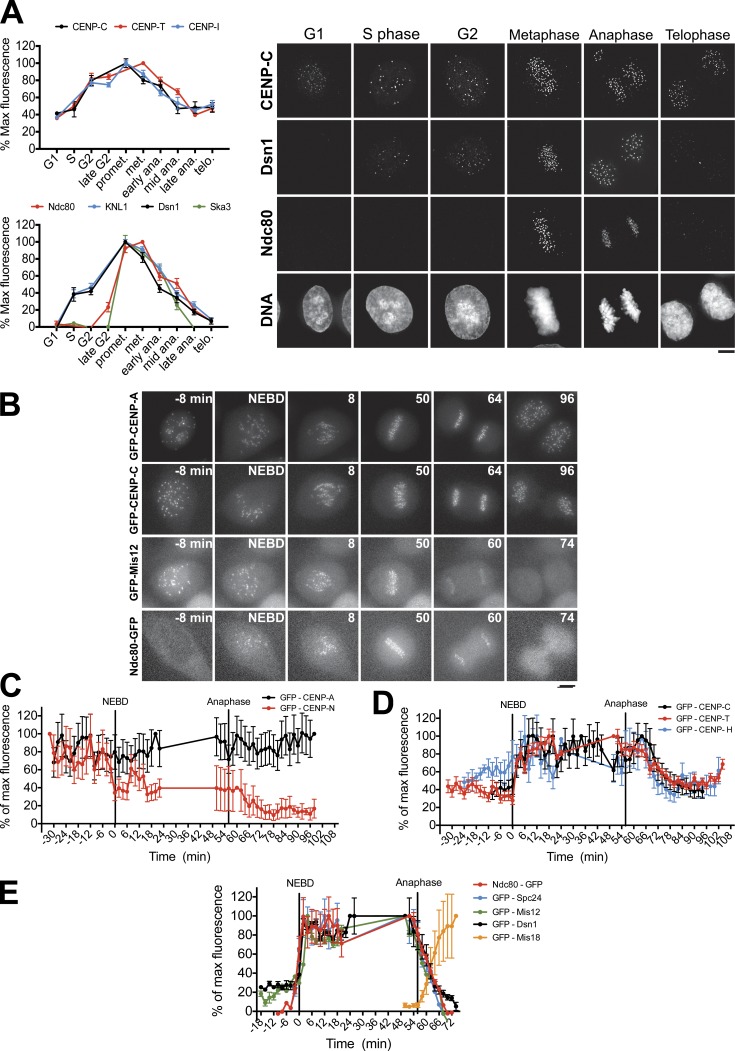
Figure 1.
Kinetochore proteins show distinct assembly and disassembly behaviors. (A, left) Quantification of centromere intensity in immunofluorescence images for the indicated proteins. promet., prometaphase; ...
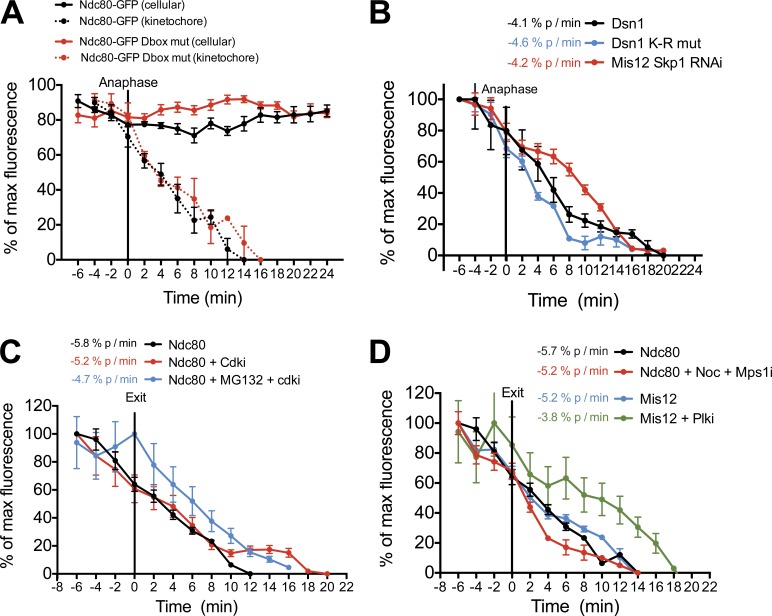
Figure 2.
Protein degradation and morphological changes at anaphase do not drive kinetochore disassembly. (Au2013D) Quantification of centromeric GFP intensities in cells exiting mitosis. At the onset of imagin...
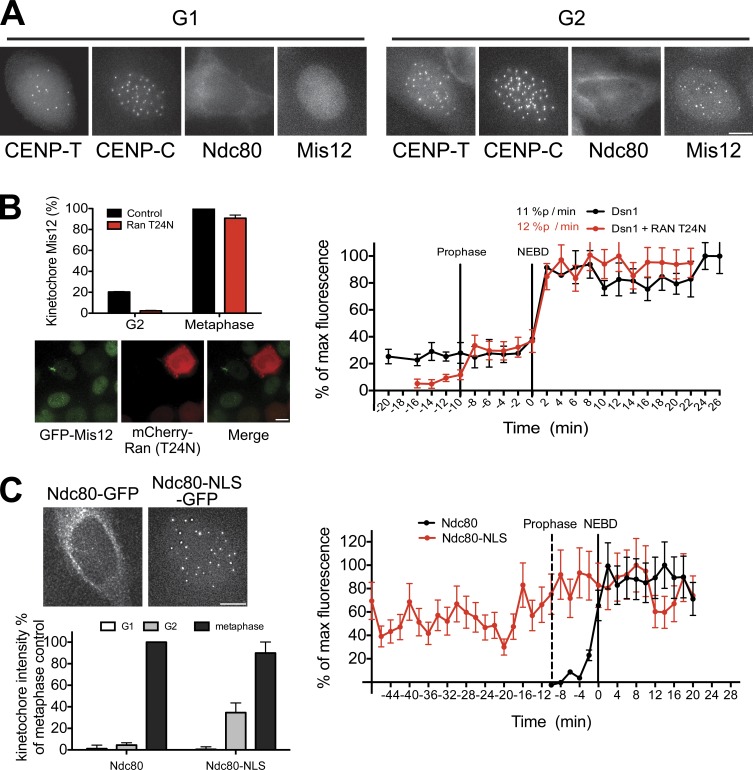
Figure 3.
Interphase localization of kinetochore proteins contributes to kinetochore assembly dynamics. (A) GFP-tagged protein localization for the indicated proteins and cell cycle stages. (B, bottom left) Ima...
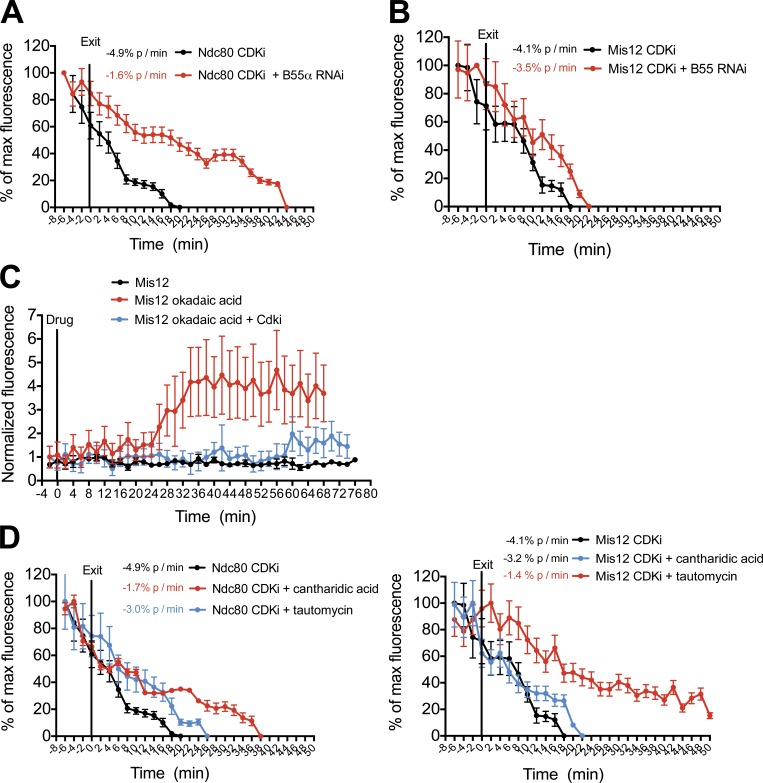
Figure 4.
CDK activity drives kinetochore assembly and disassembly. (Au2013E) Quantification of centromeric GFP intensity in cells exiting (A, B, D, and E) or entering (C) mitosis. Cells were imaged 48 h after ...
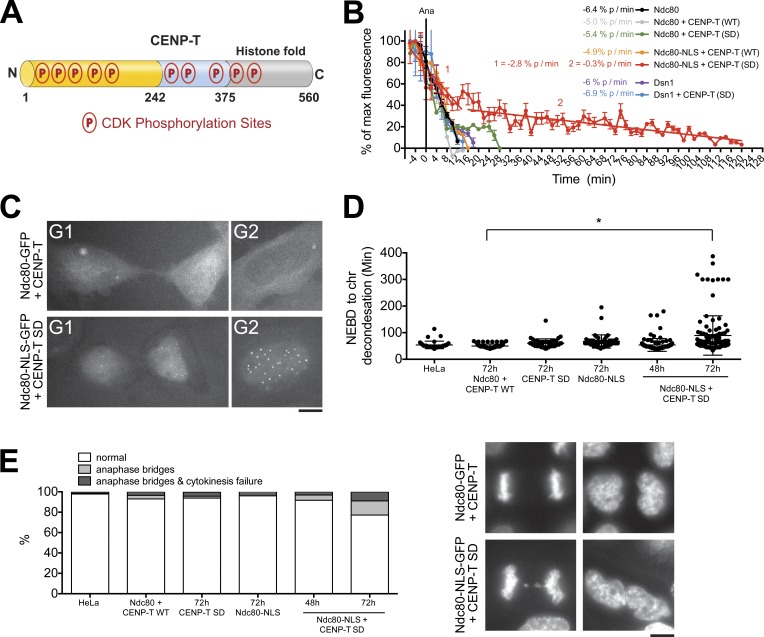
Figure 5.
CENP-T phosphorylation controls assembly of the Ndc80 complex at kinetochores. (A) Diagram of CDK-directed phosphorylation sites in CENP-T. The Ndc80 interaction region is shown in yellow. N, N termin...
Figure images are served from the NIH/NLM PubMed Central Open Access Subset or Europe PMC; copyright remains with the publishers and authors.
💬 Discussion
0 commentsNo comments yet. Be the first to start a discussion!
Leave a Comment