Abstract
Abstract Characterizing the long-term nanometer-scale interactions between lysosomes and mitochondria in live cells is essential for understanding their functions but remains challenging due to limitations of the existing fluorescent probes. Here, we develop cell-permeable organic fluorescent probes for lysosomes with excellent specificity and high photostability. We also use an existing Atto 647N dye with high brightness and excellent photostability to achieve specific labeling of mitochondria in live cells. Using these probes, we obtain dual-color structured illumination microscopy (SIM) images of dynamic physical lysosome-mitochondrion interactions in live cells at an ~90-nm resolution over a long time course of ~13 min. We successfully record the consecutive dynamic processes of lysosomal fusion and fission, as well as four types of physical lysosome-mitochondrion interactions by super-resolution imaging. Our probes provide an avenue for understanding the functions and the dynamic interplay of lysosomes and mitochondria in live cells.
🔬 Techniques
🔭 Microscopes
💻 Software
✨ Fluorophores
🧪 Sample Preparation
🔬 Cell Lines
🏭 Microscope Brands
🧪 Reagent Suppliers
📷 Detectors
🔎 Objectives
💻 Software Details
💾 Data Repositories
🏛️ Research Organizations (ROR)
Affiliated research institutions:
📋 Methods
Synthesis of lysosomal probes
The organic probes for lysosomes were constructed from two parts. One part (referred to as the peptide part, detailed structure shown in Supplementary Fig. 1 ) contains the recognition unit (epoxysuccinyl scaffold), the cell-penetrating peptide (rR) 3 R 2 , and a short peptide GKGKGK, in which lysines offer free active amino groups available to conjugate with commercially available dyes via an N-hydroxysuccinimidyl (NHS) group. The other part is a commercially available fluorescent dye containing an N-hydroxysuccinimidyl (NHS) group. The two parts were linked via covalent bonds to form an entire lysosomal probe (see Supplementary Note 1 ). The peptide part was prepared by solid-phase peptide synthesis (Supplementary Note 2 ) and was purified by preparative high-performance liquid chromatography (HPLC) to a purity of >95%, and its mass was confirmed by electrospray ionization mass spectrometry (EI-MS) (Supplementary Fig. 1b, c ). Before conjugation to dyes, the peptide part was dissolved in bicarbonate buffer (0.1 M, pH 8.3) at a concentration of 1 mM and stored at 4 °C. The commercial available dyes Alexa Fluor 647 (Thermo Fisher Scientific, Inc.), Atto 488 (Sigma-Aldrich Co., LLC), and Atto 565 (Sigma-Aldrich Co., LLC) containing a N-hydroxysuccinimidyl (NHS) moiety were dissolved with anhydrous dimethylformamide (DMF; Sigma-Aldrich Co., LLC), divided into small aliquots in multiple tubes (40 μg of Alexa Fluor 647, 21 μg of Atto 565, or 30 μg of Atto 488 in each tube), evaporated to dryness in a vacuum centrifuge, and stored at −20 °C. For the conjugation, an aliquot of each dye was dissolved with 10–20 µL of anhydrous dimethyl sulphoxide (DMSO; Sigma-Aldrich Co., LLC) or DMF, added to 14 µL of the peptide part solution, and mixed thoroughly. The mixture was allowed to react at room temperature overnight with constant shaking. Then the mixture was purified using Pierce C18 Spin columns (Thermo Fisher Scientific, Inc.) according to the manufacturer’s instructions. After purification, the supernatant was evaporated to dryness in a vacuum centrifuge and the residue was dissolved in 200 µL of Phosphate Buffered Saline (PBS, pH 7.4; Thermo Fisher Scientific, Inc.) to generate a stock solution of the lysosomal probe.
Show full methods section
Synthesis of lysosomal probes
The organic probes for lysosomes were constructed from two parts. One part (referred to as the peptide part, detailed structure shown in Supplementary Fig. 1 ) contains the recognition unit (epoxysuccinyl scaffold), the cell-penetrating peptide (rR) 3 R 2 , and a short peptide GKGKGK, in which lysines offer free active amino groups available to conjugate with commercially available dyes via an N-hydroxysuccinimidyl (NHS) group. The other part is a commercially available fluorescent dye containing an N-hydroxysuccinimidyl (NHS) group. The two parts were linked via covalent bonds to form an entire lysosomal probe (see Supplementary Note 1 ). The peptide part was prepared by solid-phase peptide synthesis (Supplementary Note 2 ) and was purified by preparative high-performance liquid chromatography (HPLC) to a purity of >95%, and its mass was confirmed by electrospray ionization mass spectrometry (EI-MS) (Supplementary Fig. 1b, c ). Before conjugation to dyes, the peptide part was dissolved in bicarbonate buffer (0.1 M, pH 8.3) at a concentration of 1 mM and stored at 4 °C. The commercial available dyes Alexa Fluor 647 (Thermo Fisher Scientific, Inc.), Atto 488 (Sigma-Aldrich Co., LLC), and Atto 565 (Sigma-Aldrich Co., LLC) containing a N-hydroxysuccinimidyl (NHS) moiety were dissolved with anhydrous dimethylformamide (DMF; Sigma-Aldrich Co., LLC), divided into small aliquots in multiple tubes (40 μg of Alexa Fluor 647, 21 μg of Atto 565, or 30 μg of Atto 488 in each tube), evaporated to dryness in a vacuum centrifuge, and stored at −20 °C. For the conjugation, an aliquot of each dye was dissolved with 10–20 µL of anhydrous dimethyl sulphoxide (DMSO; Sigma-Aldrich Co., LLC) or DMF, added to 14 µL of the peptide part solution, and mixed thoroughly. The mixture was allowed to react at room temperature overnight with constant shaking. Then the mixture was purified using Pierce C18 Spin columns (Thermo Fisher Scientific, Inc.) according to the manufacturer’s instructions. After purification, the supernatant was evaporated to dryness in a vacuum centrifuge and the residue was dissolved in 200 µL of Phosphate Buffered Saline (PBS, pH 7.4; Thermo Fisher Scientific, Inc.) to generate a stock solution of the lysosomal probe.
Cell culture
Human osteosarcoma cell line (U2OS, Cat. Number: CX0318) cells were purchased from Boster Biological Technology Co., Ltd., Wuhan, China, and cultured in McCoy’s 5A medium (Thermo Fisher Scientific, Inc.). All media were supplemented with 10% (v/v) fetal bovine serum (FBS; Thermo Fisher Scientific, Inc.), and the cultures were maintained at 37 °C in a humidified 5% CO 2 environment. For starvation treatment, live U2OS cells were incubated in McCoy’s 5 A medium without FBS for 4 h before imaging.
Live-cell labeling
For lysosomal staining, U2OS cells were seeded in Nunc Glass Bottom Dishes (Φ 12 mm, Thermo Fisher Scientific, Inc.) at a density of 1.5–2.0 × 10 4 per well in growth medium (150 µL). After an overnight incubation, the cells were washed three times with PBS. Solutions of the indicated lysosomal probes at different concentrations were prepared by diluting different volumes (i.e., 14–71 µL) of the stock solution with PBS to a final volume of 100 µL. After adding a solution of the indicated probe diluted in PBS, the cells were incubated in a 5% CO 2 atmosphere at 37 °C for 30 min. Then, the supernatant was discarded, and the cells were post-incubated with growth medium in a 5% CO 2 atmosphere at 37 °C for 4 h prior to SIM imaging. For dual staining, other probes were added to the dishes after the 4 h incubation with growth medium. For mitochondrial labeling, an aliquot of Atto 647N (25 μg, Sigma-Aldrich Co., LLC) was dissolved in 10 µL of DMSO and was diluted with PBS to a total volume of 100 µL (3–15 µM). The cells were then incubated with the probe solution in a 5% CO 2 atmosphere at 37 °C for 30 min; afterwards, the supernatant was discarded. For commercially available probes, the cells were incubated with LysoTracker Green (50 nM, 100 µL; Thermo Fisher Scientific, Inc.), LysoTracker Red (50–1000 nM, 100 µL; Thermo Fisher Scientific, Inc.) or MitoTracker Green (400 nM, 100 µL; Thermo Fisher Scientific, Inc.) in a 5% CO 2 atmosphere at 37 °C for 30 min; afterwards, the supernatant was discarded. Before imaging, a solution of Trypan blue (100 µL, 1 mg·mL −1 ; Sigma-Aldrich Co., LLC) in PBS was added to exclude the dead cells and quench the extracellular fluorescence from the probes bound to either the cell membrane or the dish surface 40 . After 1 min, Trypan blue was removed, and the cells were washed twice gently with PBS and immersed in phenol red-free DMEM (Thermo Fisher Scientific, Inc.) with 1 mM (±)−6-hydroxy-2,5,7,8-tetramethylchromane-2-carboxylic acid (Trolox; Sigma-Aldrich Co., LLC) prior to optical imaging.
MTS assay
The cytotoxicity of the probes for lysosomes and mitochondria on U2OS cells was tested using a MTS assay. Solutions of the lysosomal probes were prepared by diluting 43 µL of a stock solution with PBS to a final volume of 100 µL. U2OS cells (4 × 10 3 cells per well) were seeded into a 96-well plate and cultured in growth medium for 24 h. The cells were incubated with the solution of the probes (Lysosome-488, Lysosome-565, Lysosome-647, or Atto 647N (15 µM)) in PBS in a 5% CO 2 atmosphere at 37 °C for 30 min. Then the supernatant was replaced by 100 µL of growth medium, and 20 µL of CellTiter 96 AQueousOne Solution Reagent (Promega Co.) was added into each well. The cells were incubated for 3 h at 37 °C in a 5% CO 2 atmosphere. The absorbance was recorded at 492 nm using a TECAN GENios Plus ELISA reader (Tecan, Inc.). The cell viabilities were expressed as the percentage of the A492 of the probe-treated cells to the untreated controls, and all of the measurements were performed in triplicate. Determination of cathepsin activity Cathepsin B/H Activity Assay Kits (Abnova Co., Ltd.) were used to determine cathepsin B/H activity in live cells. Live U2OS cells were incubated with solutions of Lysosome-565, Lysosome-647, or untreated at 37 °C for 30 min, respectively. Solutions of the indicated lysosomal probes were prepared by diluting 43 µL of the stock solution with PBS (pH 7.4) to a final volume of 100 µL. The cells were post-incubated with growth medium for 4 h to reduce background fluorescence. Then the cells were dissociated, and 2 × 10 5 of the cells were collected in 1.5-mL Eppendorf tubes by centrifugation and lysed in 10 μL of chilled Cell Lysis Buffer for 10 min. Then the tubes were centrifuged 15,700 ×g for 5 min and the clear lysate was transferred into new tubes. 3 μL of the clear lysate, 50 μL of Cell Lysis Buffer, 50 μL of Reaction Buffer, and 2 μL of Substrate Ac-RR-AFC/R-AFC were added into 96 wells. For determining the background, 50 μL of Cell Lysis Buffer, 50 μL of Reaction Buffer, and 2 μL of Inhibitor were added into 96 wells. The solutions were mixed well and incubated at 37 °C for 1 h. Results were analyzed using a PerkinElmer Envision fluorescence plate reader (Excitation/Emission = 400/505 nm; PerkinElmer, Inc.), as described in the kit instructions. The cathepsin activities were expressed as the percentage of the relative fluorescence units of the probe-treated cells to the untreated controls, and all of the measurements were performed in triplicate.
Confocal laser scanning microscopy
The images were obtained using a LSM-710 confocal laser scanning microscope (Carl Zeiss, Inc.) equipped with a 63×/1.49 numerical aperture oil-immersion objective lens and were analyzed with ZEN 2012 (Carl Zeiss, Inc.) and ImageJ software (National Institutes of Health). All fluorescence images were analyzed and the background subtracted with ImageJ software. Pearson’s coefficient 41 was quantified using the Colocalisation Analysis plugin for ImageJ.
SIM imaging
Super-resolution images were acquired on a N-SIM microscope (Nikon Instruments, Inc.) equipped with an Apochromat 100 × /1.49 numerical aperture oil-immersion objective lens and solid-state lasers (488 nm, rated power ≥ 200 mW; 561 nm, rated power ≥ 150 mW; 647nm, rated power ≥ 100 mW). Images were captured with an electron-multiplying charge coupled device (EMCCD) camera (Andor; 512 × 512 px, 14 bit) with a gain value of 100. Raw SIM images (containing nine images: three phases and three angles) were obtained and reconstructed with Nikon Elements software (Nikon Instruments, Inc.). The exposure time was set to 30 ms for each raw data capture (each single-color SIM frame was acquired over 270 ms in total). SIM frames were deliberately spaced at 1-s, 6-s, 10-s or 1-min intervals according to the purpose of each experiment. SIM images were analyzed with Nikon Elements and ImageJ software, and tested by using the ImageJ plugin SIMcheck 18 to assess the image quality. Detailed information regarding the imaging conditions used for SIM imaging is summarized in Supplementary Table 2 .
Data availability
The authors declare that all data supporting the findings of this study are available within the article and its Supplementary Information files or from the corresponding authors on reasonable request.
Electronic supplementary material Supplementary Information Description of Additional Supplementary Files Supplementary Movie 1 Supplementary Movie 2 Supplementary Movie 3 Supplementary Movie 4 Supplementary Movie 5 Supplementary Movie 6
📊 Figures
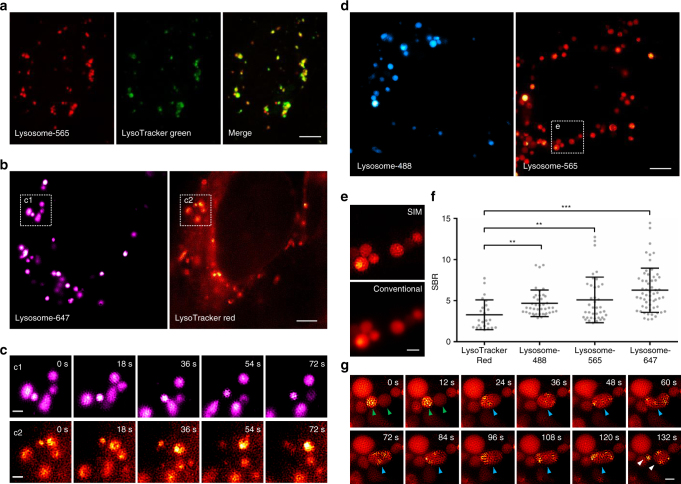
Fig. 1
Characterization of the lysosomal probes in live cells. a A co-localization study employing LysoTracker Green as the standard lysosomal marker. Live U2OS cells were simultaneously stained with Lysosom...
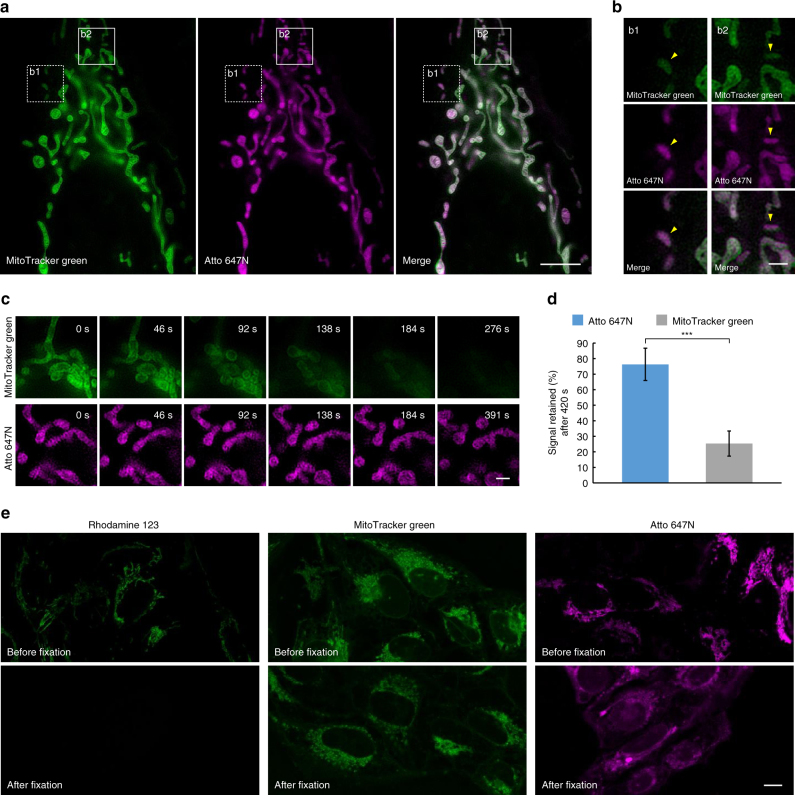
Fig. 2
Characterization of Atto 647N in live cells. a A co-localization study employing MitoTracker Green as the standard mitochondrial marker. Live U2OS cells were simultaneously stained with MitoTracker Gr...
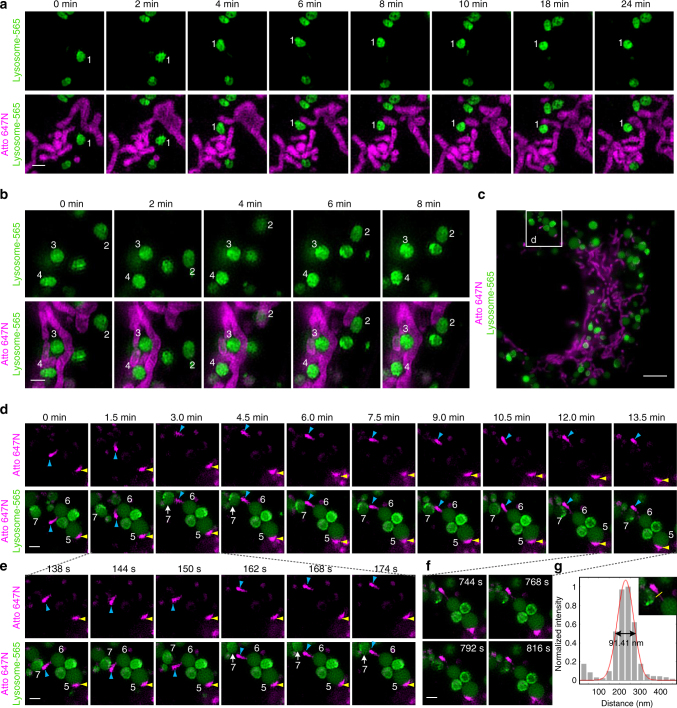
Fig. 3
Dual-color SIM images of lysosomes and mitochondria in live cells. a , b , d , e , f Representative time-lapse SIM images reveal different types of dynamic physical interactions between lysosomes and ...
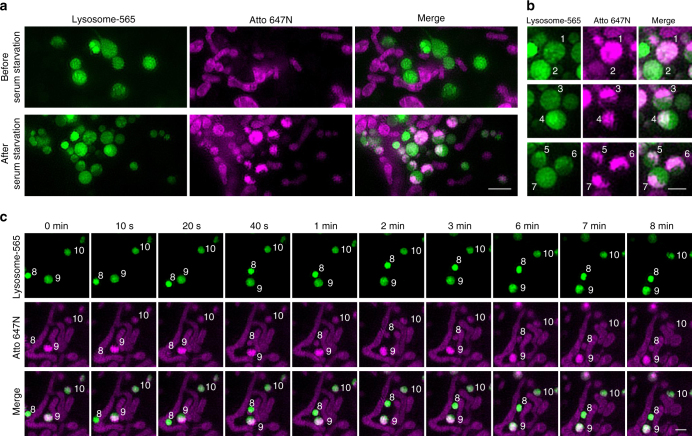
Fig. 4
Determination of co-localization of mitochondria with lysosomes during mitophagy. a Dual-color SIM images of lysosomes (green) and mitochondria (magenta) before and after serum starvation in live U2OS...
Figure images are served from the NIH/NLM PubMed Central Open Access Subset or Europe PMC; copyright remains with the publishers and authors.
💬 Discussion
0 commentsNo comments yet. Be the first to start a discussion!
Leave a Comment