Abstract
Cellular integrity and morphology of most bacteria is maintained by cell wall peptidoglycan, the target of antibiotics essential in modern healthcare. It consists of glycan strands, cross-linked by peptides, whose arrangement determines cell shape, prevents lysis due to turgor pressure and yet remains dynamic to allow insertion of new material, and hence growth. The cellular architecture and insertion pattern of peptidoglycan have remained elusive. Here we determine the peptidoglycan architecture and dynamics during growth in rod-shaped Gram-negative bacteria. Peptidoglycan is made up of circumferentially oriented bands of material interspersed with a more porous network. Super-resolution fluorescence microscopy reveals an unexpected discontinuous, patchy synthesis pattern. We present a consolidated model of growth via architecture-regulated insertion, where we propose only the more porous regions of the peptidoglycan network that are permissive for synthesis.
🔬 Techniques
🧬 Organisms
💻 Software
✨ Fluorophores
🧪 Sample Preparation
🏭 Microscope Brands
🧪 Reagent Suppliers
🎨 Filters
💻 Software Details
🏛️ Research Organizations (ROR)
Affiliated research institutions:
📋 Methods
Purification of peptidoglycan
Peptidoglycan was purified using a standard procedure for Gram-negative organisms (see Supplementary Table S1 for strains and growth conditions). Cells were grown to exponential phase (optical density (OD) 600 ~0.3) or stationary phase (OD 600 ~1), chilled on ice, collected by centrifugation (8,000 g , 10 min) and resuspended in PBS at 4 °C. Where stated, samples were broken by the French press at 4 °C. Breakage was confirmed by optical microscopy. The PBS suspension was then added dropwise to boiling 5% w/v SDS in distilled water. The resulting mixture was then boiled for 30 min and washed three times by ultracentrifugation (400 000 g for 15 min at room temperature). This was resuspended in sodium phosphate buffer (50 mM, pH 7.3) containing 100 μg ml −1 α-chymotrypsin and 0.05% w/v sodium azide, and incubated overnight at 37 °C, with agitation at 250 r.p.m. Material was collected by ultracentrifugation then resuspended in 5% w/v SDS and boiled for 30 min. The resulting suspension was washed twice by ultracentrifugation as before, and then resuspended in HPLC grade water, aliquoted and flash frozen with liquid nitrogen. In exception to this method, E. coli (BL21 and W3110) and C. crescentus cells were added directly to SDS before boiling. There was no apparent difference between this method, SDS treatment and that described above. Further purification was as above.
Preparation of AFM samples
Aliquots of sacculi were defrosted at 4 °C, diluted in 5 mM HCl and incubated at room temperature for 10 min, to aid dispersal of sacculi. C. crescentus sacculi were placed in an ultrasonic bath for 20 min to aid dispersal; this did not interfere with sacculus architecture. A 10-μl drop was applied to freshly cleaved mica, dried with flowing nitrogen, then washed three times with HPLC grade water before further nitrogen drying.
Show full methods section
Purification of peptidoglycan
Peptidoglycan was purified using a standard procedure for Gram-negative organisms (see Supplementary Table S1 for strains and growth conditions). Cells were grown to exponential phase (optical density (OD) 600 ~0.3) or stationary phase (OD 600 ~1), chilled on ice, collected by centrifugation (8,000 g , 10 min) and resuspended in PBS at 4 °C. Where stated, samples were broken by the French press at 4 °C. Breakage was confirmed by optical microscopy. The PBS suspension was then added dropwise to boiling 5% w/v SDS in distilled water. The resulting mixture was then boiled for 30 min and washed three times by ultracentrifugation (400 000 g for 15 min at room temperature). This was resuspended in sodium phosphate buffer (50 mM, pH 7.3) containing 100 μg ml −1 α-chymotrypsin and 0.05% w/v sodium azide, and incubated overnight at 37 °C, with agitation at 250 r.p.m. Material was collected by ultracentrifugation then resuspended in 5% w/v SDS and boiled for 30 min. The resulting suspension was washed twice by ultracentrifugation as before, and then resuspended in HPLC grade water, aliquoted and flash frozen with liquid nitrogen. In exception to this method, E. coli (BL21 and W3110) and C. crescentus cells were added directly to SDS before boiling. There was no apparent difference between this method, SDS treatment and that described above. Further purification was as above.
Preparation of AFM samples
Aliquots of sacculi were defrosted at 4 °C, diluted in 5 mM HCl and incubated at room temperature for 10 min, to aid dispersal of sacculi. C. crescentus sacculi were placed in an ultrasonic bath for 20 min to aid dispersal; this did not interfere with sacculus architecture. A 10-μl drop was applied to freshly cleaved mica, dried with flowing nitrogen, then washed three times with HPLC grade water before further nitrogen drying.
Preparation of AFM samples without drying
Aliquots were defrosted at 4 °C then diluted in sodium citrate/citric acid buffer (10 mM, pH 3) and incubated at room temperature for 10 min. In parallel with this incubation, 50 μl of nickel chloride (15 mM in 5 mM HCl) was applied to freshly cleaved mica and incubated for 10 min. The nickel–mica was washed three times with HPLC grade water and dried with nitrogen. Then, 50 μl of sacculus suspension was applied to the nickel–mica and incubated for 1 h, and subsequently washed three times with HPLC grade water and transferred to the AFM without being allowed to dry. Preparation of AFM samples for mechanical stretching (“The Rack”) A large glass coverslip was glued to a glass slide to provide a flat substrate. Polydimethylsiloxane (PDMS, QSil 216, ACC Silicones) was prepared by mixing the polymer 10:1 w/w with the cross-linker, then degassing using a vacuum pump to avoid bubbles. The liquid PDMS was then cast against the coverslip by baking at 60 °C for at least 2 h. The resulting sheet of PDMS (~2 mm thick) was cut into a dogbone shape with a razorblade so as to fit the stretching apparatus. A 21 μg ml −1 Cell Tack solution 31 was prepared in sodium bicarbonate buffer (100 mM, pH 8.3). Then, 30 μl of the solution was pipetted onto the PDMS and incubated for 15 min before being washed 15 times with HPLC grade water. Without allowing the surface to fully dry, 10 μl of sacculus suspension in 1 mM HCl was added and the surface subsequently dried with nitrogen.
AFM imaging
AFM imaging was carried out using a Multimode AFM with extended Nanoscope III controller, apart from the mechanical stretching experiments that were conducted on a Dimension AFM with Nanoscope IV controller. All imaging was carried out in tapping mode. Silicon cantilevers (Olympus AC160TS) were used for imaging in ambient conditions. Silicon nitride cantilevers with silicon tips (Bruker SNL, k~0.32 Nm −1 ) were used for imaging in liquid. For thickness measurements, the AFM was calibrated using silicon atomic steps (NT-MDT, STEPP). AFM image processing, including a three-dimensional display of data, was carried out using Gwyddion (version 2 or later).
Pore-size measurements
Two roughly orthogonal measurements were taken and averaged for each pore. Sample roughness precluded use of thresholding measurements. In situ enzyme digests Samples were prepared as described above, loaded into the AFM and allowed to equilibrate for several hours under “Buffer A” (10 mM Tris HCl, 1 mM calcium chloride, pH 7.5), then imaged. Enzymes were added (to 10 μg ml −1 ) to the fluid cell by exchanging buffer A for the same, but containing the enzyme of interest. This was done with the tip retracted using the z-piezo. Several exchanges of buffer containing enzyme were carried out in the course of the experiments to counter reduction in buffer volume owing to evaporation. Mechanical stretching A home-built stretching apparatus (“The Rack”) was constructed comprising two opposing stepper motors mounted with clamps to allow pulling on a piece of elastic material about 30 mm in length. These were controlled using Labview software such that strain could be applied incrementally. This device was mounted on a Dimension AFM for imaging the elastic material. Sacculi were prepared on elastic PDMS and imaged between incremental applications of strain.
Labelling of E. coli with fluorescent vancomycin
All growth took place at 37 °C with agitation. Cultures were grown overnight in lysogeny broth and used to inoculate subsequent cultures to OD 600 =0.05. These were allowed to grow to OD 600 ~0.3 to 0.4 (exponential phase). Cells were fixed by adding 5 ml culture to 5 ml fixing solution (4 ml PBS+1 ml 16% w/v paraformaldehyde) and incubated on a rotary shaker for 15 min at room temperature. Cells were collected by centrifugation (5,000 g , 10 min) and pellets resuspended in 1 ml PBS before being washed twice by centrifugation (14,000 g , 1 min). Cells were then incubated in 1 ml 0.1% v/v Triton X-100, 5 mM EDTA in PBS for 45 min at room temperature before being washed three times in PBS as before. Cells were resuspended in 1 ml PBS to which fluorescent vancomycin (prepared using a succinimidyl ester of Alexa Fluor 532 (Invitrogen, A-20001) as previously described 8 ) was added to a final concentration of 4 μg ml −1 . The sample was protected from light and incubated at room temperature for 5 min before being washed by centrifugation (14,000 g , 1 min) with water. Cells were resuspended in water and deposited on an agarose pad or poly-l-lysine coated slide for imaging.
Labelling of sacculi with fluorescent vancomycin
Coverslips were sonicated for 15 min in 1 M KOH, washed with copious water and dried with nitrogen 32 . If intended for super-resolution microscopy, coverslips were sparsely coated with fiducial 103 nm diameter gold nanoparticles (Nanopartz, 13-100-25). Sacculi were then deposited onto coverslips as described for AFM on mica. The sacculi were labelled by applying a 50 μl drop of 4 μg ml −1 fluorescent vancomycin in water and incubating for 15 min, before thoroughly washing with water and drying with nitrogen. The coverslips were mounted on the slides before imaging with either 5 μl Slow Fade Gold (Invitrogen, S36936) for deconvolution microscopy or 5 μl PBS containing 10 mM cysteamine for super-resolution microscopy.
Deconvolution microscopy
Deconvolution microscopy was conducted as previously described 10 . Images were processed in ImageJ (version 1.45g).
Super-resolution microscopy Direct
STORM imaging was used 33 . A 100-mW, 532-nm diode laser (Laser 2000) was focussed onto the back plane of a 60 × , numerical aperture 1.4 oil immersion objective mounted in an Olympus IX71 inverted optical microscope. A filter cube containing a 552-nm longpass dichroic filter (Semrock FF552-DI02) and a 565(24)-nm bandpass emission filter (Semrock Brightline 565/24) was inserted for STORM. A piezoelectric motor (Physik Instrumente) was used to adjust focus. An image expander comprising a 35-mm and a 100-mm lens was used to project the image onto a Hamamatsu ImagEM camera set to acquire at 50 frames per second. A 1-m focal length cylindrical lens was inserted between the image expander lenses to allow for compensation of drift perpendicular to the focal plane 32 . Focus was maintained by repeatedly localizing a fiducial particle and adjusting the lens position using the piezo to maintain the ratio of the fitted full-width half maxima (FWHM) in perpendicular directions at 1:1. Laser power was adjusted by pulse-width modulation to maximize signal without saturating the charge-coupled device. The camera and piezo were controlled using Labview (version 10). Image processing was conducted using photoactivation localization microscopy/STORM methodology as previously described by others 19 32 . Data were processed by fitting Gaussian functions to individual molecule fluorescence, identified by very clear intrinsic blinks, using Matlab. Drift in the focal plane was corrected retrospectively by tracking a fiducial particle throughout the acquisition sequence and offsetting localizations against its position. Super-resolution images were rendered by creating an image of desired pixel size and marking each pixel to which a blink event was localized bright. A 30-nm Gaussian blur was applied in ImageJ (version 1.46c). Resolution can be estimated by taking the FWHM of position distributions for molecules that emit light in five or more sequential frames, providing an estimate of error pertinent to a dye molecule. For example, this resulted in FWHM x ~42 nm and FWHM y ~44 nm for the image in Fig. 3e , and FWHM x ~35 nm, FWHM y ~34 nm for the image in Fig. 3f . Resolution was not estimated using fiducial particles, as these were much brighter than the dye molecules under the imaging conditions employed, and would therefore make resolution appear artificially better than it was.
Supplementary Material Supplementary Information Supplementary Figures S1-S3 and Supplementary Table S1 Supplementary Movie 1 Sacculus immobilised on Cell-Tak/PDMS and stretched showing maintenance of features under strain Supplementary Movie 2 In situ lysozyme digest of sacculi under buffer A showing loss of feature orientation and enlargement of pores (10 nm height scale). Supplementary Movie 3 In situ Atl amidase digest of sacculi under buffer A showing loss of feature orientation and punctation of material (10 nm height scale).
📊 Figures
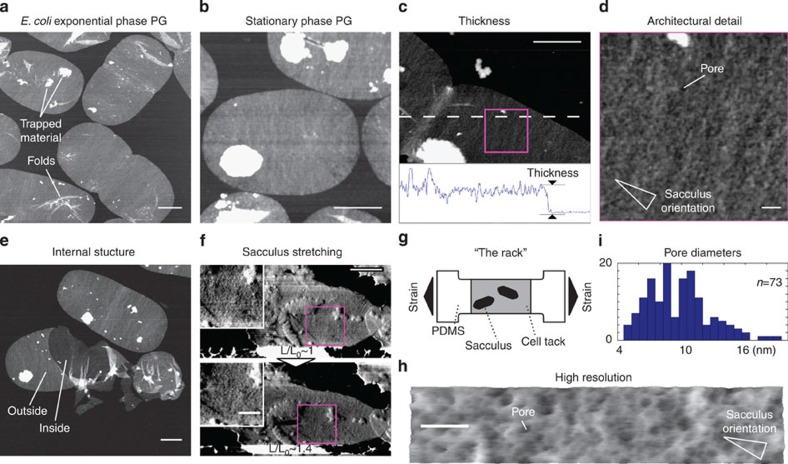
Figure 1
Tapping Mode AFM images of peptidoglycan architecture in E. coli MC1061.
( a ) Sacculi imaged under water showing banded variation, folds and trapped cytoplasmic contents (scale bar, 500u2009nm; height, 10u2009nm). ( b ) Stationary-phase sacculi imaged in ambient condition...
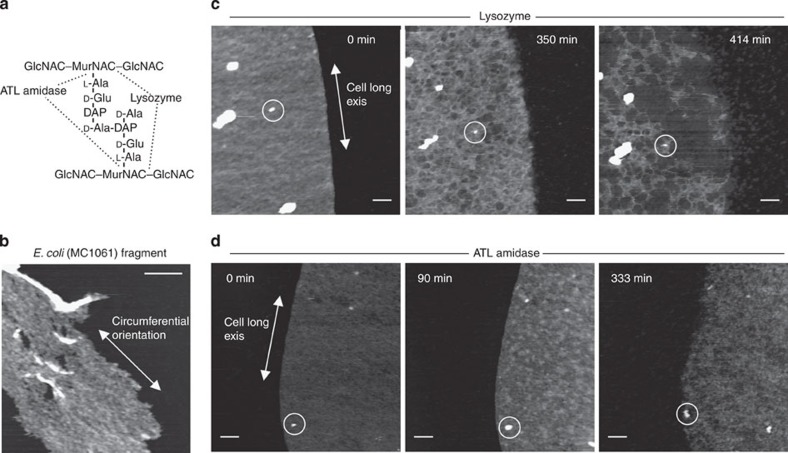
Figure 2
Disruption of peptidoglycan architecture visualized by AFM.
( a ) Targets for lysozyme and ATL amidase. ( b ) Sacculus fragment from a sample broken by the French press imaged under water, showing persistence of banding outwith the geometrical constraints of c...
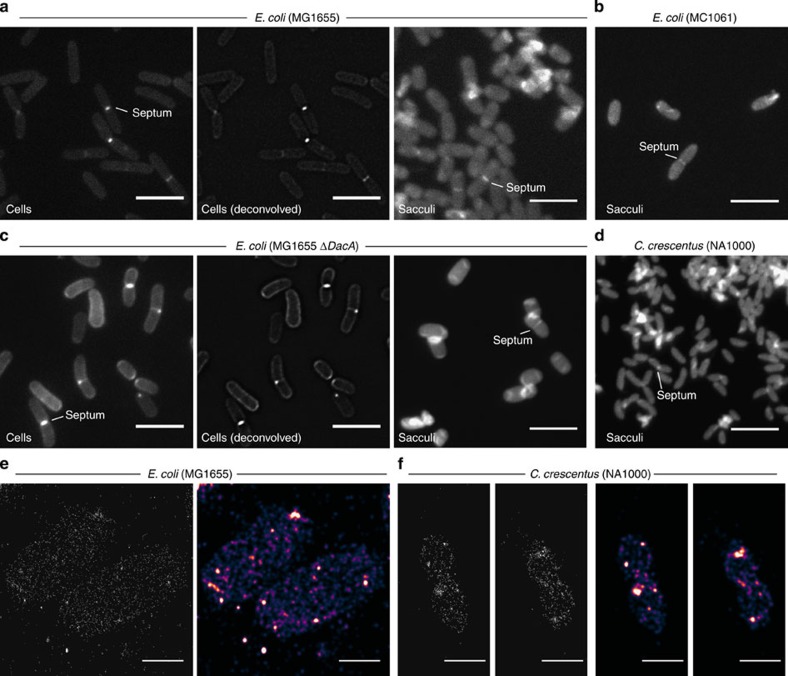
Figure 3
Peptidoglycan insertion visualized by fluorescent vancomycin labelling.
( a ) E. coli (MG1655) cells showing septal labelling, deconvolved cells showing apparently discontinuous labelling of the cylindrical part of the cell wall and sacculi, demonstrating specificity of l...
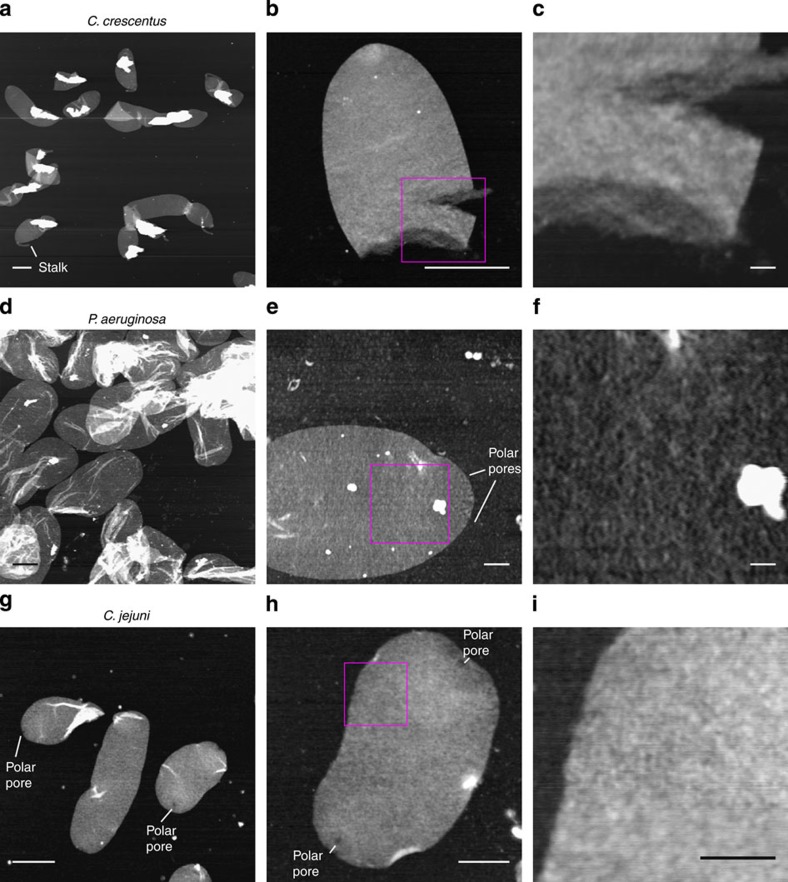
Figure 4
AFM images of C. crescentus , P. aeruginosa and C. jejuni sacculi.
( a ) C. crescentus sacculi showing stalks (scale bar, 750u2009nm; height 20u2009nm). ( b ) Broken C. crescentus sacculus (scale bar, 500u2009nm; height, 7u2009nm). ( c ) Close up of boxed region from...
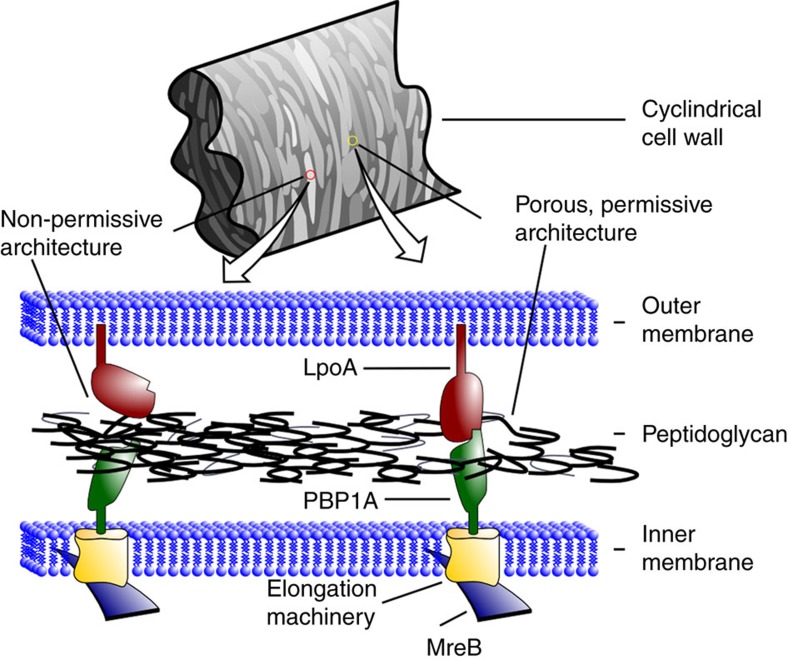
Figure 5
Model of peptidoglycan insertion based on AFM, fluorescence microscopy and STORM data.
Regions of porous architecture (dark bands in AFM images) are permissive for insertion of new peptidoglycan, which occurs when the elongation machinery is present, and PBP1A and LpoA are able to form ...
Figure images are served from the NIH/NLM PubMed Central Open Access Subset or Europe PMC; copyright remains with the publishers and authors.
💬 Discussion
0 commentsNo comments yet. Be the first to start a discussion!
Leave a Comment