Abstract
AbstractCerium oxide nanoparticles (nanoceria) display antioxidant properties and have shown cytoprotective effects both in vitro and in vivo. Here, we explored the effects of nanoceria on neural progenitor cells using the C17.2 murine cell line as a model. First, we assessed the effects of nanoceria versus samarium (Sm) doped nanoceria on cell viability in the presence of the prooxidant, DMNQ. Both particles were taken up by cells and nanoceria, but not Sm-doped nanoceria, elicited a temporary cytoprotective effect upon exposure to DMNQ. Next, we employed RNA sequencing to explore the transcriptional responses induced by nanoceria or Sm-doped nanoceria during neuronal differentiation. Detailed computational analyses showed that nanoceria altered pathways and networks relevant for neuronal development, leading us to hypothesize that nanoceria inhibits neuronal differentiation, and that nanoceria and Sm-doped nanoceria both interfere with cytoskeletal organization. We confirmed that nanoceria reduced neuron specific β3-tubulin expression, a marker of neuronal differentiation, and GFAP, a neuroglial marker. Furthermore, using super-resolution microscopy approaches, we could show that both particles interfered with cytoskeletal organization and altered the structure of neural growth cones. Taken together, these results reveal that nanoceria may impact on neuronal differentiation, suggesting that nanoceria could pose a developmental neurotoxicity hazard.
🔬 Techniques
🔭 Microscopes
💻 Software
✨ Fluorophores
🧪 Sample Preparation
🔬 Cell Lines
🏭 Microscope Brands
🧪 Reagent Suppliers
📷 Detectors
🔎 Objectives
💻 Software Details
💾 Data Repositories
🏛️ Research Organizations (ROR)
Affiliated research institutions:
📋 Methods
Nanomaterials The CeO 2 nanoparticles and the 20% Samarium (Sm) doped CeO 2 nanoparticles (Sm-CeO 2 ) were synthesized by a wet chemical process at room temperature as previously described 20 , 35 . The nanoparticle suspensions were prepared in MilliQ water at a stock concentration of 20 mg/mL by sonication for 5 min at 10 amplitude microns in an ultrasonic disintegrator running with an exponential probe (Soniprep 150, MSE). New stock dispersions were prepared before each experiment. In order to reach the indicated exposure concentrations, the stock dispersion was diluted in the relevant cell medium prior to exposure.
Nanomaterial characterization
Detailed characterization of the physicochemical and antioxidant properties of the CeO 2 and Sm-CeO 2 nanoparticles is described elsewhere 20 . Here, primary particle size as well as hydrodynamic size and surface charge was determined (Supplementary Figure 1 ). High resolution transmission electron microscopy images were taken by using a 300 keV electron beam energy by using a Titan G 2 60–300 ST Cs-Image corrected microscope and the primary particle size was estimated to be approx. 10 nm for CeO 2 and approx. 13 nm for Sm-CeO 2 20 . Additionally, the nanoparticles were characterized in cell medium by dynamic light scattering (DLS). The hydrodynamic diameter of the nanoparticles at different concentrations (20–100 µg/mL) was measured at 37 °C in C17.2 medium and differentiation media, as well as milliQ water (pH adjusted to 7.4). Measurements were performed using a Malvern Zetasizer (Nano-ZS, Malvern Instruments, Worcestershire, UK) using disposable cuvettes. DLS experiments consisted of 15 runs per measurement of 10 s each. All experiments were carried out in triplicate. The mean values ± S.D. of the hydrodynamic diameter and the polydispersity index (P.I.) are reported. Zeta potential was measured at a concentration of 50 µg/mL at 37 °C in milliQ water (pH = 7.4) and in the two culture media. Experiments were carried out in triplicate and diameters were reported as mean value ± S.D. The measurements in milliQ H 2 O were made in general purpose mode at 150 V; the measurements in cells media were collected in monomodal mode at low voltages, due to the high conductivity of this sample (16 mS/cm).
Show full methods section
Nanomaterials The CeO 2 nanoparticles and the 20% Samarium (Sm) doped CeO 2 nanoparticles (Sm-CeO 2 ) were synthesized by a wet chemical process at room temperature as previously described 20 , 35 . The nanoparticle suspensions were prepared in MilliQ water at a stock concentration of 20 mg/mL by sonication for 5 min at 10 amplitude microns in an ultrasonic disintegrator running with an exponential probe (Soniprep 150, MSE). New stock dispersions were prepared before each experiment. In order to reach the indicated exposure concentrations, the stock dispersion was diluted in the relevant cell medium prior to exposure.
Nanomaterial characterization
Detailed characterization of the physicochemical and antioxidant properties of the CeO 2 and Sm-CeO 2 nanoparticles is described elsewhere 20 . Here, primary particle size as well as hydrodynamic size and surface charge was determined (Supplementary Figure 1 ). High resolution transmission electron microscopy images were taken by using a 300 keV electron beam energy by using a Titan G 2 60–300 ST Cs-Image corrected microscope and the primary particle size was estimated to be approx. 10 nm for CeO 2 and approx. 13 nm for Sm-CeO 2 20 . Additionally, the nanoparticles were characterized in cell medium by dynamic light scattering (DLS). The hydrodynamic diameter of the nanoparticles at different concentrations (20–100 µg/mL) was measured at 37 °C in C17.2 medium and differentiation media, as well as milliQ water (pH adjusted to 7.4). Measurements were performed using a Malvern Zetasizer (Nano-ZS, Malvern Instruments, Worcestershire, UK) using disposable cuvettes. DLS experiments consisted of 15 runs per measurement of 10 s each. All experiments were carried out in triplicate. The mean values ± S.D. of the hydrodynamic diameter and the polydispersity index (P.I.) are reported. Zeta potential was measured at a concentration of 50 µg/mL at 37 °C in milliQ water (pH = 7.4) and in the two culture media. Experiments were carried out in triplicate and diameters were reported as mean value ± S.D. The measurements in milliQ H 2 O were made in general purpose mode at 150 V; the measurements in cells media were collected in monomodal mode at low voltages, due to the high conductivity of this sample (16 mS/cm).
Cells and cell culture conditions
C17.2 cells are mouse derived neural progenitor cells reported to be a relevant in vitro model for testing developmental neurotoxicity 34 . Under proliferating conditions the C17.2 cells were grown in cell culture dishes in DMEM high glucose, GlutaMAX (Gibco) supplemented with 5% horse serum, heat inactivated (Gibco) and 10% fetal bovine serum, heat inactivated (Gibco), 2 mM glutamine (Gibco), 100 U penicillin/mL, and 100 U streptomycin/mL (Gibco). The cells were split every 3–4 days. For differentiation experiments the cells were seeded at a density of 2000 cells/cm 2 in suitable cell culture plates in DMEM complete cell medium. After 24 h the cell medium was replaced with differentiation medium consisting of DMEM:F12 medium (Gibco) supplemented with 2 mM glutamine (Gibco), 100 U penicillin/mL, 100 U streptomycin/mL (Gibco) and N2 supplement (1:100) (ThermoFischer Scientific). Half of this differentiation medium was changed every 3 days during differentiation. The cells were incubated in a humidified atmosphere at 37 °C, 5% CO 2 for all experiments. In addition, primary hNPC cells isolated from the subcortical forebrain region of terminated first trimester embryos were used for differentiation experiments (ethical committee approval no 2013/564-32, Regional Ethical Committee, Stockholm). The hNPC were kindly provided by Dr. Erik Sundström, Department of Neurobiology, Care Sciences and Society, Karolinska Institutet. Informed consent was obtained from all participants as stipulated by the ethical committee and all experiments were conducted in accordance with relevant guidelines. The cells were subcultured as neurospheres in defined serum free media composed of Dulbecco’s Modified Eagle’s Medium and Ham’s F12 (3:1) supplemented with B27 (Invitrogen), 20 ng/ml epidermal growth factor (EGF) (Invitrogen), and 20 ng/ml recombinant human fibroblast growth factor (rhFGF) (R&D Systems) at 37 °C with 5% CO 2 as previously described 73 . Passaging was performed mechanically using a McIlwain tissue chopper. For differentiation experiments, neurospheres were dissociated to a single cells suspension and then plated on poly-d-lysin/laminin coated coverslips and allowed to attach in differentiation medium consisting of DMEM:F12 medium with N2 supplement, but without EGF and FGF.
Cell viability assay
Cell viability of the of the proliferating
C17.2 cells after nanoparticle exposure was assessed by the Alamar Blue assay (ThermoFischer Scientific). C17.2 cells were seeded in 48-well plates at a density of 6000 cells/cm 2 in complete DMEM medium. The following day the medium was carefully removed and the cells were exposed to the same medium containing 5, 10, 20, 50, 100 µg/mL CeO 2 or Sm-CeO 2 nanoparticles for 48 h. At the end of the exposure the medium was changed to medium containing 10% Alamar Blue and further incubated for 2 h. The fluorescence was measured at 560 nm excitation and 590 nm emission wavelength using a plate reader (Tecan Infinite F200, Tecan Trading AG, Switzerland). Results were expressed as % cell viability compared to the untreated control.
Cellular ROS generation
The generation of cellular ROS following CeO 2 and Sm-CeO 2 exposure alone and in the presence of an oxidative insult was investigated by the dichloro-dihydro-fluorescein diacetate assay (DCFH-DA). Briefly, C17.2 cells were seeded at a density of 6000 cells/cm 2 in 96-well plates with transparent bottom. The following day the cells were incubated with CeO 2 (20, 50, 100 µg/mL) or Sm-CeO 2 (20, 50, 100 µg/mL) NPs for 4 h and then loaded with DCFH-DA probe (25 µM, 45 min). Next cells were incubated with fresh medium (phenol red-free) or medium containing the pro-oxidant, dimethoxy-naphthoquinone (DMNQ, 10 μM) (Sigma-Aldrich). ROS formation was assessed on a plate reader (excitation 485 nm, emission 535 nm) at the indicated time-points. ROS induction was expressed as fold change versus control. Caspase-3/-7 activity assay Caspase activity was determined by incubation of cell lysates with the fluorogenic substrate DEVD-AMC (50 µM) (Sigma-Aldrich) as previously described 74 , and the enzyme catalyzed release of AMC was quantified using a plate reader (Tecan Infinite F200) (excitation 360 nm, emission 465 nm) in a kinetic mode over 45 min with readings performed every 90 s at 37 °C. Caspase-3/-7 activity was determined from the slope of the released AMC and expressed as fold change versus untreated control. Etoposide (Sigma-Aldrich) was included as a positive control (100 µM, exposure 4 h before cell harvesting). Automated microscopic morphological assessment Cell viability following oxidative insult was monitored by microscopic assessment of cell morphology and cell numbers using a Cell-IQ 2 automated live cell imaging platform (Chip-Man Technologies Ltd). Briefly, C17.2 cells were seeded at a density of 2000 cells/cm 2 in 48-well plates two days in advance. C17.2 cells were exposed to CeO 2 and Sm-CeO 2 nanoparticles (20, 50 μg/mL) for 4 h, then challenged with DMNQ (10 μM). The plate was placed in the Cell-IQ 2 instrument, and light microscopy images (phase contrast) were taken (using the Imagen software) at two defined locations in each well every 30 min continuously over 12 h. The images taken at the indicated time-points were manually scored in terms of number of non-dividing flat cells, mitotic cells and dying/dead cells. Results were expressed as % increased cell death after 8 h and 12 h as compared to time-point 0 h.
Transmission electron microscopy
Cellular uptake and intracellular localization of the nanoparticles were visualized by TEM.
Proliferating cells
C17.2 cells were seeded in 6-well plates at a density of 6000 cells/cm 2 in complete DMEM medium. The following day the medium was carefully removed and the cells were exposed to medium containing 50 µg/mL CeO 2 or 50 µg/mL Sm-CeO 2 for 24 h. Alternatively, proliferating cells C17.2 cells were seeded in 6-well plates at a density of 2000 cells/cm 2 in complete DMEM medium and the medium was carefully removed the following day and the cells were exposed to differentiation medium containing 50 µg/mL CeO 2 or 50 µg/mL Sm- CeO 2 for 7 days, changing half of the differentiation medium at day 3 and at day 6. At the end of the exposure the cells were washed, harvested by trypsinization and fixed in freshly prepared 2.5% glutaraldehyde in 0.1 M phosphate buffer (PB). After fixation the pellet was rinsed in 0.1 M PB and post fixed in 2% osmium tetroxide in 0.1 M PB, pH 7.4 at 4 °C for 2 h, dehydrated in ethanol followed by acetone, and embedded in LX-112 (Ladd, Burlington, Vermont, USA). Ultrathin sections (approximately 60–80 nm) were cut by a Leica ultracut UCT (Leica, Wien, Austria) and contrasted with uranyl acetate followed by lead citrate and examined with Tecnai 12 Spirit Bio TWIN transmission electron microscope (Fei company, Eindhoven, The Netherlands) at 100 kV. Digital images were captured by using a Veleta camera (Olympus Soft Imaging Solutions, GmbH).
Inductively coupled plasma mass spectrometry
Cellular uptake of the CeO 2 and Sm-CeO 2 nanoparticles was quantified using inductively coupled plasma mass spectrometry (ICP-MS). C17.2 cells were seeded in 6-well plates at a density of 6000 cells/cm 2 in complete DMEM medium. The following day the medium was carefully removed and the cells were exposed to medium containing 10, 25, 50 µg/mL CeO 2 or Sm-CeO 2 . Alternatively, C17.2 cells were seeded in 6 well plates at a density of 2000 cells/cm 2 in complete DMEM medium and the medium was carefully removed the following day and the cells were exposed to differentiation medium containing 25 µg/mL CeO 2 or 25 µg/mL Sm-CeO 2 for 1 or 7 days. At the end of the exposure the cells were washed three times with PBS, harvested by trypsinization, resuspended in cell medium and counted. The mineralization of the samples was performed in 45% HNO 3 for 7 days. Thereafter the samples were diluted to reach a 2% HNO 3 concentration and 140 Ce, 142 Ce, 147 Sm, 149 Sm, 152 Sm, 154 Sm isotopes were quantified using an iCAP Q ICP-MS (Thermoscientific) instrument running on KED mode. Matrix matched calibration standards of Ce and Sm (0.1, 1, 5, 10, 50, 100, 500 ppb) were prepared using untreated control samples to account for the complexity of matrix due to the cell debris and medium components. All samples were spiked with 5 ppb In, as an internal standard. The range for internal standard recovery was between 90–110%. The limits of detection for the investigated isotopes were 0.019 ( 140 Ce), 0.09 ( 142 Ce), 0.007 ( 147 Sm), 0.029 ( 149 Sm), 0.009 ( 152 Sm) and 0.002 ( 152 Sm) ppm. Each sample was injected 6 times and the RSD acceptance was set at 20%. Results were normalized according to the cell count and expressed as pg Ce and Sm/cell considering the average values.
Immunocytochemistry
Differentiation of C17.2 and hNPC cells into neurons was quantified using immunocytochemical stainings of β3-tubulin (TuJ1). C17.2 cells were seeded at a density of 2000 cells/cm 2 on glass coverslips in 24-well plates in complete DMEM medium. The following day the cell medium was changed to differentiation medium alone or containing CeO 2 (10, 25, 50 μg/mL), Sm-CeO 2 (25, 50 μg/mL), or NAC (1 mM). The C17.2 cells were differentiated for 7 days and at the end of the exposure the cells were washed and fixed in 4% formaldehyde for 20 min. hNPC cells were seeded at a density of 20.000 cells/cm 2 , exposed to 50 μg/mL CeO 2 or 50 μg/mL Sm-CeO 2 or left unexposed (control), and differentiated for 4 days. The choice of time-point for the hNSC was based on technical considerations that made it easier to score the differentiated neurons. Thereafter the coverslips were washed in PBS and blocked/permeabilised in 0.3% Triton-X (Sigma-Aldrich) with 10% donkey serum (Jackson ImmunoResearch) for 30 min. Then the coverslips were incubated with mouse anti-β3-tubulin (TuJ1) antibody (Covance) prepared in the same blocking solution overnight at 4 °C. The coverslips were then rinsed in PBS and incubated with DAPI and secondary antibody, donkey anti mouse antibody 488 Alexa conjugated (Jackson ImmunoResearch) for 1 h. The coverslips were mounted on microscopy slides using mounting medium (Dako, Agilent Technologies) and pictures were taken using an inverted Nikon ECLIPSE TE2000-S fluorescence microscope (Nikon Corp., Tokyo, Japan). At least 6 fields were considered per slide and at least 6 slides were scored per exposure. The slides were blindly scored in terms of number of neurons (considering the TuJ1 intensity and cell morphology). The results were expressed as % neuronal differentiation based on the percentage of TuJ1 positive cells. Enzyme-linked immunosorbent assay (ELISA) C17.2 cells were differentiated for and 7 days (10 days for GFAP) under continuous exposure to CeO 2 (25 μg/mL), Sm-CeO 2 (25 μg/mL) or NAC (1 mM). Quantification of cellular expression of GFAP (glial fibrillary acidic protein), SOD2 (superoxide dismutase, mitochondrial), or catalase was determined on cell lysates using ELISA kits (GFAP - EKM670, SOD2 - EKM2744, CAT - EKM714; NordicBiosite) according to the manufacturers’ protocol. Results were normalized according to the protein content and expressed as quantity of the protein of interest per mg total protein.
Super-resolution microscopy
C17.2 cells were seeded on poly-d-lysin/laminin-coated coverslips and exposed and differentiated as described for the immunocytochemistry protocol. The cells were differentiated for 6 days in order to reach an optimal cell density suitable for imaging. Thereafter, the cells were fixed 2% formaldehyde, washed in PBS and blocked/permeabilised in 0.1% Triton-X (Sigma-Aldrich) with 2% bovine serum albumin (Sigma) for 1 h. Then the coverslips were incubated with mouse anti-β3-tubulin (TuJ1) antibody (Covance) and rabbit anti-tyrosinated tubulin (ABT171) antibody (Abcam) prepared in the same blocking solution overnight at 4 °C. The coverslips were then rinsed in PBS and incubated with DAPI (4′,6-diamidino-2-phenylindole) (to visualize cell nuclei), phalloidin-TRITC (tetramethylrhodamine) (high affinity probe for F-actin) as well as secondary antibodies, donkey anti mouse antibody 488 Alexa conjugated (Jackson ImmunoResearch) and goat anti rabbit STAR 635 P (Abberior) for 1 h. The coverslips were then rinsed in PBS and mounted on microscopy slides using ProLong Gold mounting medium (ThermoFischer). Super-resolution images were taken on a SIM microscope (Zeiss Elyra PS.1) and STED microscope (Leica SP8 STED). Approx. 30 mature growth cones per condition were scored blindly according to their morphology (0 – cylindrical, 1 – round/oval, 2 – small triangular, 3–triangular shape) as well as number of filopodia (0−0–2, 1 −>3, 2 −>5, 3 −>7). SIM imaging was done with 405-, 488-, 561- and 642-nm excitation lasers, using a Plan-Apochromate 100x/1.46 NA oil lens. Emission was collected sequentially through appropriate dichroic mirrors and bandpass filters set at 420–480 nm for 405 nm excitation, 495–575 nm for 488 nm excitation, 570–650 nm for 561 nm excitation, and above 655 nm for 642 nm excitation onto a EMCCD camera (iXon 897, Andor Technology). Camera gain was set to 15–25 with camera integration times between 80 to 250 ms per imaged channel. SIM processing was done with the included ZEN software 2012 (SP2), with selection of automatic settings for evaluation of the raw data ( i.e . theoretical PSF, selection of noise filter setting, frequency weighting, baseline settings etc.) 75 . The optimal grid size was automatically assigned to each wavelength by the software, and the grid was rotated 5 times at 5 phases for each image. Calibration on 40 nm beads generated a lateral precision of 81 nm ± 5 nm at 488 nm. To confirm the SIM generated images, super-resolution STED imaging was applied, using a Leica SP8 (3X) STED system equipped with a white light source for excitation (tunable excitation from 470–670 nm) and three STED lasers for depletion at 592 nm, 660 nm and 775 nm. Imaging of nuclear staining with DAPI was A 100X/1.4 NA oil immersion objective lens (HCX PL APO STED white, Leica Microsystems) was used for the imaging. Fluorescence signals were passed through a 0.9–1.0 Airy unit pinhole, a tunable AOBS spectral excitation/filtering unit and separate notch (blocking) filters placed in front of integrated hybrid detectors (APD/PMT modules from Hamamatsu Photonics). Detector gain was set to 100 to 200% and gating times from 0.5 to 1.2 ns per images channel. Image frames (1024 × 1024) were acquired sequentially frame-by-frame at a scan speed of 600 lines per second with a pixel size of 28 nm. Raw STED images were deconvoluted with the Huygens software (SVI Netherlands).
RNA extraction and experimental design
C17.2 cells were differentiated for 1 and 7 days under continuous exposure to CeO 2 (25 μg/mL), Sm-CeO 2 (25 μg/mL) or NAC (1 mM). Untreated, proliferating cells (day 0), differentiated cells at day 1 and at day 7 were used as controls. Three replicates were considered for each sample. For RNA extraction, cells were washed after exposure and total RNA was extracted using the RNeasy Mini Columns (Qiagen) according to the manufacturer’s instructions, including a purification step with DNase I treatment. Total RNA concentration was determined spectrophotometrically using NanoDrop (NanoDrop Technologies).
RNA sequencing and data analysis
The quality control of the mRNA samples was conducted using the Bioanalyzer 2100 (Agilent Technologies) and all samples had RIN values above 9. RNA sequence libraries were generated with standard mRNA stranded protocols from Illumina and sequenced on a Hiseq. 2500 (pair end reads 101 bp long) at the Science for Life Laboratory, Stockholm, Sweden. Data processing was carried out at SNIC-UPPMAX, Uppsala, Sweden 76 . The generated reads were mapped to the mouse genome version GRCm38 using Tophat v. 2.0.4 77 . Read data were converted to gene counts with the program htseq v. 0.5.1 78 using the ensembl annotation v. 73. Differential gene expression were assessed using linear modeling in R using the bioconductor package Limma that allows for identification of differentially expressed genes in a multifactorial experiment 79 . Genes with an average expression lower than 1 read per sample were removed before analysis of differentially expressed genes. Of the 380561 annotated loci 17794 was expressed above our threshold and retained for analysis of differential gene expression. Only genes with p-values lower than 0.05 after correction for multiple testing (false discovery rate, FDR) and fold change larger than 0.75 on log 2 scale were considered as differentially expressed. The sequencing data were deposited at ArrayExpress (accession number E-MTAB-4398). Volcano plots were derived by plotting −log 10 (FDR adjusted p-value) in relation to the log 2 (fold change) in R using the ggplot2 package. Venn diagrams of the differentially expressed genes for each treatment versus the untreated control at the same point were plotted with a web-based tool developed by the Bioinformatics & Evolutionary Genomics Laboratory at VIB/UGent, Belgium ( http:bioinformatics.psb.ugent.be/webtools/Venn/ ). The cutoff for the FDR adjusted p-value was set at 0.75. The lists of genes for plotting the Venn diagrams were based on the Ensembl gene ID. As part of the quality control a principal component analysis plot was created using rlog-transformed count data; the plot indicated that samples clustered predominantly according to time-point (Supplementary Figure 11 ). Pathway, network and gene enrichment analysis Ingenuity Pathway Analysis (IPA) (content version 24718999) software (license obtained from Ingenuity Systems, Redwood City, CA) was used to perform canonical pathway analysis, as well as diseases and functions analysis. Heat maps were generated using data output from IPA network and pathway analysis with genes ordered according to average fold change in the control differentiating cells over time. The color coding displayed in the heatmaps shows the directionality of the changes in gene expression, in relation to the control. Gene Ontology (GO) enrichment analysis of the differentially expressed genes was performed using the online tool GOEast 80 using a Fischer exact test and Alexa’s improved weighted scoring algorithm. The GO enrichment was performed for all the differentially expressed genes together and separately for the up- and downregulated genes. The significance level of enrichment was set to a p-value of 0.05 and the minimum number of genes in the category (q-value) was set at 3 for the up-regulated genes and at 5 for the down-regulated genes. Additionally, GO enrichment was performed for the genes overlapping between CeO 2 and Sm-doped CeO 2 as well as CeO 2 and NAC at both day 1 and day 7.
Statistical analysis
Differences between groups were evaluated by ANOVA followed by Dunnet’s post hoc test (for comparisons versus control) or Tukey’s post hoc test (for comparisons within groups). For the statistical analysis of the neural growth cone results, the differences between groups were evaluated using the Kruskal-Wallis test (non-parametric) followed by Dunn’s multiple comparison test, as the data were not normally distributed. All analyses were performed using GraphPad Prism version 5.02. P-values < 0.05 were considered as statistically significant.
Nanomaterials The CeO 2 nanoparticles and the 20% Samarium (Sm) doped CeO 2 nanoparticles (Sm-CeO 2 ) were synthesized by a wet chemical process at room temperature as previously described 20 , 35 . The nanoparticle suspensions were prepared in MilliQ water at a stock concentration of 20 mg/mL by sonication for 5 min at 10 amplitude microns in an ultrasonic disintegrator running with an exponential probe (Soniprep 150, MSE). New stock dispersions were prepared before each experiment. In order to reach the indicated exposure concentrations, the stock dispersion was diluted in the relevant cell medium prior to exposure.
Nanomaterial characterization
Detailed characterization of the physicochemical and antioxidant properties of the CeO 2 and Sm-CeO 2 nanoparticles is described elsewhere 20 . Here, primary particle size as well as hydrodynamic size and surface charge was determined (Supplementary Figure 1 ). High resolution transmission electron microscopy images were taken by using a 300 keV electron beam energy by using a Titan G 2 60–300 ST Cs-Image corrected microscope and the primary particle size was estimated to be approx. 10 nm for CeO 2 and approx. 13 nm for Sm-CeO 2 20 . Additionally, the nanoparticles were characterized in cell medium by dynamic light scattering (DLS). The hydrodynamic diameter of the nanoparticles at different concentrations (20–100 µg/mL) was measured at 37 °C in C17.2 medium and differentiation media, as well as milliQ water (pH adjusted to 7.4). Measurements were performed using a Malvern Zetasizer (Nano-ZS, Malvern Instruments, Worcestershire, UK) using disposable cuvettes. DLS experiments consisted of 15 runs per measurement of 10 s each. All experiments were carried out in triplicate. The mean values ± S.D. of the hydrodynamic diameter and the polydispersity index (P.I.) are reported. Zeta potential was measured at a concentration of 50 µg/mL at 37 °C in milliQ water (pH = 7.4) and in the two culture media. Experiments were carried out in triplicate and diameters were reported as mean value ± S.D. The measurements in milliQ H 2 O were made in general purpose mode at 150 V; the measurements in cells media were collected in monomodal mode at low voltages, due to the high conductivity of this sample (16 mS/cm).
RNA extraction and experimental design
C17.2 cells were differentiated for 1 and 7 days under continuous exposure to CeO 2 (25 μg/mL), Sm-CeO 2 (25 μg/mL) or NAC (1 mM). Untreated, proliferating cells (day 0), differentiated cells at day 1 and at day 7 were used as controls. Three replicates were considered for each sample. For RNA extraction, cells were washed after exposure and total RNA was extracted using the RNeasy Mini Columns (Qiagen) according to the manufacturer’s instructions, including a purification step with DNase I treatment. Total RNA concentration was determined spectrophotometrically using NanoDrop (NanoDrop Technologies).
Electronic supplementary material Supporting Figures & Tables
📊 Figures
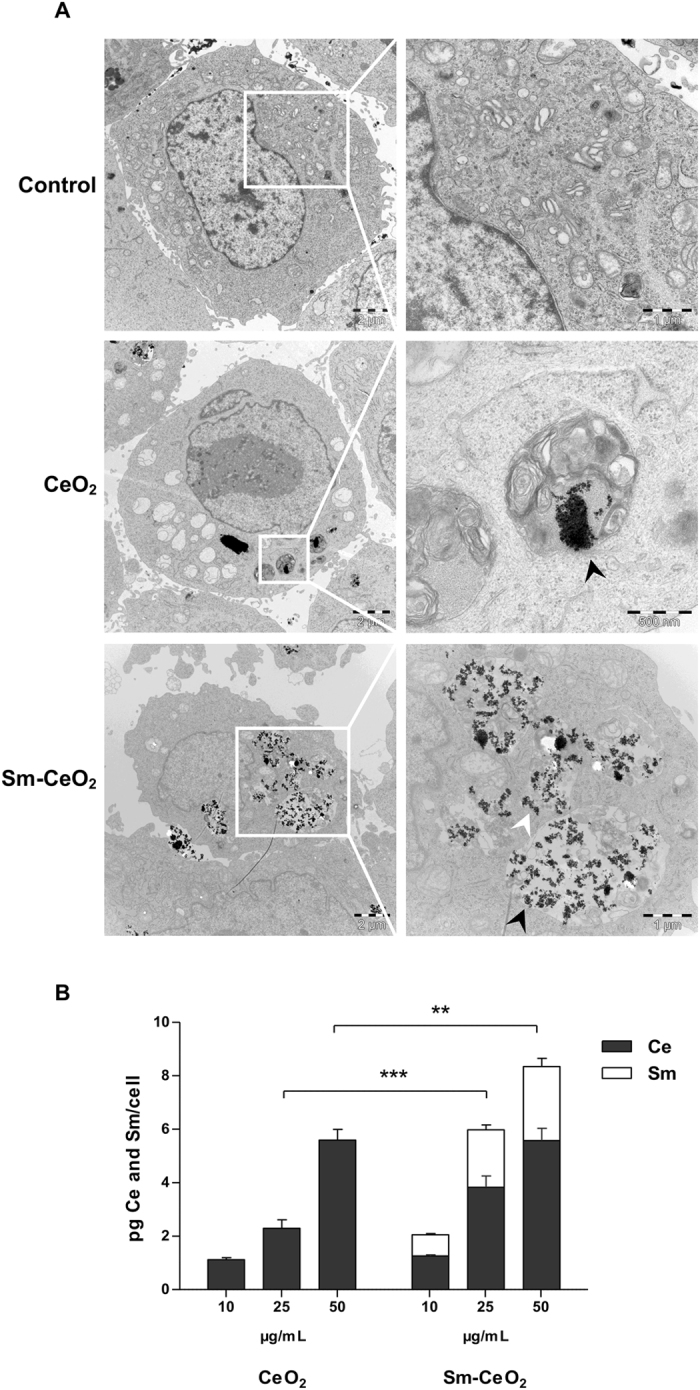
Figure 1
Cellular uptake of CeO 2 and Sm-CeO 2 nanoparticles in C17.2 cells. ( A ) C17.2 cells were exposed to 50u2009u03bcg/mL CeO 2 or Sm-CeO 2 nanoparticles for 24u2009h. Intracellular localization was inve...
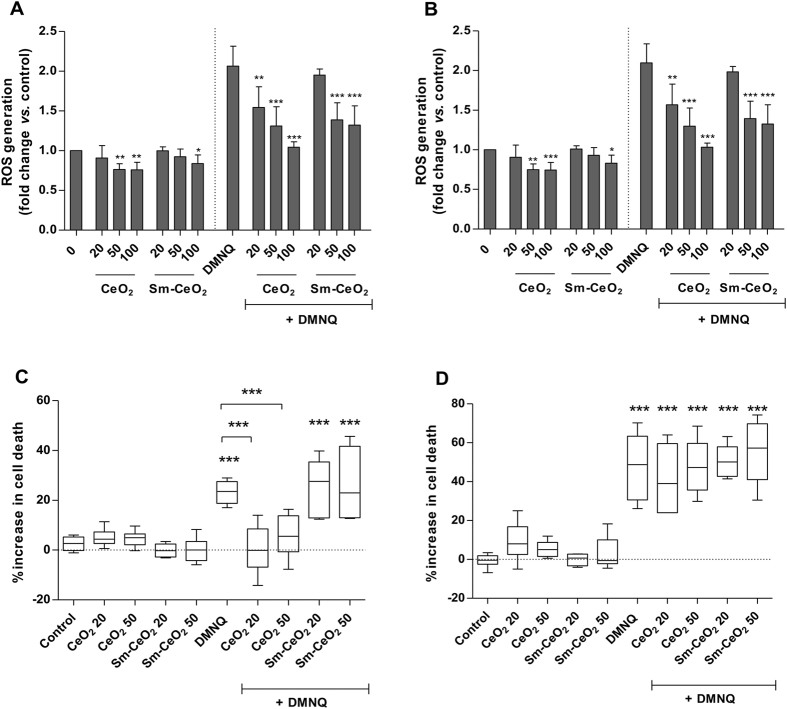
Figure 2
CeO 2 reduce ROS generation and delay ROS-induced cell death in C17.2 cells. ( A , B ) ROS generation after exposure to the oxidative stress inducer, DMNQ in the presence of CeO 2 or Sm-CeO 2 nanopart...
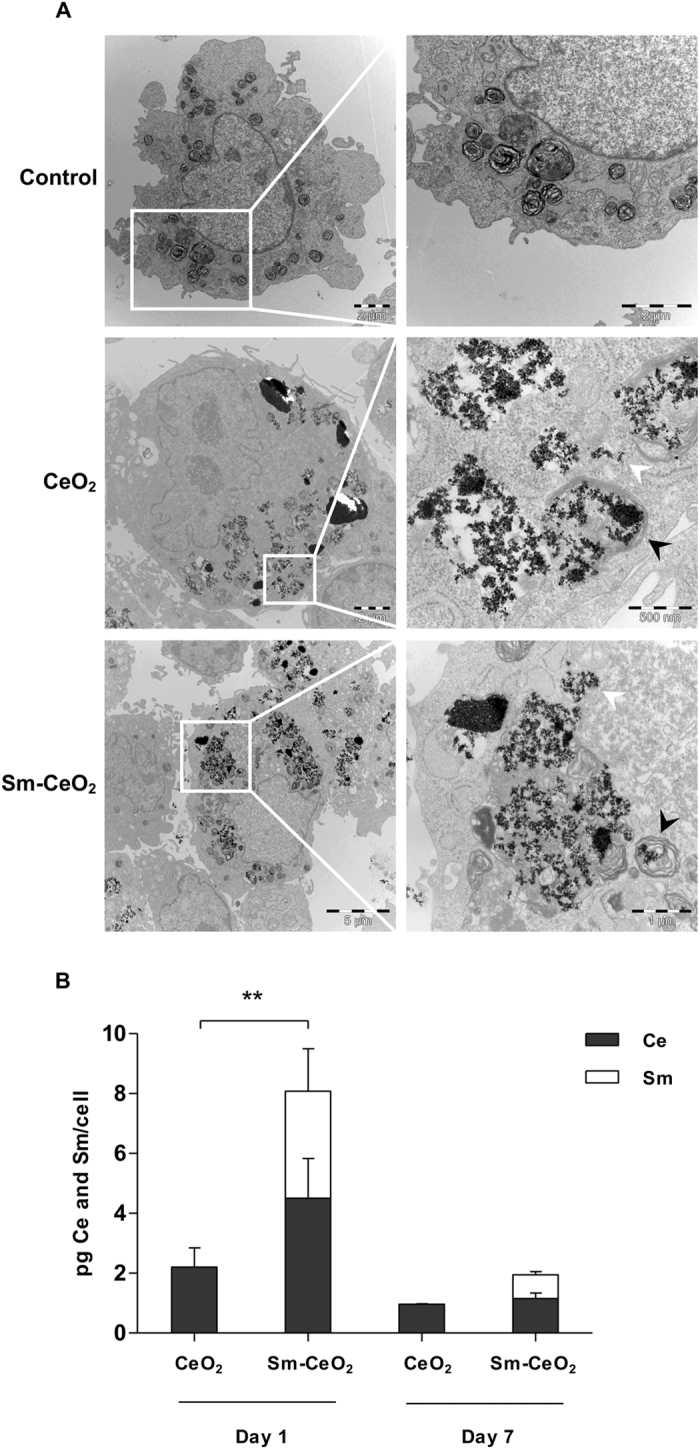
Figure 3
Cellular uptake of CeO 2 and Sm-CeO 2 in differentiated C17.2 cells. ( A ) C17.2 cells were differentiated for 7 days in the presence of 50u2009u03bcg/mL CeO 2 or Sm-CeO 2 nanoparticles. TEM imaging d...
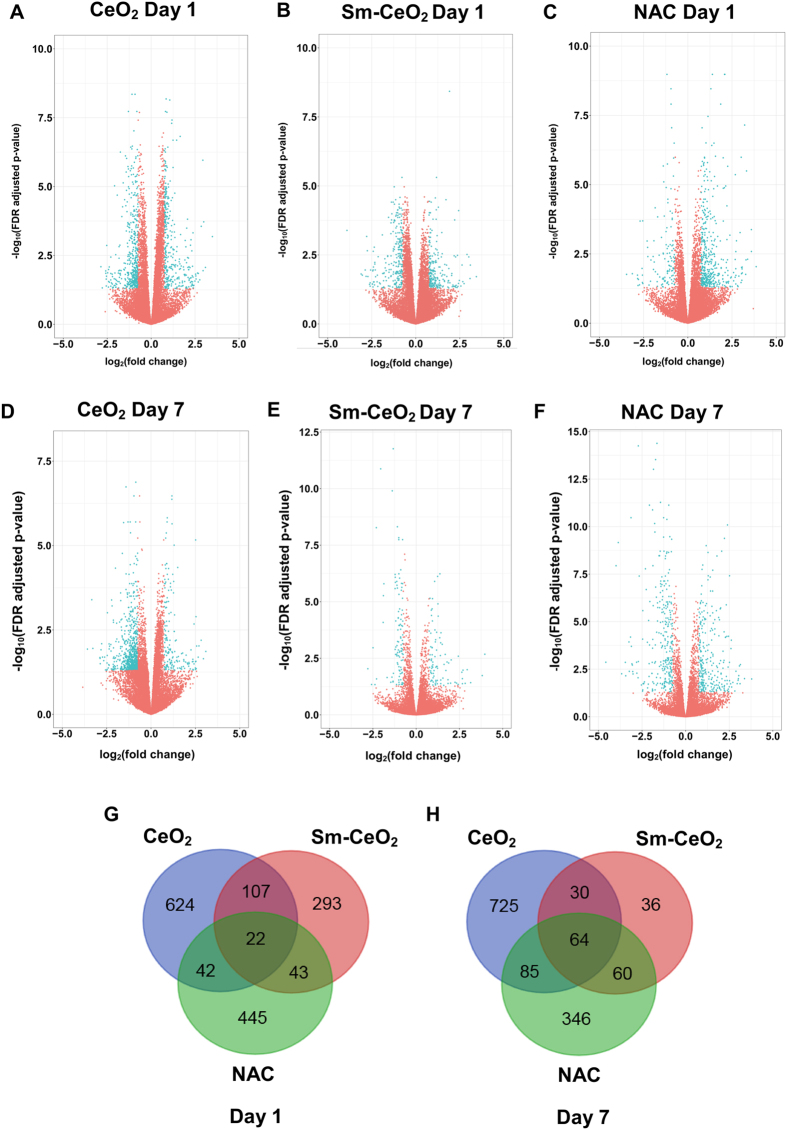
Figure 4
RNA-Seq analysis of differentiating C17.2 neural progenitor cells. ( A u2013 F ) Volcano plots illustrating u2013log 10 (FDR adjusted p-value) in relation to the log 2 (fold change) for the treatments...
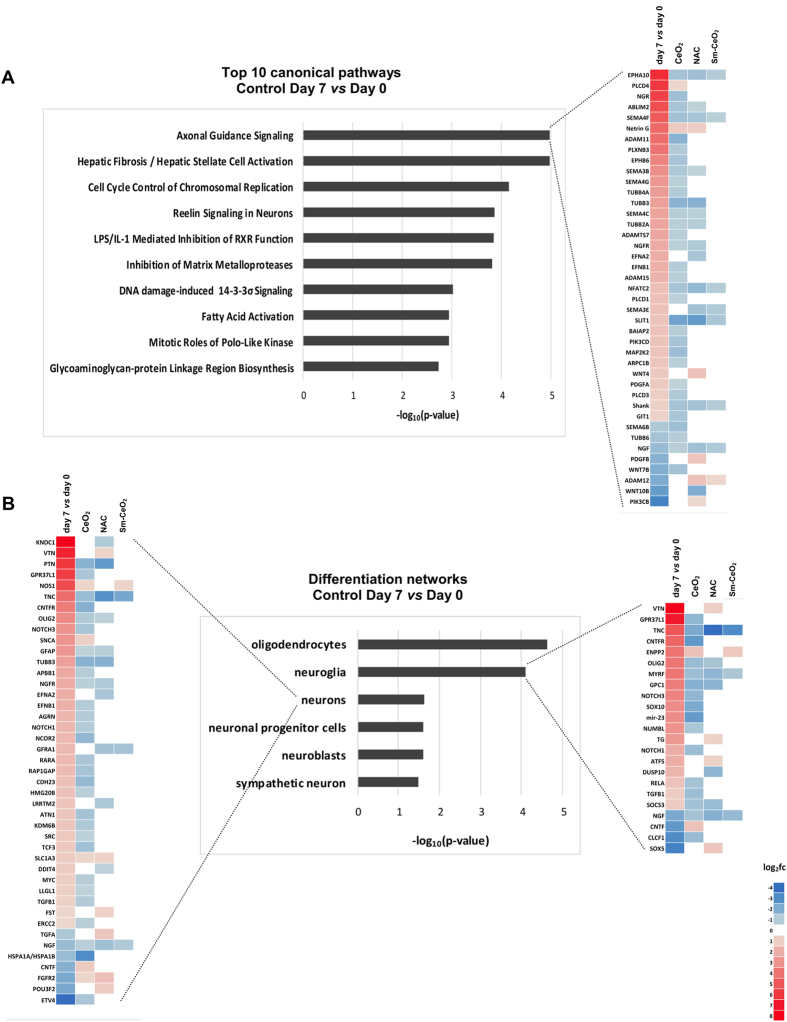
Figure 5
CeO 2 impacts on axonal guidance signaling and neural stem cell differentiation. Using the IPA tool, the transcriptomics data were analyzed with respect to the most significantly perturbed pathways an...
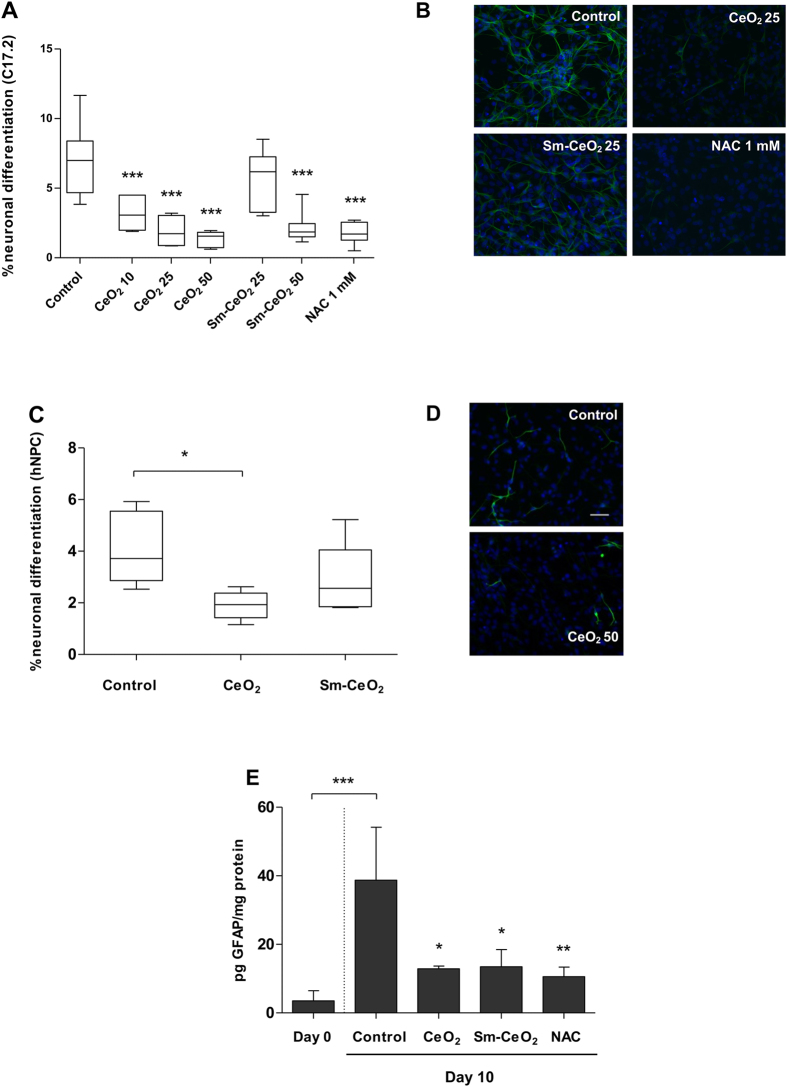
Figure 6
CeO 2 suppresses neural differentiation of murine and human stem/progenitor cells. C17.2 cells were differentiated for 7 days in the presence of CeO 2 (10, 25, 50u2009u03bcg/mL), Sm-CeO 2 (25, 50u2009...
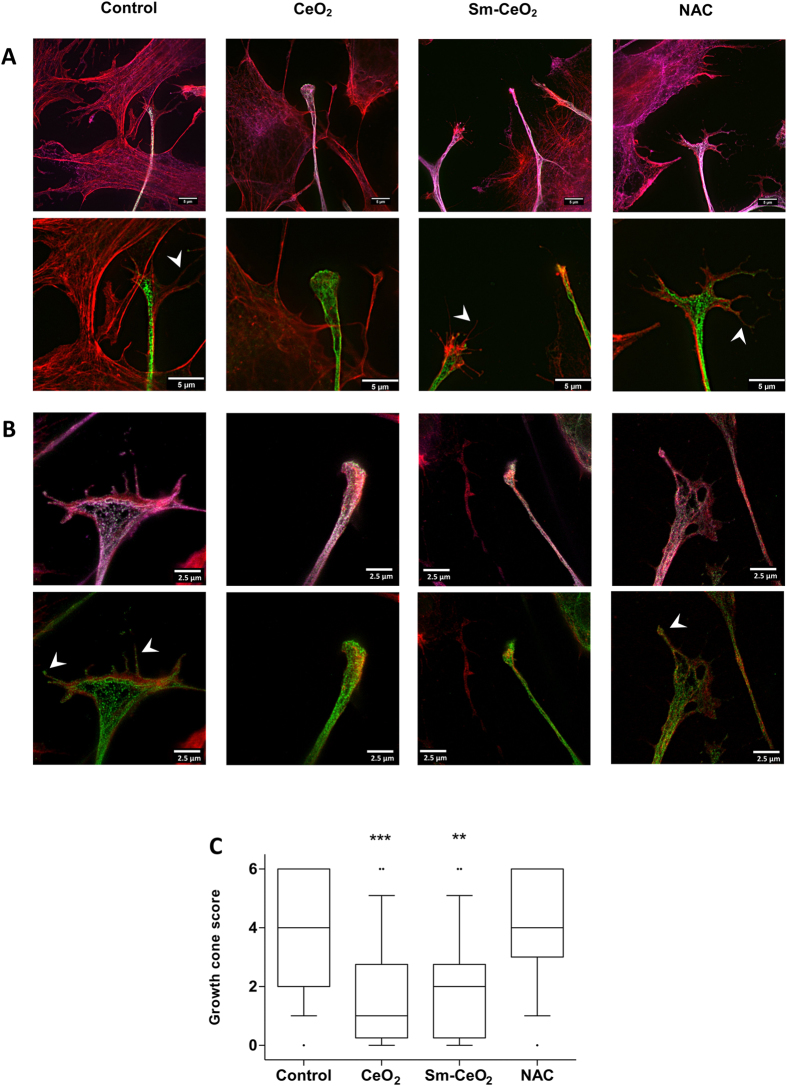
Figure 7
CeO 2 and Sm-CeO 2 nanoparticles alter the structure of neural growth cones. The structure of the growth cones was investigated by using super-resolution microscopy. C17.2 cells were differentiated fo...
Figure images are served from the NIH/NLM PubMed Central Open Access Subset or Europe PMC; copyright remains with the publishers and authors.
💬 Discussion
0 commentsNo comments yet. Be the first to start a discussion!
Leave a Comment