Abstract
AbstractThe molecular mechanisms that allow HIV to integrate into particular sites of the host genome are poorly understood. Here we tested if the nuclear pore complex (NPC) facilitates the targeting of HIV integration by acting on chromatin topology. We show that the integrity of the nuclear side of the NPC, which is mainly composed of Tpr, is not required for HIV nuclear import, but that Nup153 is essential. Depletion of Tpr markedly reduces HIV infectivity, but not the level of integration. HIV integration sites in Tpr-depleted cells are less associated with marks of active genes, consistent with the state of chromatin proximal to the NPC, as analysed by super-resolution microscopy. LEDGF/p75, which promotes viral integration into active genes, stabilizes Tpr at the nuclear periphery and vice versa. Our data support a model in which HIV nuclear import and integration are concerted steps, and where Tpr maintains a chromatin environment favourable for HIV replication.
🔬 Techniques
🔭 Microscopes
💻 Software
✨ Fluorophores
🧪 Sample Preparation
🔬 Cell Lines
🏭 Microscope Brands
🧪 Reagent Suppliers
💻 Software Details
💾 Data Repositories
🏛️ Research Organizations (ROR)
Affiliated research institutions:
📋 Methods
Cells, lentiviral vector carrying shRNA and HIV-1 infection The jurkat cells are CD4+ human T cells. The 293T cells are human embryonic kidney cells. The HeLa P4-CCR5 reporter cells are HeLa CD4+ CXCR4+ CCR5+ carrying the LacZ gene under the control of the HIV-1 LTR promoter 32 . Complementary oligonucleotide coding for shRNA cassette (5′- GGTGGAGAGCGAACAACAG -3′) 33 against Tpr or against Nup153 13 were first annealed and cloned into BglII/HindIII of pSUPER (OligoEngine) downstream of the H1 promoter. The H1-shRNA cassettes were then inserted in the 3′ U3 region of the HIV-1-derived vectors (LV-shRNA), TRIP-GFP or TRIPsym vectors, which are ΔU3. These LVs contain the cis -acting sequences required for formation of the central DNA Flap. The TRIPsym has the DNA Flap exactly located on the centre of the transfer vector, to increase the efficiency of transduction. LV-shRNAs carrying GFP were titered in HeLa P4-CCR5 cells using flow cytometry to assess GFP expression at 3 days post-transduction (p.t). In addition, TRIP-GFP and TRIPsym with shRNA (LVshRNA) were tittered by p24 ELISA according to the manufacturer’s instructions (Perkin Elmer). HeLa P4-CCR5 and Jurkat cells were transduced with LV-shRNA against Tpr or Nup153 at different MOI up to 100 to generate knockdown cells ( Figs 1a,b and 2a,c ; Supplementary Fig. 7 ). For reasons of viability, half-life and stability of each nucleoporin, Tpr and Nup153 KD cells were used at 2–3 days p.t. Stable Tpr depleted and control HeLa P4CCR5 were obtained by limiting dilution ( Fig. 3a ; Supplementary Fig. 7 ). Lentiviral vectors were produced by transient transfection of 293T cells using calcium phosphate coprecipitation with NL4.3 Luc ENV − or NL4.3 RFP ENV − (luciferase or RFP genes in place of Nef) and cotransfection with the VSV-G envelope expression plasmid pHCMV-G (VSV-G). The viruses collcted from 293T cells 48 h post transfection were treated with 25 U ml −1 of DnaseI (Roche) and with 100 mM MgCl2 at 37 °C for 30 min. Virus normalizations were performed by p24 ELISA according to the manufacturer’s instructions (Perkin Elmer). Retroviral vector, MLV-Luc, derived from Moloney was produced by cotransfection with calcium phosphate of pFBluc 10 μg, pCG gag-pol 10 μg, pMD2 VSV-G 2 μg. Luciferase assays Luciferase (Promega) activity was measured 48 h p.i. according to manufacturer’s instructions, using a microplate fluorimeter (Victor, Perkin Elmer). Protein quantification by Bio-Rad protein assay was carried out on the same lysates to normalize the luciferase data for protein content. Quantitative PCR Viruses were treated for 30 min at 37 °C with 1,000 U of DnaseI (Roche). Five micromolar of nevirapine used in infected cells as control of the experiment. Total cellular DNA was then isolated using the QIAamp DNA micro kit (QIAGEN) at 7 and 24 h p.i.. Late reverse transcription products at 7 h p.i. were measured by real-time PCR using Sybergreen and primers against luciferase (5′- GAATCCATCTTGCTCCAACAC -3′; 5′- TTCGTCCACAAACACAACTC -3′), which is exclusively in the HIV-1-Luc and not in the LVshRNA previously used to generate Tpr KD or control cells. 2LTR containing circles were detected using primers MH535/536 and probe MH603 (ref. 34 ), using as standard curve the pUC2LTR plasmid, which contains the HIV-1 2LTR junction. Integration was assessed by Alu-PCR, using primers designed in the U3 region of LTR 13 14 57 , which is deleted in the LVs carrying shRNA but not in the LTR of HIV-1 used to challenge Tpr depleted and control cells. Binding of Nups to in vitro HIV-1 CA–NC complexes The 293 T cells were transfected with plasmids expressing TPR-GFP or Nup153-GFP proteins. Forty-eight hours after transfection, cell lysates were prepared as follows: previously washed cells were resuspended in hypotonic lysis buffer (10 mM Tris, pH 7.4, 1.5 mM MgCl 2 , 10 mM KCl and 0.5 mM DTT). The cell suspension was frozen and thawed, and incubated on ice for 10 min. Afterwards, the lysate was centrifuged at maximum speed in a refrigerated Eppendorf micro centrifuge (~14,000 g ) for 5 min. The supernatant was supplemented with 1/10 volume of 10 × PBS and then used in the binding assay. To test binding, 5 μl of CA–NC particles assembled in vitro were incubated with 200 μl of cell lysate at room temperature for 1 h. A fraction of this mixture was stored (input). The mixture was spun through a 70% sucrose cushion (70% sucrose, 1 × PBS and 0.5 mM DTT) at 100,000 g in an SW55 rotor (Beckman) for 1 h at 4 °C. After centrifugation, the supernatant was carefully removed and the pellet resuspended in 1 × SDS–PAGE loading buffer (pellet). The level of TPR-GFP and Nup153-GFP proteins were determined by western blotting with anti-GFP antibody (Clontech #632592 1:1000). The level of HIV-1 CA–NC protein in the pellet was assessed by western blotting with anti-p24 CA antibody (Abcam ab9071, 1:2,000; Fig. 1f , Supplementary Fig. 7 ) and a secondary Ab anti-mouse IRDye-680-it926–68020 LICOR (1:1,000). Blots were analysed using LICOR technology. The HIV-1 CA–NC protein was expressed, purified and assembled in vitro by diluting the CA–NC protein to a concentration of 0.3 mM in 50 mM Tris–HCl (pH 8.0), 0.5 M NaCl and 2 mg ml −1 DNA oligo-(TG)50. The mixture was incubated at 4 °C overnight and centrifuged at 8,600 g for 5 min. The pellet was resuspended in assembly buffer (50 mM Tris–HCl (pH 8.0), 0.5 M NaCl) at a final protein concentration of 0.15 mM 13 37 58 , and stored at 4 °C.
Show full methods section
Cells, lentiviral vector carrying shRNA and HIV-1 infection The jurkat cells are CD4+ human T cells. The 293T cells are human embryonic kidney cells. The HeLa P4-CCR5 reporter cells are HeLa CD4+ CXCR4+ CCR5+ carrying the LacZ gene under the control of the HIV-1 LTR promoter 32 . Complementary oligonucleotide coding for shRNA cassette (5′- GGTGGAGAGCGAACAACAG -3′) 33 against Tpr or against Nup153 13 were first annealed and cloned into BglII/HindIII of pSUPER (OligoEngine) downstream of the H1 promoter. The H1-shRNA cassettes were then inserted in the 3′ U3 region of the HIV-1-derived vectors (LV-shRNA), TRIP-GFP or TRIPsym vectors, which are ΔU3. These LVs contain the cis -acting sequences required for formation of the central DNA Flap. The TRIPsym has the DNA Flap exactly located on the centre of the transfer vector, to increase the efficiency of transduction. LV-shRNAs carrying GFP were titered in HeLa P4-CCR5 cells using flow cytometry to assess GFP expression at 3 days post-transduction (p.t). In addition, TRIP-GFP and TRIPsym with shRNA (LVshRNA) were tittered by p24 ELISA according to the manufacturer’s instructions (Perkin Elmer). HeLa P4-CCR5 and Jurkat cells were transduced with LV-shRNA against Tpr or Nup153 at different MOI up to 100 to generate knockdown cells ( Figs 1a,b and 2a,c ; Supplementary Fig. 7 ). For reasons of viability, half-life and stability of each nucleoporin, Tpr and Nup153 KD cells were used at 2–3 days p.t. Stable Tpr depleted and control HeLa P4CCR5 were obtained by limiting dilution ( Fig. 3a ; Supplementary Fig. 7 ). Lentiviral vectors were produced by transient transfection of 293T cells using calcium phosphate coprecipitation with NL4.3 Luc ENV − or NL4.3 RFP ENV − (luciferase or RFP genes in place of Nef) and cotransfection with the VSV-G envelope expression plasmid pHCMV-G (VSV-G). The viruses collcted from 293T cells 48 h post transfection were treated with 25 U ml −1 of DnaseI (Roche) and with 100 mM MgCl2 at 37 °C for 30 min. Virus normalizations were performed by p24 ELISA according to the manufacturer’s instructions (Perkin Elmer). Retroviral vector, MLV-Luc, derived from Moloney was produced by cotransfection with calcium phosphate of pFBluc 10 μg, pCG gag-pol 10 μg, pMD2 VSV-G 2 μg. Luciferase assays Luciferase (Promega) activity was measured 48 h p.i. according to manufacturer’s instructions, using a microplate fluorimeter (Victor, Perkin Elmer). Protein quantification by Bio-Rad protein assay was carried out on the same lysates to normalize the luciferase data for protein content. Quantitative PCR Viruses were treated for 30 min at 37 °C with 1,000 U of DnaseI (Roche). Five micromolar of nevirapine used in infected cells as control of the experiment. Total cellular DNA was then isolated using the QIAamp DNA micro kit (QIAGEN) at 7 and 24 h p.i.. Late reverse transcription products at 7 h p.i. were measured by real-time PCR using Sybergreen and primers against luciferase (5′- GAATCCATCTTGCTCCAACAC -3′; 5′- TTCGTCCACAAACACAACTC -3′), which is exclusively in the HIV-1-Luc and not in the LVshRNA previously used to generate Tpr KD or control cells. 2LTR containing circles were detected using primers MH535/536 and probe MH603 (ref. 34 ), using as standard curve the pUC2LTR plasmid, which contains the HIV-1 2LTR junction. Integration was assessed by Alu-PCR, using primers designed in the U3 region of LTR 13 14 57 , which is deleted in the LVs carrying shRNA but not in the LTR of HIV-1 used to challenge Tpr depleted and control cells. Binding of Nups to in vitro HIV-1 CA–NC complexes The 293 T cells were transfected with plasmids expressing TPR-GFP or Nup153-GFP proteins. Forty-eight hours after transfection, cell lysates were prepared as follows: previously washed cells were resuspended in hypotonic lysis buffer (10 mM Tris, pH 7.4, 1.5 mM MgCl 2 , 10 mM KCl and 0.5 mM DTT). The cell suspension was frozen and thawed, and incubated on ice for 10 min. Afterwards, the lysate was centrifuged at maximum speed in a refrigerated Eppendorf micro centrifuge (~14,000 g ) for 5 min. The supernatant was supplemented with 1/10 volume of 10 × PBS and then used in the binding assay. To test binding, 5 μl of CA–NC particles assembled in vitro were incubated with 200 μl of cell lysate at room temperature for 1 h. A fraction of this mixture was stored (input). The mixture was spun through a 70% sucrose cushion (70% sucrose, 1 × PBS and 0.5 mM DTT) at 100,000 g in an SW55 rotor (Beckman) for 1 h at 4 °C. After centrifugation, the supernatant was carefully removed and the pellet resuspended in 1 × SDS–PAGE loading buffer (pellet). The level of TPR-GFP and Nup153-GFP proteins were determined by western blotting with anti-GFP antibody (Clontech #632592 1:1000). The level of HIV-1 CA–NC protein in the pellet was assessed by western blotting with anti-p24 CA antibody (Abcam ab9071, 1:2,000; Fig. 1f , Supplementary Fig. 7 ) and a secondary Ab anti-mouse IRDye-680-it926–68020 LICOR (1:1,000). Blots were analysed using LICOR technology. The HIV-1 CA–NC protein was expressed, purified and assembled in vitro by diluting the CA–NC protein to a concentration of 0.3 mM in 50 mM Tris–HCl (pH 8.0), 0.5 M NaCl and 2 mg ml −1 DNA oligo-(TG)50. The mixture was incubated at 4 °C overnight and centrifuged at 8,600 g for 5 min. The pellet was resuspended in assembly buffer (50 mM Tris–HCl (pH 8.0), 0.5 M NaCl) at a final protein concentration of 0.15 mM 13 37 58 , and stored at 4 °C.
Transcriptomic analysis
RNA sequencing has been performed to total RNA isolated from the following samples: Clone 2, Clone 6, Tpr KD HeLa and control (LV-shRNA MOI 50) and Tpr KD Jurkat and control (LV-shRNA MOI 50), using the RNeasy mini kit Qiagen. Total RNAs were qualitatively checked using the Agilent TapeStation and the RNA ScreenTape (Agilent Technologies, Santa Clara, CA, USA) and quantitated using the NanoDrop 1000 spectrophotometer (Thermo Scientific, Wilmington, DE, USA). For each sample, 1,000 ng of total RNA was prepared to obtain an Illumina indexed library, following the protocol TruSeq RNA sample Preparation V2. Indexed libraries were then sequenced using the Illumina platform MiSeq and the V3 sequencing chemistry. Data were analysed as following. For each sample, the reads were mapped on the annotated human genome reference sequence (Hg 19 release) and the Reads Per Kilobase of transcript per Million mapped reads (RPKM) values were calculated using the CLC Workbench software (CLC Bio-Qiagen, Aarhus, Denmark). For a visual comparison of the transcriptome profiles, a scatter plot were designed reporting RPKM values observed in all ~36,000 genes annotated. To avoid problem due to RPKM equal to zeros and to ensure a better visualization, a log 2 (RPKM+1) transformation was applied ( Fig. 3d–f ). To assess the similarity between the Tpr KD and control samples, Pearson correlation coefficient was calculated. Graphs and indexes calculations were performed using the R software (version 3.0.1). RT–PCR Total RNA was extracted from clones 2 and 6, Tpr KD and control HeLa cells, Tpr KD and control Jurkat cells. RT–PCR has been performed on these samples using the SuperScript III Platinum SYBR Green One-Step qRT–PCR Kit. Primers used were the following: PSIP1 (5′- GTTACTTCAACCTCCGATTCTG -3′; 5′- TTGATGTTTCTCGCTTCTTCTC -3′), TPR (5′- CTT GTAAATTGGCTCTGAATGG -3′; 5′- AGACTTGTGAATGAAACC CGA -3′), GAPDH (5′- CAT TTC CTG GTA TGA CAA CGA -3′, 5′- CTT CCT CTT GTG CTC TTG CT -3′), ACTIN (5′- AAG ATC AAG ATC ATT GCT CCT CC -3′, 5′- GTC ATA GTC CGC CTA GAA GCA -3′), TRIM24 (5′- AGC AAA CGA CTG ATT ACA TAC C -3′, 5′- TTT GAG CCC AGA AAC TAG GA -3′), SNX27 (5′- CAA GTA TAT CAG GCT ATC GCA -3′, 5′- TCT GAA TGT AGA GTT TGT GAG G -3′).
Sample preparation for microscopy
Cells were seeded onto 12 mm diameter coverslips in 24-well plates the day before fixation or infection. Cells were fixed in 2% paraformaldehyde for 10 min, treated with 50 nM NH4Cl for 10 min, permeabilized with 0.5% triton for 30 min and blocked with 0.3% bovine serum albumin (BSA). All incubations were carried out at room temperature and were followed by five PBS washes. Cells were incubated with primary antibodies for 1 h and secondary antibodies for 30 min. Antibodies were diluted in 0.3% BSA. Nuclei were stained with Hoechst (Invitrogen). Finally, cells were mounted onto glass slides (Thermo Scientific) with Prolong Antifade (Life Technologies).
Western blotting and confocal microscopy
The deletion mutant GFP-Nup153ΔFG generated by DNA restriction with XbaI of the GFP-Nup153, GFP-Nup153, pGFP-Nup98, pHA-Np153 (Euroscarf), pGFP-Tpr (Addgene), pcDNA IN-HA (kind gift of S. Emiliani), pHA-LEDGF/p75, pCEP75Flag (kind gift of P. Cherepanov), pAcGFP1-IN and pC2GFP (Clontech), pCMV Tat and pAcGFP1-IN (kind gift of X. Yao) plasmids were transfected using lipofectamine 2000 in HeLa cells or using calcium phosphate in 293T cells. Proteins were extracted on ice from wild type and KD cells using RIPA buffer (20 mM HEPES pH 7.6, 150 mM NaCl, 1% sodium deoxycholate, 1% Nonidet P-40, 0.1% SDS, 2 mM EDTA, complete protease inhibitor (Roche Diagnostics)), and protein concentration was quantified using the Dc Protein Assay (Bio-Rad Laboratories) with BSA as standard. Hundred micrograms of total protein lysate was loaded onto SDS–PAGE 6% Tris-glycine or 4–12% Bis Tris gels (Invitrogen). Revelation was carried out using the ECL Plus western blotting kit (GE Healthcare).
Primary antibodies used for western blotting
(WB) were anti-Tpr (Santa Cruz sc-101294 WB 1:1,000, IF 1:100), anti- Nup153 (SA1, kind gift from B. Burke, WB 1:500, IF 1:10), anti-GFP (Clontech #632592 1:1000), anti-HA (Covance MMS-101 R 1:1000), anti-Flag HRP conjugated (Sigma A8592 1:1000), anti-lamin A/C (Santa Cruz sc-7292 1:500), anti- LEDGF/p75 (Bethyl A300–847A 1:200). Secondary conjugated antibodies used for western blotting were Beta Actin HRP conjugated antibody (Abcam, #8226 1:2,500), anti-mouse IgG HRP (GE Healthcare NA931 1:5,000) and anti-rabbit IgG HRP (GE Healthcare, NA 934 1:5,000). Secondary conjugated antibodies for IF were anti-mouse Cy3 (GE Healthcare PA43002 1:300). Hoechst (Invitrogen 1:10,000) was used to stain nuclei. Western blots were quantified using ImageJ or MYImageAnalysis (Thermo Scientific). Confocal microscopy was carried out using a Zeiss LSM700 confocal microscope with a 63 × objective, using identical laser and exposure times for all samples, including negative controls (only secondary antibodies). Four independent experiments were performed. HIV-1 integration sites distribution Twenty million Jurkat cells (control and Tpr KD) were infected with 10 μg of p24 antigen of NL4.3-Luc ENV − . Three days later, genomic DNA was extracted by QIAamp DNA micro kit (QIAGEN) and digested with the four-cutter enzymes Bfa I and Bgl II to prevent the amplification of internal 3′ LTR fragments, using the protocol described in ref. 13 . Raw sequence reads were processed through an automated bioinformatic pipeline that eliminated small and redundant sequences, and were mapped to the UCSC hg19 release of the human genome 59 . Sequences with 90% or greater identity to the human genome were considered genuine integration sites. To investigate the relationship between integration sites (ISs), DNaseI hypersensitive sites and histone methylation profiles, we used data retrieved from NGS on Jurkat cells and CD4 + T cells available from http://www.uwencode.org/data/releases ( GSM736501 , GSM945267 (ref. 39 ), http://dir.nhlbi.nih.gov/papers/lmi/epigenomes/hgtcell.aspx 60 , which were properly remapped and adapted from the hg18 to the hg19 version of the human genome using the LIFTOVER tool available on the UCSC genome browser. From the raw signal bed files, we calculated and analysed the distances of each feature tag from every integration site considering a ±50 kb window centred on ISs. This task was performed on three data sets: control, Tpr KD and a random data set composed of 10,000 integrations in silico generated according our experimental setting. To visualize associations between ISs and aforementioned genomic features at short and wide ranges, we performed two different analysis. To highlight wide-range behaviour, the distribution of all distances (within the −50 kb window) was plotted as a histogram with bins of 100 bp. In addition a Gaussian kernel density estimator with Sheather and Jones bandwidth selection was calculated and superimposed to the histograms ( Fig. 5c,d ; Supplementary Fig. 4b ). To test for statistical differences of the distance distributions between control cells, Tpr KD and random ISs, we performed three Kolmogorov–Smirnov tests for each genomic feature: (control versus Tpr KD, control versus random, Tpr KD versus random). We analysed whether two empirical distributions of distances could be assumed to be drawn from the same underlying distribution that was for all
📊 Figures
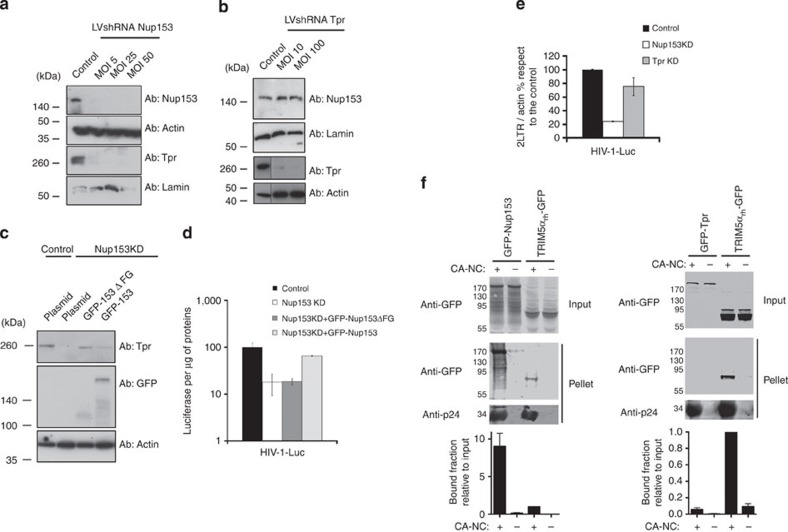
Figure 1
Depletion of Nup153 and Tpr followed by reconstitution of the nuclear basket by complementation and in vitro CAu2013NC binding assay.
( a , b ) We used the pTrip.GFP.H1shRNA vector to knockdown (KD) the expression of Nup153 and Tpr in HeLa P4CCR5 cells 13 14 . Viral particles produced using the pTrip.GFP.H1shRNA vector containing th...
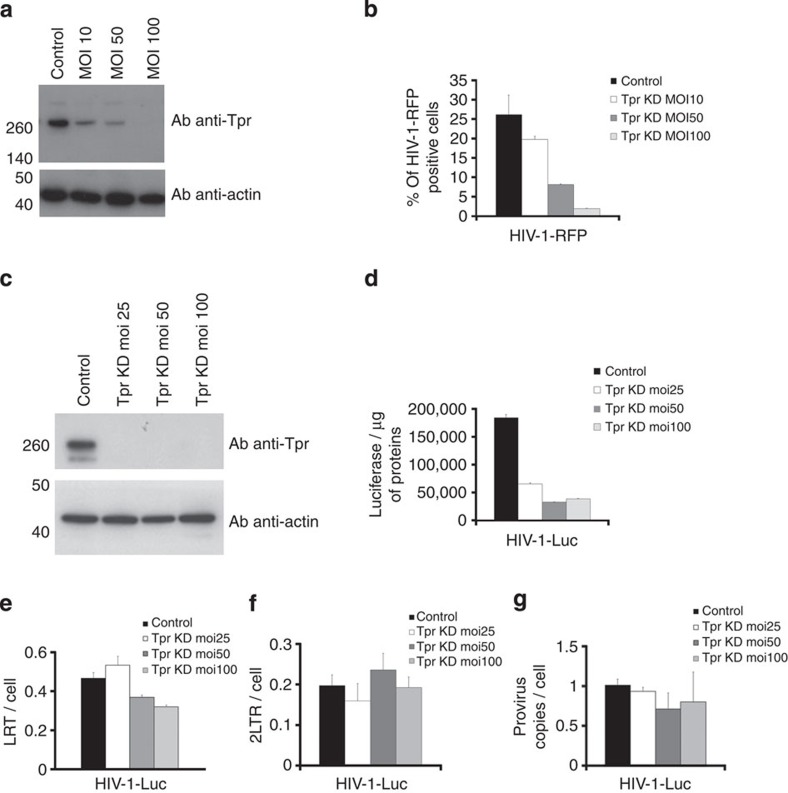
Figure 2
Involvement of Tpr in HIV-1 replication.
( a ) HeLa P4CCR5 cells were depleted for Tpr using different doses of LVshRNA against Tpr and ( b ) infectivity was measured 48u2009h p.i. by flow cytometry ( c ) Jurkat cells were depleted for Tpr u...
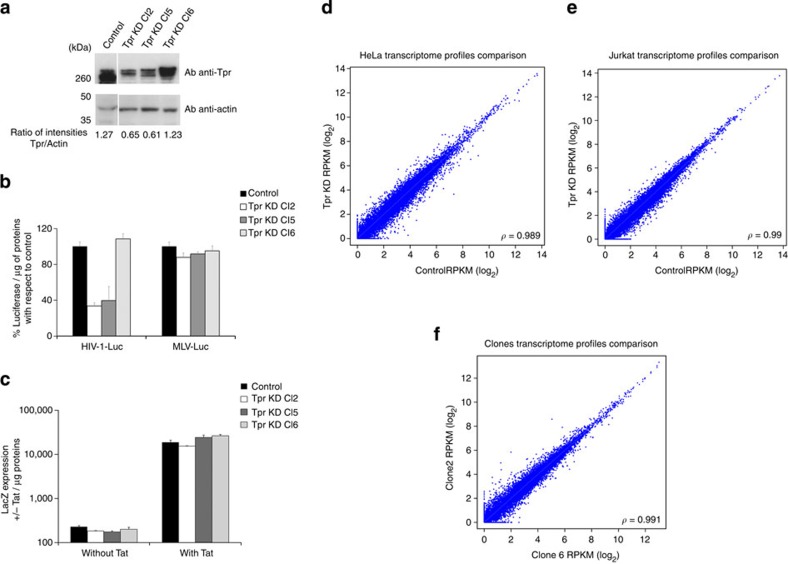
Figure 3
Tpr is specifically involved in HIV-1 infection.
( a ) Three out of ~10 final clones obtained by limiting dilution were selected for the expression of Tpr by western blotting and ( b ) MLV-Luc and HIV-1-Luc were used in parallel to infect the contro...
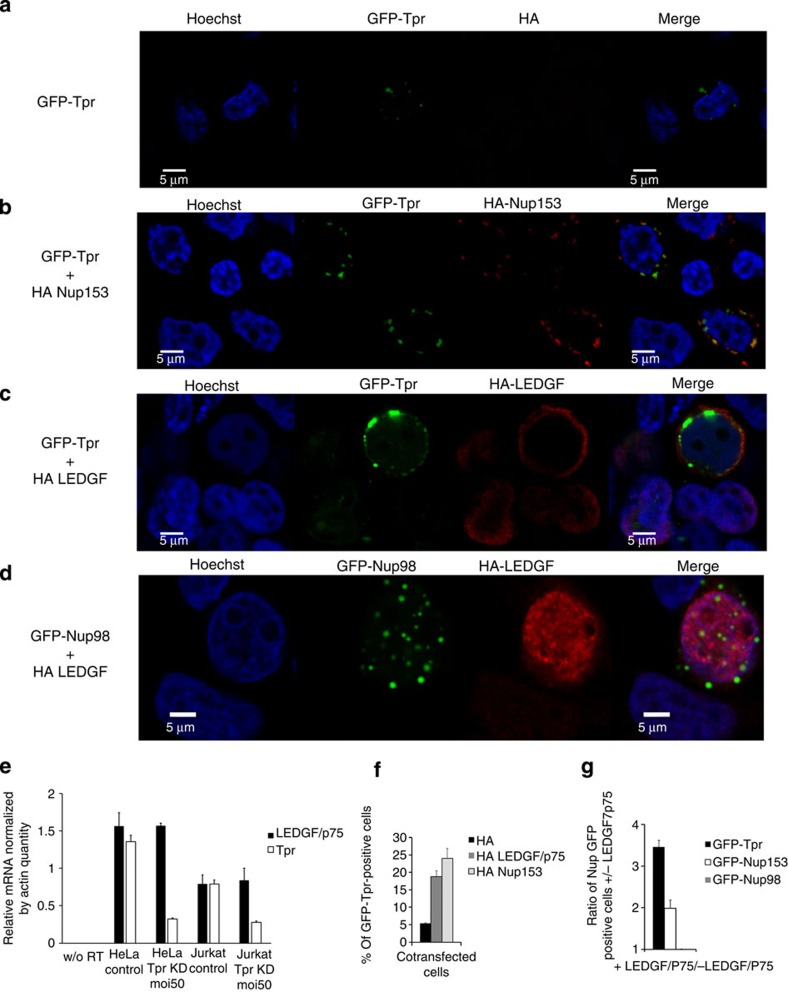
Figure 4
Increase of intensity of Tpr at the nuclear periphery by LEDGF/p75 overexpression and vice versa.
The 293 T cells were cotransfected with GFP-Tpr and ( a ) HA alone or ( b ) HA-Nup153 or ( c ) HA-LEDGF/p75. ( d ) As control we cotransfected GFP-Nup98 with HA-LEDGF/p75. HA fused proteins were detec...
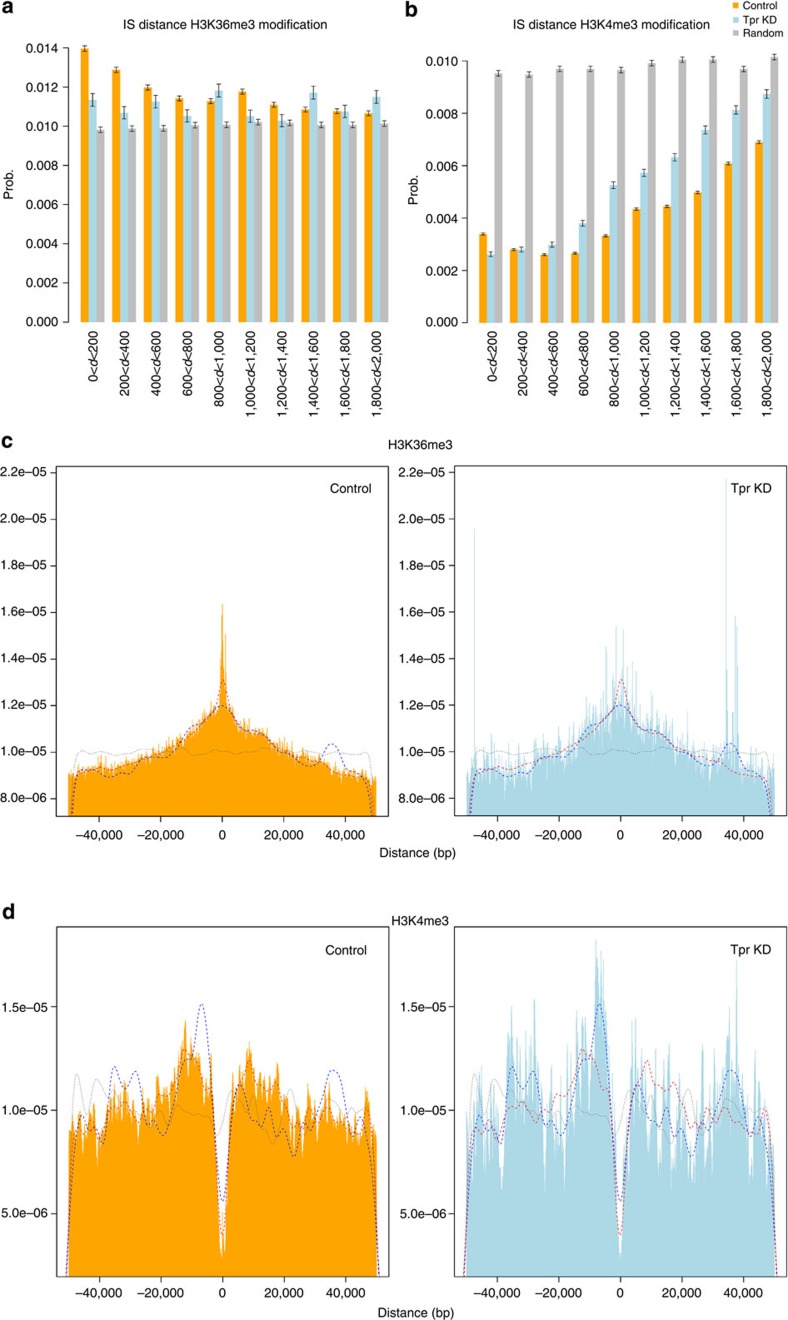
Figure 5
Short-range association between integration sites and genomic features.
( a , b ) Histograms show the distribution of absolute genomic distances to specific features of HIV-1 integration sites, with bin size of 200. The genomic features are Histone methylation H3K36me3 an...
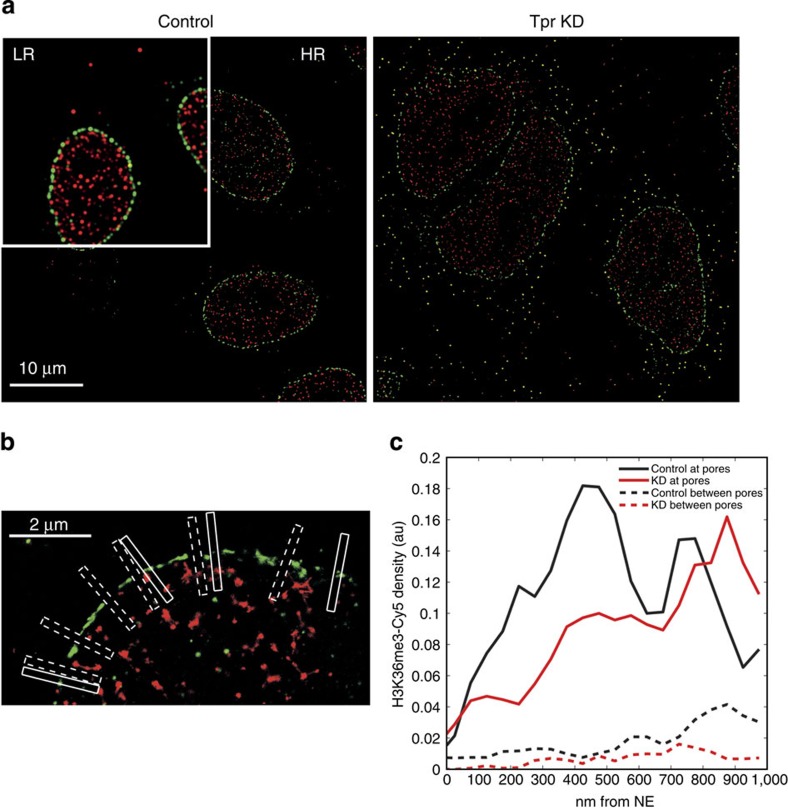
Figure 6
Super-resolution imaging of active chromatin underneath NPCs in control and Tpr depleted HeLa cells.
( a ) STORM image (visualized as smoothed histogram of computed positions) of Nup153-A568 (green) and H3K36me3-Cy5 (red) in control cells (left) and Tpr KD cells (right). The top left corner of the fi...
Figure images are served from the NIH/NLM PubMed Central Open Access Subset or Europe PMC; copyright remains with the publishers and authors.
💬 Discussion
0 commentsNo comments yet. Be the first to start a discussion!
Leave a Comment