Abstract
Nucleosomes block access to DNA methyltransferase, unless they are remodeled by DECREASE in DNA METHYLATION 1 (DDM1LSH/HELLS), a Snf2-like master regulator of epigenetic inheritance. We show that DDM1 promotes replacement of histone variant H3.3 by H3.1. In ddm1 mutants, DNA methylation is partly restored by loss of the H3.3 chaperone HIRA, while the H3.1 chaperone CAF-1 becomes essential. The single-particle cryo-EM structure at 3.2 Å of DDM1 with a variant nucleosome reveals engagement with histone H3.3 near residues required for assembly and with the unmodified H4 tail. An N-terminal autoinhibitory domain inhibits activity, while a disulfide bond in the helicase domain supports activity. DDM1 co-localizes with H3.1 and H3.3 during the cell cycle, and with the DNA methyltransferase MET1Dnmt1, but is blocked by H4K16 acetylation. The male germline H3.3 variant MGH3/HTR10 is resistant to remodeling by DDM1 and acts as a placeholder nucleosome in sperm cells for epigenetic inheritance.
🔬 Techniques
🔭 Microscopes
🧬 Organisms
💻 Software
✨ Fluorophores
🧪 Sample Preparation
🏭 Microscope Brands
🧪 Reagent Suppliers
📷 Detectors
💻 Software Details
💻 Code & Software
💾 Data Repositories
🏛️ Research Organizations (ROR)
Affiliated research institutions:
📋 Methods
RESOURCE AVAILABILITY Lead Contact Further information and requests for resources and materials should be directed to and will be fulfilled by the lead contact, Robert A. Martienssen ( martiens@cshl.edu ).
Materials availability
All materials generated in this study are available upon request to the lead contact.
Data and code availability
ChIP-sequencing and Bisulfite-sequencing data have been deposited at GEO and are publicly available as of the date of publication. Accession numbers are listed in the key resources table (GEO study: GSE231563 ). This paper also analyzes existing, publicly available data. These accession numbers for the datasets are listed in the key resources table . Coordinates and the cryo-electron microscopy map for the DDM1-nucleosome complex have been deposited in the Protein Data Bank and are publicly available as of the date of publication. Accession numbers are listed in the key resources table . (PDB: 7UX9; EMD-26855). All original code has been deposited at https://github.com/martienssenlab/DDM1-manuscript and is available as of the date of the publication. DOIs are also listed in the key resources table . Any additional information required to reanalyze the data reported in this paper is available from the lead contact upon request.
EXPERIMENTAL MODEL AND STUDY PARTICIPANT DETAILS
Seed stocks and plant materials Plants were grown under long day conditions at 22°C. Seeds were grown on ½ Murashige and Skoog (MS) medium and seedlings were transplanted to soil 7 day after germination for BS-seq, or harvested at 10 days for ChIP. For MGH3, ChIP was performed on mature pollen grains. All genotypes including wild-type and met1-1 , met1-7 , cmt3-11 , ddm1-2 , ddm1-10 , fas2-4 , hira-1 , and atrx-2 mutants are in the Col-0 background and described in Table S2 . The pHTR3:HTR3-GFP (referred herein as H3.1-GFP) and pHTR5:HTR5-RFP (referred to as H3.3-RFP) lines were previously reported 39 , as were htr4 htr5 htr8 /+ 55 , pMGH3:MGH3-GFP 103 , pHTR13:HTR13-CFP 104 and pDDM1:DDM1-GFP 44 . To generate mCherry reporter lines, genomic fragments of DDM1 (AT5G66750) and MET1 (AT5G49160) were cloned into the vector pDONR221 with the mCherry fragment inserted before the stop codon by NEBuilder HiFi DNA Assembly Master Mix (New England Biolabs) ( Table S3 for primer sequences). mCherry constructs in pDONR221 were transferred into the pB7WG binary destination vector using Gateway LR Clonase II (Thermo Fisher Scientific). pDDM1:DDM1 K233Q -mCherry was generated from pB7WG-pDDM1:DDM1-mCherry using the Q5 Site-Directed Mutagenesis Kit (New England Biolabs). For biomolecular complementation experiments, DDM1 and MET1 coding sequences were cloned into pBiFC2 and pBiFC4, respectively. DDM1-GFP constructs were shown to complement ddm1 mutants previously 44 . met1-1 mutants were late flowering (57 leaves, n=23), unlike WT Col-0 (15.6 leaves, n=12) and met1-1 mutants were partially complemented by MET1-mCherry (37.5 leaves, n=4). ddm1 fas2/+ plants had 19% aborted seed (n=122) while fas2 ddm1/+ plants had 17% aborted seeds (n=75). No double mutants were recovered (n>150). METHOD DETAILS Chromatin immunoprecipitation (ChIP) ChIP was performed as previously described 105 , starting with 1g of seedlings. In brief, after crosslinking in 1% formaldehyde for 10 min, the tissue was ground to a fine powder in liquid nitrogen, chromatin was extracted with 1% SDS Tris-based lysis buffer and sonicated to ~200bp fragments. Chromatin was cleared with protein A magnetic beads and incubated overnight with the antibody listed below. Immune complexes were eluted with low, and then high salt buffers, before reversing crosslinks and purifying DNA fragments with ChIP DNA clean and concentrator kit (Zymo Research). Low input ChIP for MGH3-GFP was performed with ~10e8 pollen grains. Fixation was for 15 min and subsequent grinding with acid-washed glass beads. DNA fragments underwent a preliminary phenol-chloroform and ethanol precipitation step before clean up. For histone modifications, anti-H3K27me1 (Active Motif; 61015) and anti-H3 antibodies (Abcam; ab1791), or anti-H4K16ac (EMD millipore; 07–329) and anti-H4 (abcam; ab10158) antibodies were used. For ChIP experiments against H3.1-GFP, H3.3-RFP, and DDM1-mCherry, GFP-trap (ChromoTek; gtma-10) or RFP-trap (ChromoTek; rtma-10) magnetic beads were used. For MGH3-GFP ChIP, anti-GFP (Thermo Fisher scientific; A-11122) polyclonal antibody was used. Polyclonal DDM1 antibodies were raised against a synthetic peptide (TINGIESESQKAEPEKTGRGRKRKAASQYNNTKAKRAVAAMISRSKE) outside the SWI/SNF domain by Covance antibody services. Anti-H3 was used as control for H3K27me1 and H3.3, anti-H4 was used as control for H4K16ac, and input DNA were used as controls for MGH3 and DDM1 ChIP-seq. After ChIP, qPCR was performed using KAPA SYBR FAST qPCR Master Mix (Kapa Biosystems). qPCR primers are listed in Table S3 . ChIP-sequencing (ChIP-seq) libraries were prepared with ~200 bp insert size using NEBNext Ultra II DNA Library Prep Kit for Illumina (New England Biolabs). The ChIP-seq libraries were sequenced using an Illumina NextSeq platform with 75-cycle single reads for H3K27me1 and HTR5 samples and with paired-end 151 cycles for DDM1 and H4K16ac samples. MGH3 libraries were prepared by Fasteris SA (Switzerland) and sequenced on HiSeq platform to 100bp paired-end reads for WT and 100bp single reads for ddm1/+. Only read1 was processed from the WT sample to compare to single-end ddm1/+. Sequencing metrics on all ChIP-seq libraries are listed in Table S4 . ChIP-seq data were analyzed as previously described 106 , trimming adapters with cutadapt 107 but using bowtie2 108 to map to TAIR10, before filtering primary alignements with samtools 109 . Two independent replicates of ChIP-seq were obtained for each antibody and genotype except for MGH3-GFP, which was compared instead to H3.3. The Pearson correlation coefficient was at least 0.8 for the replicates ( Figure S6A ). When available, the IP and control of the two biological replicates were merged after mapping and deduplication with samtools, and then the signal tracks (bigwig) were generated with Deeptools 95 by calculating the log2 fold change of IP over control after count-per-million normalization. MGH3 and H3.3 ChIP-seq datasets produced in this study have been compared to previously published datasets GSE120664 47 ( Figure S6B ) and from GSE34840 40 ( Figure S6C ), respectively. Figures were generated in R ( https://www.r-project.org/ ) using ggplot2 110 and GViz 111 packages. Heatmaps were generated with Deeptools. Bisulfite sequencing (BS-seq) Genomic DNA (gDNA) was extracted from rosette leaves of 3–4 plants for each genotype with Nucleon PhytoPure Genomic DNA Extraction Kits (Cytiva). 1 μg gDNA samples were sheared to an average size of 400 bp using a Covaris S220 focused-ultrasonicator. BS-seq libraries were made using the NEXTFLEX Bisulfite Library Prep Kit (PerkinElmer). The library samples were sequenced as paired-end 101bp reads with an Illumina NextSeq system. Sequencing metrics on all Bisulfite sequencing libraries are listed in Table S4 . Adaptors were trimmed using Cutadapt 107 and aligned to the TAIR10 reference genome with Bismark 112 . Duplicate reads were collapsed, and methylation levels at each cytosine were calculated as a ratio of #C / (#C + #T). DMRs were defined using DMRcaller 113 . A minimum difference of 30%, 20%, and 10% was used for DMRs in CG, CHG, and CHH contexts, respectively. Two independent biological replicates were performed for each genotype, showing high reproducibility (Pearson correlation > 0.9, Figure S6D , E ). Figures were generated in R ( https://www.r-project.org/ ) using ggplot2 110 and GViz 111 packages. Nuclear fractionation Soluble and insoluble chromatin fractions were obtained as previously described 114 . Briefly, 0.3 mL of seedling tissues were incubated in 0.6 mL N1 buffer (15 mM Tris-HCl, pH 7.5, 60 mM KCl, 15 mM NaCl, 5 mM MgCl 2 , 1 mM CaCl 2 , 1 mM DTT, and 250 mM sucrose, with Complete Mini EDTA-free protease inhibitor and PhosSTOP (Roche)) on ice for 30 mins. After filtering the extract with 30 μm CellTrics filters (Sysmex), nuclei were isolated by centrifugation at 4 °C and 1000g for 10 min. Nuclei were washed twice with N2 buffer (15 mM Tris-HCl, pH 7.5, 60 mM KCl, 15 mM NaCl, 5 mM MgCl 2 , 1 mM CaCl 2 , and 1 mM DTT, with Complete Mini EDTA-free protease inhibitor and PhosSTOP) and subsequently incubated with 600 μL of N3 buffer (15 mM Tris-HCl, pH 7.5, 150 mM NaCl, 5 mM MgCl 2 , 1 mM CaCl 2 , and 1 mM DTT, with Complete Mini EDTA-free protease inhibitor and PhosSTOP) for 30 min. The samples were centrifuged at 12,800g and 4 °C for 15 min to yield the soluble and insoluble pellet fractions. Soluble fractions were concentrated by vortexing with StrataClean resin (Agilent) for 1 min. Samples were boiled at 95 °C in SDS loading buffer and used for Western blot experiments. Anti-DDM1, anti-RFP (Rockland; 600-401-379) and anti-H3 (Abcam; ab1791) antibodies were used for detection of endogenous DDM1, DDM1-mCherry, and H3, respectively.
Show full methods section
RESOURCE AVAILABILITY Lead Contact Further information and requests for resources and materials should be directed to and will be fulfilled by the lead contact, Robert A. Martienssen ( martiens@cshl.edu ).
Materials availability
All materials generated in this study are available upon request to the lead contact.
Data and code availability
ChIP-sequencing and Bisulfite-sequencing data have been deposited at GEO and are publicly available as of the date of publication. Accession numbers are listed in the key resources table (GEO study: GSE231563 ). This paper also analyzes existing, publicly available data. These accession numbers for the datasets are listed in the key resources table . Coordinates and the cryo-electron microscopy map for the DDM1-nucleosome complex have been deposited in the Protein Data Bank and are publicly available as of the date of publication. Accession numbers are listed in the key resources table . (PDB: 7UX9; EMD-26855). All original code has been deposited at https://github.com/martienssenlab/DDM1-manuscript and is available as of the date of the publication. DOIs are also listed in the key resources table . Any additional information required to reanalyze the data reported in this paper is available from the lead contact upon request.
EXPERIMENTAL MODEL AND STUDY PARTICIPANT DETAILS
Seed stocks and plant materials Plants were grown under long day conditions at 22°C. Seeds were grown on ½ Murashige and Skoog (MS) medium and seedlings were transplanted to soil 7 day after germination for BS-seq, or harvested at 10 days for ChIP. For MGH3, ChIP was performed on mature pollen grains. All genotypes including wild-type and met1-1 , met1-7 , cmt3-11 , ddm1-2 , ddm1-10 , fas2-4 , hira-1 , and atrx-2 mutants are in the Col-0 background and described in Table S2 . The pHTR3:HTR3-GFP (referred herein as H3.1-GFP) and pHTR5:HTR5-RFP (referred to as H3.3-RFP) lines were previously reported 39 , as were htr4 htr5 htr8 /+ 55 , pMGH3:MGH3-GFP 103 , pHTR13:HTR13-CFP 104 and pDDM1:DDM1-GFP 44 . To generate mCherry reporter lines, genomic fragments of DDM1 (AT5G66750) and MET1 (AT5G49160) were cloned into the vector pDONR221 with the mCherry fragment inserted before the stop codon by NEBuilder HiFi DNA Assembly Master Mix (New England Biolabs) ( Table S3 for primer sequences). mCherry constructs in pDONR221 were transferred into the pB7WG binary destination vector using Gateway LR Clonase II (Thermo Fisher Scientific). pDDM1:DDM1 K233Q -mCherry was generated from pB7WG-pDDM1:DDM1-mCherry using the Q5 Site-Directed Mutagenesis Kit (New England Biolabs). For biomolecular complementation experiments, DDM1 and MET1 coding sequences were cloned into pBiFC2 and pBiFC4, respectively. DDM1-GFP constructs were shown to complement ddm1 mutants previously 44 . met1-1 mutants were late flowering (57 leaves, n=23), unlike WT Col-0 (15.6 leaves, n=12) and met1-1 mutants were partially complemented by MET1-mCherry (37.5 leaves, n=4). ddm1 fas2/+ plants had 19% aborted seed (n=122) while fas2 ddm1/+ plants had 17% aborted seeds (n=75). No double mutants were recovered (n>150). METHOD DETAILS Chromatin immunoprecipitation (ChIP) ChIP was performed as previously described 105 , starting with 1g of seedlings. In brief, after crosslinking in 1% formaldehyde for 10 min, the tissue was ground to a fine powder in liquid nitrogen, chromatin was extracted with 1% SDS Tris-based lysis buffer and sonicated to ~200bp fragments. Chromatin was cleared with protein A magnetic beads and incubated overnight with the antibody listed below. Immune complexes were eluted with low, and then high salt buffers, before reversing crosslinks and purifying DNA fragments with ChIP DNA clean and concentrator kit (Zymo Research). Low input ChIP for MGH3-GFP was performed with ~10e8 pollen grains. Fixation was for 15 min and subsequent grinding with acid-washed glass beads. DNA fragments underwent a preliminary phenol-chloroform and ethanol precipitation step before clean up. For histone modifications, anti-H3K27me1 (Active Motif; 61015) and anti-H3 antibodies (Abcam; ab1791), or anti-H4K16ac (EMD millipore; 07–329) and anti-H4 (abcam; ab10158) antibodies were used. For ChIP experiments against H3.1-GFP, H3.3-RFP, and DDM1-mCherry, GFP-trap (ChromoTek; gtma-10) or RFP-trap (ChromoTek; rtma-10) magnetic beads were used. For MGH3-GFP ChIP, anti-GFP (Thermo Fisher scientific; A-11122) polyclonal antibody was used. Polyclonal DDM1 antibodies were raised against a synthetic peptide (TINGIESESQKAEPEKTGRGRKRKAASQYNNTKAKRAVAAMISRSKE) outside the SWI/SNF domain by Covance antibody services. Anti-H3 was used as control for H3K27me1 and H3.3, anti-H4 was used as control for H4K16ac, and input DNA were used as controls for MGH3 and DDM1 ChIP-seq. After ChIP, qPCR was performed using KAPA SYBR FAST qPCR Master Mix (Kapa Biosystems). qPCR primers are listed in Table S3 . ChIP-sequencing (ChIP-seq) libraries were prepared with ~200 bp insert size using NEBNext Ultra II DNA Library Prep Kit for Illumina (New England Biolabs). The ChIP-seq libraries were sequenced using an Illumina NextSeq platform with 75-cycle single reads for H3K27me1 and HTR5 samples and with paired-end 151 cycles for DDM1 and H4K16ac samples. MGH3 libraries were prepared by Fasteris SA (Switzerland) and sequenced on HiSeq platform to 100bp paired-end reads for WT and 100bp single reads for ddm1/+. Only read1 was processed from the WT sample to compare to single-end ddm1/+. Sequencing metrics on all ChIP-seq libraries are listed in Table S4 . ChIP-seq data were analyzed as previously described 106 , trimming adapters with cutadapt 107 but using bowtie2 108 to map to TAIR10, before filtering primary alignements with samtools 109 . Two independent replicates of ChIP-seq were obtained for each antibody and genotype except for MGH3-GFP, which was compared instead to H3.3. The Pearson correlation coefficient was at least 0.8 for the replicates ( Figure S6A ). When available, the IP and control of the two biological replicates were merged after mapping and deduplication with samtools, and then the signal tracks (bigwig) were generated with Deeptools 95 by calculating the log2 fold change of IP over control after count-per-million normalization. MGH3 and H3.3 ChIP-seq datasets produced in this study have been compared to previously published datasets GSE120664 47 ( Figure S6B ) and from GSE34840 40 ( Figure S6C ), respectively. Figures were generated in R ( https://www.r-project.org/ ) using ggplot2 110 and GViz 111 packages. Heatmaps were generated with Deeptools. Bisulfite sequencing (BS-seq) Genomic DNA (gDNA) was extracted from rosette leaves of 3–4 plants for each genotype with Nucleon PhytoPure Genomic DNA Extraction Kits (Cytiva). 1 μg gDNA samples were sheared to an average size of 400 bp using a Covaris S220 focused-ultrasonicator. BS-seq libraries were made using the NEXTFLEX Bisulfite Library Prep Kit (PerkinElmer). The library samples were sequenced as paired-end 101bp reads with an Illumina NextSeq system. Sequencing metrics on all Bisulfite sequencing libraries are listed in Table S4 . Adaptors were trimmed using Cutadapt 107 and aligned to the TAIR10 reference genome with Bismark 112 . Duplicate reads were collapsed, and methylation levels at each cytosine were calculated as a ratio of #C / (#C + #T). DMRs were defined using DMRcaller 113 . A minimum difference of 30%, 20%, and 10% was used for DMRs in CG, CHG, and CHH contexts, respectively. Two independent biological replicates were performed for each genotype, showing high reproducibility (Pearson correlation > 0.9, Figure S6D , E ). Figures were generated in R ( https://www.r-project.org/ ) using ggplot2 110 and GViz 111 packages. Nuclear fractionation Soluble and insoluble chromatin fractions were obtained as previously described 114 . Briefly, 0.3 mL of seedling tissues were incubated in 0.6 mL N1 buffer (15 mM Tris-HCl, pH 7.5, 60 mM KCl, 15 mM NaCl, 5 mM MgCl 2 , 1 mM CaCl 2 , 1 mM DTT, and 250 mM sucrose, with Complete Mini EDTA-free protease inhibitor and PhosSTOP (Roche)) on ice for 30 mins. After filtering the extract with 30 μm CellTrics filters (Sysmex), nuclei were isolated by centrifugation at 4 °C and 1000g for 10 min. Nuclei were washed twice with N2 buffer (15 mM Tris-HCl, pH 7.5, 60 mM KCl, 15 mM NaCl, 5 mM MgCl 2 , 1 mM CaCl 2 , and 1 mM DTT, with Complete Mini EDTA-free protease inhibitor and PhosSTOP) and subsequently incubated with 600 μL of N3 buffer (15 mM Tris-HCl, pH 7.5, 150 mM NaCl, 5 mM MgCl 2 , 1 mM CaCl 2 , and 1 mM DTT, with Complete Mini EDTA-free protease inhibitor and PhosSTOP) for 30 min. The samples were centrifuged at 12,800g and 4 °C for 15 min to yield the soluble and insoluble pellet fractions. Soluble fractions were concentrated by vortexing with StrataClean resin (Agilent) for 1 min. Samples were boiled at 95 °C in SDS loading buffer and used for Western blot experiments. Anti-DDM1, anti-RFP (Rockland; 600-401-379) and anti-H3 (Abcam; ab1791) antibodies were used for detection of endogenous DDM1, DDM1-mCherry, and H3, respectively.
Microscopy
Immunofluorescence experiments for leaf nuclei were performed using 3-week-old leaves as previously described 115 . Monoclonal antibodies of anti-H3K27me1 (Active Motif; 61015) were used as primary antibodies and goat anti-mouse Alexa Fluor 488 (Thermo Fisher Scientific; A-10680) was used as secondary antibody. DAPI (2 μg/mL final concentration) was used for nuclei staining and the samples were mounted with Prolong Diamond (Thermo Fisher Scientific). DDM1-GFP, DDM1-mCherry, HTR3-GFP, and HTR5-RFP were observed with a Zeiss 710 confocal microscope. Live imaging data of DDM1-GFP was acquired using a Perkin-Elmer UltraVIEW VoX confocal microscope.
Expression and purification of DDM1 protein
His-TEV-DDM1 and His-TEV-DDM1(Δ1–132) were transformed into the E.coli strain BL21-CodonPlus (DE3)-RIPL (Agilent) for large-scale expression using standard methods. Briefly, cultures were grown in Terrific Broth media supplemented with appropriate antibiotic(s) at 37°C to a culture density of approximately OD λ=600 nm of 1.2. Cultures were then cooled in an ice water bath for 15 minutes followed by induction of protein expression with 0.5 mM IPTG. Induction proceeded overnight at 16 °C with shaking at 220 rpm. Cells were harvested by centrifugation at 4000g for 30 minutes at 4 °C. The supernatant was discarded and the pelleted cells were taken for protein purification. For Ni-NTA purification, cell pellets were resuspended in 20 mL lysis buffer (20 mM Tris, pH 8.0, 300 mM NaCl, 5 mM MgCl 2 , 10% glycerol, 1 mM TCEP, 20 mM imidazole) per liter culture. Protease inhibitors and 0.1% Triton-X were next added to the resuspension and the cells lysed by sonication. Turbo nuclease (Accelagen) was added to the cell lysate (2.5 units per mL of cell resuspension) and the lysate was then clarified by ultracentrifugation at roughly 100,000g for 30 minutes. The soluble supernatant was taken for affinity purification via batch binding with Ni-NTA resin (2 mL of beads per liter culture), pre-equilibrated with lysis buffer. Batch binding was performed for 2–3 hours at 4 °C with gentle agitation. The Ni-NTA beads were then collected by centrifugation at 1000g for 5 minutes, resuspended in lysis buffer, then transferred to a column for further washing and elution. Beads were washed with 20 column volumes of lysis buffer followed by elution of the target protein in lysis buffer supplemented with 100–250 mM imidazole. To remove the affinity tag, TEV protease was added in a 1:20 mass ratio (protease:DDM1) and incubated overnight at 4 °C. In addition, DTT was added to a final concentration of 10 mM to limit aggregation. Protein was further purified using a HiTrap Heparin HP column (Cytiva/GE Healthcare Life Sciences). Digested protein was first diluted two-fold with low salt buffer (20 mM Tris, pH 8.0, 1 mM DTT) prior to loading the heparin column. The target protein was then eluted using a 25–75% gradient of high salt buffer (20 mM Tris, pH 8.0, 1 mM DTT, 1 M NaCl) over approximately 50 mL. Peak fractions were assessed by SDS-PAGE then selected and pooled for further purification. Pooled fractions were concentrated to 500 μL and applied to a Superdex 200 increase 10/300 column (Cytiva/GE Healthcare Life Sciences). The protein was chromatographed over ~30 mL at a flow rate of 0.6 mL/min in a running buffer of 20 mM Tris, pH 8.0, 300 mM NaCl, 5 mM MgCl 2 , 1 mM TCEP. Peak fractions were assessed by SDS-PAGE. Fractions with highly-purified protein were concentrated, then taken for enzymatic assays and/or storage. For long-term storage the protein was flash frozen in liquid nitrogen, then kept at −80 °C. Typical yields were 1–2 mg of highly purified protein (>98% pure as assessed by SDS-PAGE) per liter culture. DDM1 ATPase, remodeling, gel shift, and peptide-binding assays DDM1 ATPase assays were performed in reaction buffer (10 mM Tris pH 7.5, 50 mM NaCl, 10 mM MgCl 2 , 20% Glycerol) containing various ATP concentrations and quantified using the ADP-Glo MAX Assay (Promega; Catalog No. V7001) as described previously 116 . The double-stranded DNA substrate was prepared by PCR amplification of the Widom 601 DNA sequence described in the remodeling assays below (see Table S3 for primer sequence information). Methylated DNA was amplified by PCR in the presence of 5m-dCTP rather than dCTP (New England Biolabs). Additional experimental procedures followed the manufacturer’s guidelines. Luminescence was quantified using GloMax-Multi+ Detection System (Promega). DDM1 nucleosome remodeling assays were performed with mononucleosomes. Histone octamers consisting of Arabidopsis H2A.W (AT5G59870), H3.3 (At5g10980), H3.1 (At1g09200), H2A (AT3G20670) and H2B (AT3G45980), and Xenopus H4 were assembled as described previously 117 . Briefly, core histones were expressed in E. coli , solubilized from inclusion bodies, and purified by sequential anion and cation exchange chromatography before refolding into histone octamers and purifying by size exclusion chromatography. Nucleosomes were assembled by gradient dialysis against TE buffer at 4 °C overnight with 147 bp core Widom 601 DNA, with or without a 60 bp-overhang (underlined), as indicated 5’-CTGGAGAATCCCGGTGCCGAGGCCGCTCAATTGGTCGTAGACAGCTCTAGCACCG CTTAAACGCACGTACGCGCTGTCCCCCGCGTTTTAACCGCCAAGGGGATTACTCC CTAGTCTCCAGGCACGTGTCAGATATATACATCCTGT GCATGTATTGAACAGCGAC CTTGCCGGTGCCAGTCGGATAGTGTTCCGAGCTCCCACTCT -3’ 63 . For remodeling assays, the reaction buffer contained 20 mM Tris-HCl, pH 8.0, 75 mM NaCl, 2 mM MgCl 2 , and 1 mM ATP. After adding DDM1 to Widom 601 + 60 bp nucleosome samples in a 2:1 ratio, the reactions were incubated at 25 °C and stopped by addition of 5 mM EDTA and excess plasmid DNA. Reaction samples were resolved by 6% native PAGE (37.5:1 acrylamide:bis-acrylamide) run in 0.5× TBE buffer and stained with SYBR Gold (Thermo Fisher Scientific). For gel shift assays, nucleosomes were assembled with 147 bp core Widom 601 DNA. In brief, DDM1 was mixed with nucleosomes in the binding buffer (20 mM Tris-HCl, pH 8.0, 75 mM NaCl, 2 mM MgCl 2 ) and incubated for 30 min. The DDM1-nucleosome complex samples were resolved by 6% native PAGE in 0.5 × TBE (29:1 acrylamide:bis-acrylamide). Peptide binding assays of purified His-TEV-DDM1 or His-TEV-DDM1[132-end] were measured using a Monolith NT.115 Pico running MO Control version 1.6 (NanoTemper Technologies). Assays were performed in PBS-T (137 mM NaCl, 2.7 mM KCl, 10 mM Na2HPO4, 1.8m mM KH2PO4, 0.1% Tween-20) for DDM1 and PBS-T supplemented with 1mM ADP for DDM1[132-end]. His-label RED-tris-NTA (NanoTemper Technologies) labeled DDM1 or DDM1[132-end] (5 nM) was mixed with 16 serial dilutions of histone H4 peptides starting at 1 mM and loaded into microscale thermophoresis premium coated capillaries (NanoTemper Technologies). MST measurements were recorded at 23°C using 20% excitation power and 60% MST power. Measurements were performed in triplicate (except 132-end). Determination of the binding constant was performed using MO Affinity Analysis v.2.3.
Cryo-electron microscopy sample preparation Purified
DDM1 and reconstituted nucleosomes (H2A.W, H2B, H3.3, H4, and 147 bp DNA) were each desalted into binding buffer (10 mM HEPES, pH 7.5, 50 mM NaCl). DDM1 at 1.3 mg/mL and nucleosomes at ~0.16 mg/mL were then mixed in a 4:1 molar ratio and incubated at room temperature for 10 minutes. DDM1-nucleosome complexes were cross-linked with 0.05% glutaraldehyde for 15 minutes then quenched by the addition of 2 mM Tris, pH 8.0. After five minutes at room temperature, the slowly-hydrolyzable ATP analog ATP-γ-S and MgCl 2 were added to final concentrations of 1 mM and 2 mM, respectively. The reaction was incubated at 4°C overnight. For cryo-EM grid preparation, 4 μL samples at approximately 0.35 mg/mL were applied to glow-discharged Quantifoil 0.6/1 300 μm mesh copper grids. After a 10 s incubation at 25 °C and 95% humidity, samples were blotted for 2.5 s then plunged into liquid ethane using an Automatic Plunge Freezer EM GP2 (Leica).
Cryo-electron microscopy data acquisition
Data were acquired on a Titan Krios transmission electron microscope (ThermoFisher) operating at 300 keV. EPU data collection software version 2.10.0.5 (ThermoFisher) was used to collect micrographs at a nominal magnification of 81,000x (1.1 Å/pixel) and defocus range of −1.0 to −2.2 μm. Dose-fractionated movies were collected using a K3 direct electron detector (Gatan) operating in electron counting mode. In total, 30 frames were collected over a 4.8 s exposure. The exposure rate was 14.8 e − /Å 2 /s, which resulted in a cumulative exposure of approximately 71.2 e − /Å 2 . In total, 8,165 micrographs were collected.
Cryo-electron microscopy data processing
Real-time image processing (motion correction, CTF estimation, and particle picking) was performed concurrently with data collection using WARP version 1.0.9 96 . Automated particle picking was performed with the BoxNet pretrained deep convolutional neural network bundle included with WARP that is implemented in TensorFlow. A particle diameter of 180 Å and a threshold score of 0.6 yielded 3,788,872 particle coordinates. Of the particles collected during cryo-EM acquisition, nearly three-quarters were free nucleosomes. Classification and refinement were carried out in cryoSPARC v3.2.0+210831 97 . Initial 2D classification showed distinct classes of nucleosomes both bound to and independent of DDM1. To isolate the DDM1-bound nucleosome particles, 2D classes were first manually inspected. Classes that clearly showed the presence of DDM1 - typically top views - were preferentially selected (497,127 particles) for ab initio reconstruction of four, 3D classes using a 200,000 particle subset. The resulting models (one of which showing DDM1-bound nucleosome), were then used for 3D heterogenous refinement with the full particle set. The resulting DDM1-bound nucleosome class was then taken for iterative rounds of homogenous refinement, non-uniform refinement, and further filtering using the refined reconstruction together with DDM1-free nucleosome decoy classes. The final non-uniform refined reconstruction was generated from 215,066 particles and had a resolution of 3.2 Å according to the gold standard FSC.
Molecular model building and refinement
An atomic model of the SWI/SNF nucleosome complex (PDB: 6UXW) 118 and the AlphaFold prediction of DDM1 119 were used as initial references for model building in Coot version 0.9.2-pre 120 . After the initial build was generated, density modification was performed using Resolve 121 . Subsequent rounds of interactive model building and refinement were performed with Coot and Phenix version 1.19.2-4158-000 122 , respectively. Secondary structure restraints for both the protein (α-helix and β-strand) and DNA (base-stacking and base-pairing) were used throughout refinement. Structure validation was conducted by MolProbity version 4.5.1 123 . Data collection, processing, and model validation statistics are provided in Tables S5 and S6 . Molecular graphics Figures of molecular models were generated using ChimeraX version 1.2.5 124 . Electrostatic surface calculations were performed by APBS 100 with a solvent ion concentration of 0.15 M at 298 K using the PARSE force field. Superpositioning of structural homologs was performed by the DALI server 125 . Conservation analysis was performed using the Consurf server 98 .
QUANTIFICATION AND STATISTICAL ANALYSIS
The statistical details of analysis applied in this paper are provided alongside in the figure legends.
Materials availability
All materials generated in this study are available upon request to the lead contact.
EXPERIMENTAL MODEL AND STUDY PARTICIPANT DETAILS
Seed stocks and plant materials Plants were grown under long day conditions at 22°C. Seeds were grown on ½ Murashige and Skoog (MS) medium and seedlings were transplanted to soil 7 day after germination for BS-seq, or harvested at 10 days for ChIP. For MGH3, ChIP was performed on mature pollen grains. All genotypes including wild-type and met1-1 , met1-7 , cmt3-11 , ddm1-2 , ddm1-10 , fas2-4 , hira-1 , and atrx-2 mutants are in the Col-0 background and described in Table S2 . The pHTR3:HTR3-GFP (referred herein as H3.1-GFP) and pHTR5:HTR5-RFP (referred to as H3.3-RFP) lines were previously reported 39 , as were htr4 htr5 htr8 /+ 55 , pMGH3:MGH3-GFP 103 , pHTR13:HTR13-CFP 104 and pDDM1:DDM1-GFP 44 . To generate mCherry reporter lines, genomic fragments of DDM1 (AT5G66750) and MET1 (AT5G49160) were cloned into the vector pDONR221 with the mCherry fragment inserted before the stop codon by NEBuilder HiFi DNA Assembly Master Mix (New England Biolabs) ( Table S3 for primer sequences). mCherry constructs in pDONR221 were transferred into the pB7WG binary destination vector using Gateway LR Clonase II (Thermo Fisher Scientific). pDDM1:DDM1 K233Q -mCherry was generated from pB7WG-pDDM1:DDM1-mCherry using the Q5 Site-Directed Mutagenesis Kit (New England Biolabs). For biomolecular complementation experiments, DDM1 and MET1 coding sequences were cloned into pBiFC2 and pBiFC4, respectively. DDM1-GFP constructs were shown to complement ddm1 mutants previously 44 . met1-1 mutants were late flowering (57 leaves, n=23), unlike WT Col-0 (15.6 leaves, n=12) and met1-1 mutants were partially complemented by MET1-mCherry (37.5 leaves, n=4). ddm1 fas2/+ plants had 19% aborted seed (n=122) while fas2 ddm1/+ plants had 17% aborted seeds (n=75). No double mutants were recovered (n>150).
Seed stocks and plant materials Plants were grown under long day conditions at 22°C. Seeds were grown on ½ Murashige and Skoog (MS) medium and seedlings were transplanted to soil 7 day after germination for BS-seq, or harvested at 10 days for ChIP. For MGH3, ChIP was performed on mature pollen grains. All genotypes including wild-type and met1-1 , met1-7 , cmt3-11 , ddm1-2 , ddm1-10 , fas2-4 , hira-1 , and atrx-2 mutants are in the Col-0 background and described in Table S2 . The pHTR3:HTR3-GFP (referred herein as H3.1-GFP) and pHTR5:HTR5-RFP (referred to as H3.3-RFP) lines were previously reported 39 , as were htr4 htr5 htr8 /+ 55 , pMGH3:MGH3-GFP 103 , pHTR13:HTR13-CFP 104 and pDDM1:DDM1-GFP 44 . To generate mCherry reporter lines, genomic fragments of DDM1 (AT5G66750) and MET1 (AT5G49160) were cloned into the vector pDONR221 with the mCherry fragment inserted before the stop codon by NEBuilder HiFi DNA Assembly Master Mix (New England Biolabs) ( Table S3 for primer sequences). mCherry constructs in pDONR221 were transferred into the pB7WG binary destination vector using Gateway LR Clonase II (Thermo Fisher Scientific). pDDM1:DDM1 K233Q -mCherry was generated from pB7WG-pDDM1:DDM1-mCherry using the Q5 Site-Directed Mutagenesis Kit (New England Biolabs). For biomolecular complementation experiments, DDM1 and MET1 coding sequences were cloned into pBiFC2 and pBiFC4, respectively. DDM1-GFP constructs were shown to complement ddm1 mutants previously 44 . met1-1 mutants were late flowering (57 leaves, n=23), unlike WT Col-0 (15.6 leaves, n=12) and met1-1 mutants were partially complemented by MET1-mCherry (37.5 leaves, n=4). ddm1 fas2/+ plants had 19% aborted seed (n=122) while fas2 ddm1/+ plants had 17% aborted seeds (n=75). No double mutants were recovered (n>150).
METHOD DETAILS Chromatin immunoprecipitation (ChIP) ChIP was performed as previously described 105 , starting with 1g of seedlings. In brief, after crosslinking in 1% formaldehyde for 10 min, the tissue was ground to a fine powder in liquid nitrogen, chromatin was extracted with 1% SDS Tris-based lysis buffer and sonicated to ~200bp fragments. Chromatin was cleared with protein A magnetic beads and incubated overnight with the antibody listed below. Immune complexes were eluted with low, and then high salt buffers, before reversing crosslinks and purifying DNA fragments with ChIP DNA clean and concentrator kit (Zymo Research). Low input ChIP for MGH3-GFP was performed with ~10e8 pollen grains. Fixation was for 15 min and subsequent grinding with acid-washed glass beads. DNA fragments underwent a preliminary phenol-chloroform and ethanol precipitation step before clean up. For histone modifications, anti-H3K27me1 (Active Motif; 61015) and anti-H3 antibodies (Abcam; ab1791), or anti-H4K16ac (EMD millipore; 07–329) and anti-H4 (abcam; ab10158) antibodies were used. For ChIP experiments against H3.1-GFP, H3.3-RFP, and DDM1-mCherry, GFP-trap (ChromoTek; gtma-10) or RFP-trap (ChromoTek; rtma-10) magnetic beads were used. For MGH3-GFP ChIP, anti-GFP (Thermo Fisher scientific; A-11122) polyclonal antibody was used. Polyclonal DDM1 antibodies were raised against a synthetic peptide (TINGIESESQKAEPEKTGRGRKRKAASQYNNTKAKRAVAAMISRSKE) outside the SWI/SNF domain by Covance antibody services. Anti-H3 was used as control for H3K27me1 and H3.3, anti-H4 was used as control for H4K16ac, and input DNA were used as controls for MGH3 and DDM1 ChIP-seq. After ChIP, qPCR was performed using KAPA SYBR FAST qPCR Master Mix (Kapa Biosystems). qPCR primers are listed in Table S3 . ChIP-sequencing (ChIP-seq) libraries were prepared with ~200 bp insert size using NEBNext Ultra II DNA Library Prep Kit for Illumina (New England Biolabs). The ChIP-seq libraries were sequenced using an Illumina NextSeq platform with 75-cycle single reads for H3K27me1 and HTR5 samples and with paired-end 151 cycles for DDM1 and H4K16ac samples. MGH3 libraries were prepared by Fasteris SA (Switzerland) and sequenced on HiSeq platform to 100bp paired-end reads for WT and 100bp single reads for ddm1/+. Only read1 was processed from the WT sample to compare to single-end ddm1/+. Sequencing metrics on all ChIP-seq libraries are listed in Table S4 . ChIP-seq data were analyzed as previously described 106 , trimming adapters with cutadapt 107 but using bowtie2 108 to map to TAIR10, before filtering primary alignements with samtools 109 . Two independent replicates of ChIP-seq were obtained for each antibody and genotype except for MGH3-GFP, which was compared instead to H3.3. The Pearson correlation coefficient was at least 0.8 for the replicates ( Figure S6A ). When available, the IP and control of the two biological replicates were merged after mapping and deduplication with samtools, and then the signal tracks (bigwig) were generated with Deeptools 95 by calculating the log2 fold change of IP over control after count-per-million normalization. MGH3 and H3.3 ChIP-seq datasets produced in this study have been compared to previously published datasets GSE120664 47 ( Figure S6B ) and from GSE34840 40 ( Figure S6C ), respectively. Figures were generated in R ( https://www.r-project.org/ ) using ggplot2 110 and GViz 111 packages. Heatmaps were generated with Deeptools. Bisulfite sequencing (BS-seq) Genomic DNA (gDNA) was extracted from rosette leaves of 3–4 plants for each genotype with Nucleon PhytoPure Genomic DNA Extraction Kits (Cytiva). 1 μg gDNA samples were sheared to an average size of 400 bp using a Covaris S220 focused-ultrasonicator. BS-seq libraries were made using the NEXTFLEX Bisulfite Library Prep Kit (PerkinElmer). The library samples were sequenced as paired-end 101bp reads with an Illumina NextSeq system. Sequencing metrics on all Bisulfite sequencing libraries are listed in Table S4 . Adaptors were trimmed using Cutadapt 107 and aligned to the TAIR10 reference genome with Bismark 112 . Duplicate reads were collapsed, and methylation levels at each cytosine were calculated as a ratio of #C / (#C + #T). DMRs were defined using DMRcaller 113 . A minimum difference of 30%, 20%, and 10% was used for DMRs in CG, CHG, and CHH contexts, respectively. Two independent biological replicates were performed for each genotype, showing high reproducibility (Pearson correlation > 0.9, Figure S6D , E ). Figures were generated in R ( https://www.r-project.org/ ) using ggplot2 110 and GViz 111 packages. Nuclear fractionation Soluble and insoluble chromatin fractions were obtained as previously described 114 . Briefly, 0.3 mL of seedling tissues were incubated in 0.6 mL N1 buffer (15 mM Tris-HCl, pH 7.5, 60 mM KCl, 15 mM NaCl, 5 mM MgCl 2 , 1 mM CaCl 2 , 1 mM DTT, and 250 mM sucrose, with Complete Mini EDTA-free protease inhibitor and PhosSTOP (Roche)) on ice for 30 mins. After filtering the extract with 30 μm CellTrics filters (Sysmex), nuclei were isolated by centrifugation at 4 °C and 1000g for 10 min. Nuclei were washed twice with N2 buffer (15 mM Tris-HCl, pH 7.5, 60 mM KCl, 15 mM NaCl, 5 mM MgCl 2 , 1 mM CaCl 2 , and 1 mM DTT, with Complete Mini EDTA-free protease inhibitor and PhosSTOP) and subsequently incubated with 600 μL of N3 buffer (15 mM Tris-HCl, pH 7.5, 150 mM NaCl, 5 mM MgCl 2 , 1 mM CaCl 2 , and 1 mM DTT, with Complete Mini EDTA-free protease inhibitor and PhosSTOP) for 30 min. The samples were centrifuged at 12,800g and 4 °C for 15 min to yield the soluble and insoluble pellet fractions. Soluble fractions were concentrated by vortexing with StrataClean resin (Agilent) for 1 min. Samples were boiled at 95 °C in SDS loading buffer and used for Western blot experiments. Anti-DDM1, anti-RFP (Rockland; 600-401-379) and anti-H3 (Abcam; ab1791) antibodies were used for detection of endogenous DDM1, DDM1-mCherry, and H3, respectively.
Microscopy
Immunofluorescence experiments for leaf nuclei were performed using 3-week-old leaves as previously described 115 . Monoclonal antibodies of anti-H3K27me1 (Active Motif; 61015) were used as primary antibodies and goat anti-mouse Alexa Fluor 488 (Thermo Fisher Scientific; A-10680) was used as secondary antibody. DAPI (2 μg/mL final concentration) was used for nuclei staining and the samples were mounted with Prolong Diamond (Thermo Fisher Scientific). DDM1-GFP, DDM1-mCherry, HTR3-GFP, and HTR5-RFP were observed with a Zeiss 710 confocal microscope. Live imaging data of DDM1-GFP was acquired using a Perkin-Elmer UltraVIEW VoX confocal microscope.
Expression and purification of DDM1 protein
His-TEV-DDM1 and His-TEV-DDM1(Δ1–132) were transformed into the E.coli strain BL21-CodonPlus (DE3)-RIPL (Agilent) for large-scale expression using standard methods. Briefly, cultures were grown in Terrific Broth media supplemented with appropriate antibiotic(s) at 37°C to a culture density of approximately OD λ=600 nm of 1.2. Cultures were then cooled in an ice water bath for 15 minutes followed by induction of protein expression with 0.5 mM IPTG. Induction proceeded overnight at 16 °C with shaking at 220 rpm. Cells were harvested by centrifugation at 4000g for 30 minutes at 4 °C. The supernatant was discarded and the pelleted cells were taken for protein purification. For Ni-NTA purification, cell pellets were resuspended in 20 mL lysis buffer (20 mM Tris, pH 8.0, 300 mM NaCl, 5 mM MgCl 2 , 10% glycerol, 1 mM TCEP, 20 mM imidazole) per liter culture. Protease inhibitors and 0.1% Triton-X were next added to the resuspension and the cells lysed by sonication. Turbo nuclease (Accelagen) was added to the cell lysate (2.5 units per mL of cell resuspension) and the lysate was then clarified by ultracentrifugation at roughly 100,000g for 30 minutes. The soluble supernatant was taken for affinity purification via batch binding with Ni-NTA resin (2 mL of beads per liter culture), pre-equilibrated with lysis buffer. Batch binding was performed for 2–3 hours at 4 °C with gentle agitation. The Ni-NTA beads were then collected by centrifugation at 1000g for 5 minutes, resuspended in lysis buffer, then transferred to a column for further washing and elution. Beads were washed with 20 column volumes of lysis buffer followed by elution of the target protein in lysis buffer supplemented with 100–250 mM imidazole. To remove the affinity tag, TEV protease was added in a 1:20 mass ratio (protease:DDM1) and incubated overnight at 4 °C. In addition, DTT was added to a final concentration of 10 mM to limit aggregation. Protein was further purified using a HiTrap Heparin HP column (Cytiva/GE Healthcare Life Sciences). Digested protein was first diluted two-fold with low salt buffer (20 mM Tris, pH 8.0, 1 mM DTT) prior to loading the heparin column. The target protein was then eluted using a 25–75% gradient of high salt buffer (20 mM Tris, pH 8.0, 1 mM DTT, 1 M NaCl) over approximately 50 mL. Peak fractions were assessed by SDS-PAGE then selected and pooled for further purification. Pooled fractions were concentrated to 500 μL and applied to a Superdex 200 increase 10/300 column (Cytiva/GE Healthcare Life Sciences). The protein was chromatographed over ~30 mL at a flow rate of 0.6 mL/min in a running buffer of 20 mM Tris, pH 8.0, 300 mM NaCl, 5 mM MgCl 2 , 1 mM TCEP. Peak fractions were assessed by SDS-PAGE. Fractions with highly-purified protein were concentrated, then taken for enzymatic assays and/or storage. For long-term storage the protein was flash frozen in liquid nitrogen, then kept at −80 °C. Typical yields were 1–2 mg of highly purified protein (>98% pure as assessed by SDS-PAGE) per liter culture. DDM1 ATPase, remodeling, gel shift, and peptide-binding assays DDM1 ATPase assays were performed in reaction buffer (10 mM Tris pH 7.5, 50 mM NaCl, 10 mM MgCl 2 , 20% Glycerol) containing various ATP concentrations and quantified using the ADP-Glo MAX Assay (Promega; Catalog No. V7001) as described previously 116 . The double-stranded DNA substrate was prepared by PCR amplification of the Widom 601 DNA sequence described in the remodeling assays below (see Table S3 for primer sequence information). Methylated DNA was amplified by PCR in the presence of 5m-dCTP rather than dCTP (New England Biolabs). Additional experimental procedures followed the manufacturer’s guidelines. Luminescence was quantified using GloMax-Multi+ Detection System (Promega). DDM1 nucleosome remodeling assays were performed with mononucleosomes. Histone octamers consisting of Arabidopsis H2A.W (AT5G59870), H3.3 (At5g10980), H3.1 (At1g09200), H2A (AT3G20670) and H2B (AT3G45980), and Xenopus H4 were assembled as described previously 117 . Briefly, core histones were expressed in E. coli , solubilized from inclusion bodies, and purified by sequential anion and cation exchange chromatography before refolding into histone octamers and purifying by size exclusion chromatography. Nucleosomes were assembled by gradient dialysis against TE buffer at 4 °C overnight with 147 bp core Widom 601 DNA, with or without a 60 bp-overhang (underlined), as indicated 5’-CTGGAGAATCCCGGTGCCGAGGCCGCTCAATTGGTCGTAGACAGCTCTAGCACCG CTTAAACGCACGTACGCGCTGTCCCCCGCGTTTTAACCGCCAAGGGGATTACTCC CTAGTCTCCAGGCACGTGTCAGATATATACATCCTGT GCATGTATTGAACAGCGAC CTTGCCGGTGCCAGTCGGATAGTGTTCCGAGCTCCCACTCT -3’ 63 . For remodeling assays, the reaction buffer contained 20 mM Tris-HCl, pH 8.0, 75 mM NaCl, 2 mM MgCl 2 , and 1 mM ATP. After adding DDM1 to Widom 601 + 60 bp nucleosome samples in a 2:1 ratio, the reactions were incubated at 25 °C and stopped by addition of 5 mM EDTA and excess plasmid DNA. Reaction samples were resolved by 6% native PAGE (37.5:1 acrylamide:bis-acrylamide) run in 0.5× TBE buffer and stained with SYBR Gold (Thermo Fisher Scientific). For gel shift assays, nucleosomes were assembled with 147 bp core Widom 601 DNA. In brief, DDM1 was mixed with nucleosomes in the binding buffer (20 mM Tris-HCl, pH 8.0, 75 mM NaCl, 2 mM MgCl 2 ) and incubated for 30 min. The DDM1-nucleosome complex samples were resolved by 6% native PAGE in 0.5 × TBE (29:1 acrylamide:bis-acrylamide). Peptide binding assays of purified His-TEV-DDM1 or His-TEV-DDM1[132-end] were measured using a Monolith NT.115 Pico running MO Control version 1.6 (NanoTemper Technologies). Assays were performed in PBS-T (137 mM NaCl, 2.7 mM KCl, 10 mM Na2HPO4, 1.8m mM KH2PO4, 0.1% Tween-20) for DDM1 and PBS-T supplemented with 1mM ADP for DDM1[132-end]. His-label RED-tris-NTA (NanoTemper Technologies) labeled DDM1 or DDM1[132-end] (5 nM) was mixed with 16 serial dilutions of histone H4 peptides starting at 1 mM and loaded into microscale thermophoresis premium coated capillaries (NanoTemper Technologies). MST measurements were recorded at 23°C using 20% excitation power and 60% MST power. Measurements were performed in triplicate (except 132-end). Determination of the binding constant was performed using MO Affinity Analysis v.2.3.
Cryo-electron microscopy sample preparation Purified
DDM1 and reconstituted nucleosomes (H2A.W, H2B, H3.3, H4, and 147 bp DNA) were each desalted into binding buffer (10 mM HEPES, pH 7.5, 50 mM NaCl). DDM1 at 1.3 mg/mL and nucleosomes at ~0.16 mg/mL were then mixed in a 4:1 molar ratio and incubated at room temperature for 10 minutes. DDM1-nucleosome complexes were cross-linked with 0.05% glutaraldehyde for 15 minutes then quenched by the addition of 2 mM Tris, pH 8.0. After five minutes at room temperature, the slowly-hydrolyzable ATP analog ATP-γ-S and MgCl 2 were added to final concentrations of 1 mM and 2 mM, respectively. The reaction was incubated at 4°C overnight. For cryo-EM grid preparation, 4 μL samples at approximately 0.35 mg/mL were applied to glow-discharged Quantifoil 0.6/1 300 μm mesh copper grids. After a 10 s incubation at 25 °C and 95% humidity, samples were blotted for 2.5 s then plunged into liquid ethane using an Automatic Plunge Freezer EM GP2 (Leica).
Cryo-electron microscopy data acquisition
Data were acquired on a Titan Krios transmission electron microscope (ThermoFisher) operating at 300 keV. EPU data collection software version 2.10.0.5 (ThermoFisher) was used to collect micrographs at a nominal magnification of 81,000x (1.1 Å/pixel) and defocus range of −1.0 to −2.2 μm. Dose-fractionated movies were collected using a K3 direct electron detector (Gatan) operating in electron counting mode. In total, 30 frames were collected over a 4.8 s exposure. The exposure rate was 14.8 e − /Å 2 /s, which resulted in a cumulative exposure of approximately 71.2 e − /Å 2 . In total, 8,165 micrographs were collected.
Cryo-electron microscopy data processing
Real-time image processing (motion correction, CTF estimation, and particle picking) was performed concurrently with data collection using WARP version 1.0.9 96 . Automated particle picking was performed with the BoxNet pretrained deep convolutional neural network bundle included with WARP that is implemented in TensorFlow. A particle diameter of 180 Å and a threshold score of 0.6 yielded 3,788,872 particle coordinates. Of the particles collected during cryo-EM acquisition, nearly three-quarters were free nucleosomes. Classification and refinement were carried out in cryoSPARC v3.2.0+210831 97 . Initial 2D classification showed distinct classes of nucleosomes both bound to and independent of DDM1. To isolate the DDM1-bound nucleosome particles, 2D classes were first manually inspected. Classes that clearly showed the presence of DDM1 - typically top views - were preferentially selected (497,127 particles) for ab initio reconstruction of four, 3D classes using a 200,000 particle subset. The resulting models (one of which showing DDM1-bound nucleosome), were then used for 3D heterogenous refinement with the full particle set. The resulting DDM1-bound nucleosome class was then taken for iterative rounds of homogenous refinement, non-uniform refinement, and further filtering using the refined reconstruction together with DDM1-free nucleosome decoy classes. The final non-uniform refined reconstruction was generated from 215,066 particles and had a resolution of 3.2 Å according to the gold standard FSC.
Molecular model building and refinement
An atomic model of the SWI/SNF nucleosome complex (PDB: 6UXW) 118 and the AlphaFold prediction of DDM1 119 were used as initial references for model building in Coot version 0.9.2-pre 120 . After the initial build was generated, density modification was performed using Resolve 121 . Subsequent rounds of interactive model building and refinement were performed with Coot and Phenix version 1.19.2-4158-000 122 , respectively. Secondary structure restraints for both the protein (α-helix and β-strand) and DNA (base-stacking and base-pairing) were used throughout refinement. Structure validation was conducted by MolProbity version 4.5.1 123 . Data collection, processing, and model validation statistics are provided in Tables S5 and S6 . Molecular graphics Figures of molecular models were generated using ChimeraX version 1.2.5 124 . Electrostatic surface calculations were performed by APBS 100 with a solvent ion concentration of 0.15 M at 298 K using the PARSE force field. Superpositioning of structural homologs was performed by the DALI server 125 . Conservation analysis was performed using the Consurf server 98 .
Supplementary Material 1 Supplementary Figure S1. MET1 participates in histone remodeling by DDM1, related to Figure 1 . (A) ChIP-qPCR amplification of TSI ( ATHILA ) and ATHILA6A repeats in wild-type (WT), ddm1 , and met1 with 10-d-old seedling tissues. ChIP signals of H3.1(HTR3)-GFP and H3.3(HTR5)-RFP were normalized to H3. Error bars indicate standard deviations (biological replicates; n=3). P values of statistical difference with WT are shown above each mutant (one-way Anova adjusted with Tukey’s Honest Significant Difference method; * p-value
📊 Figures
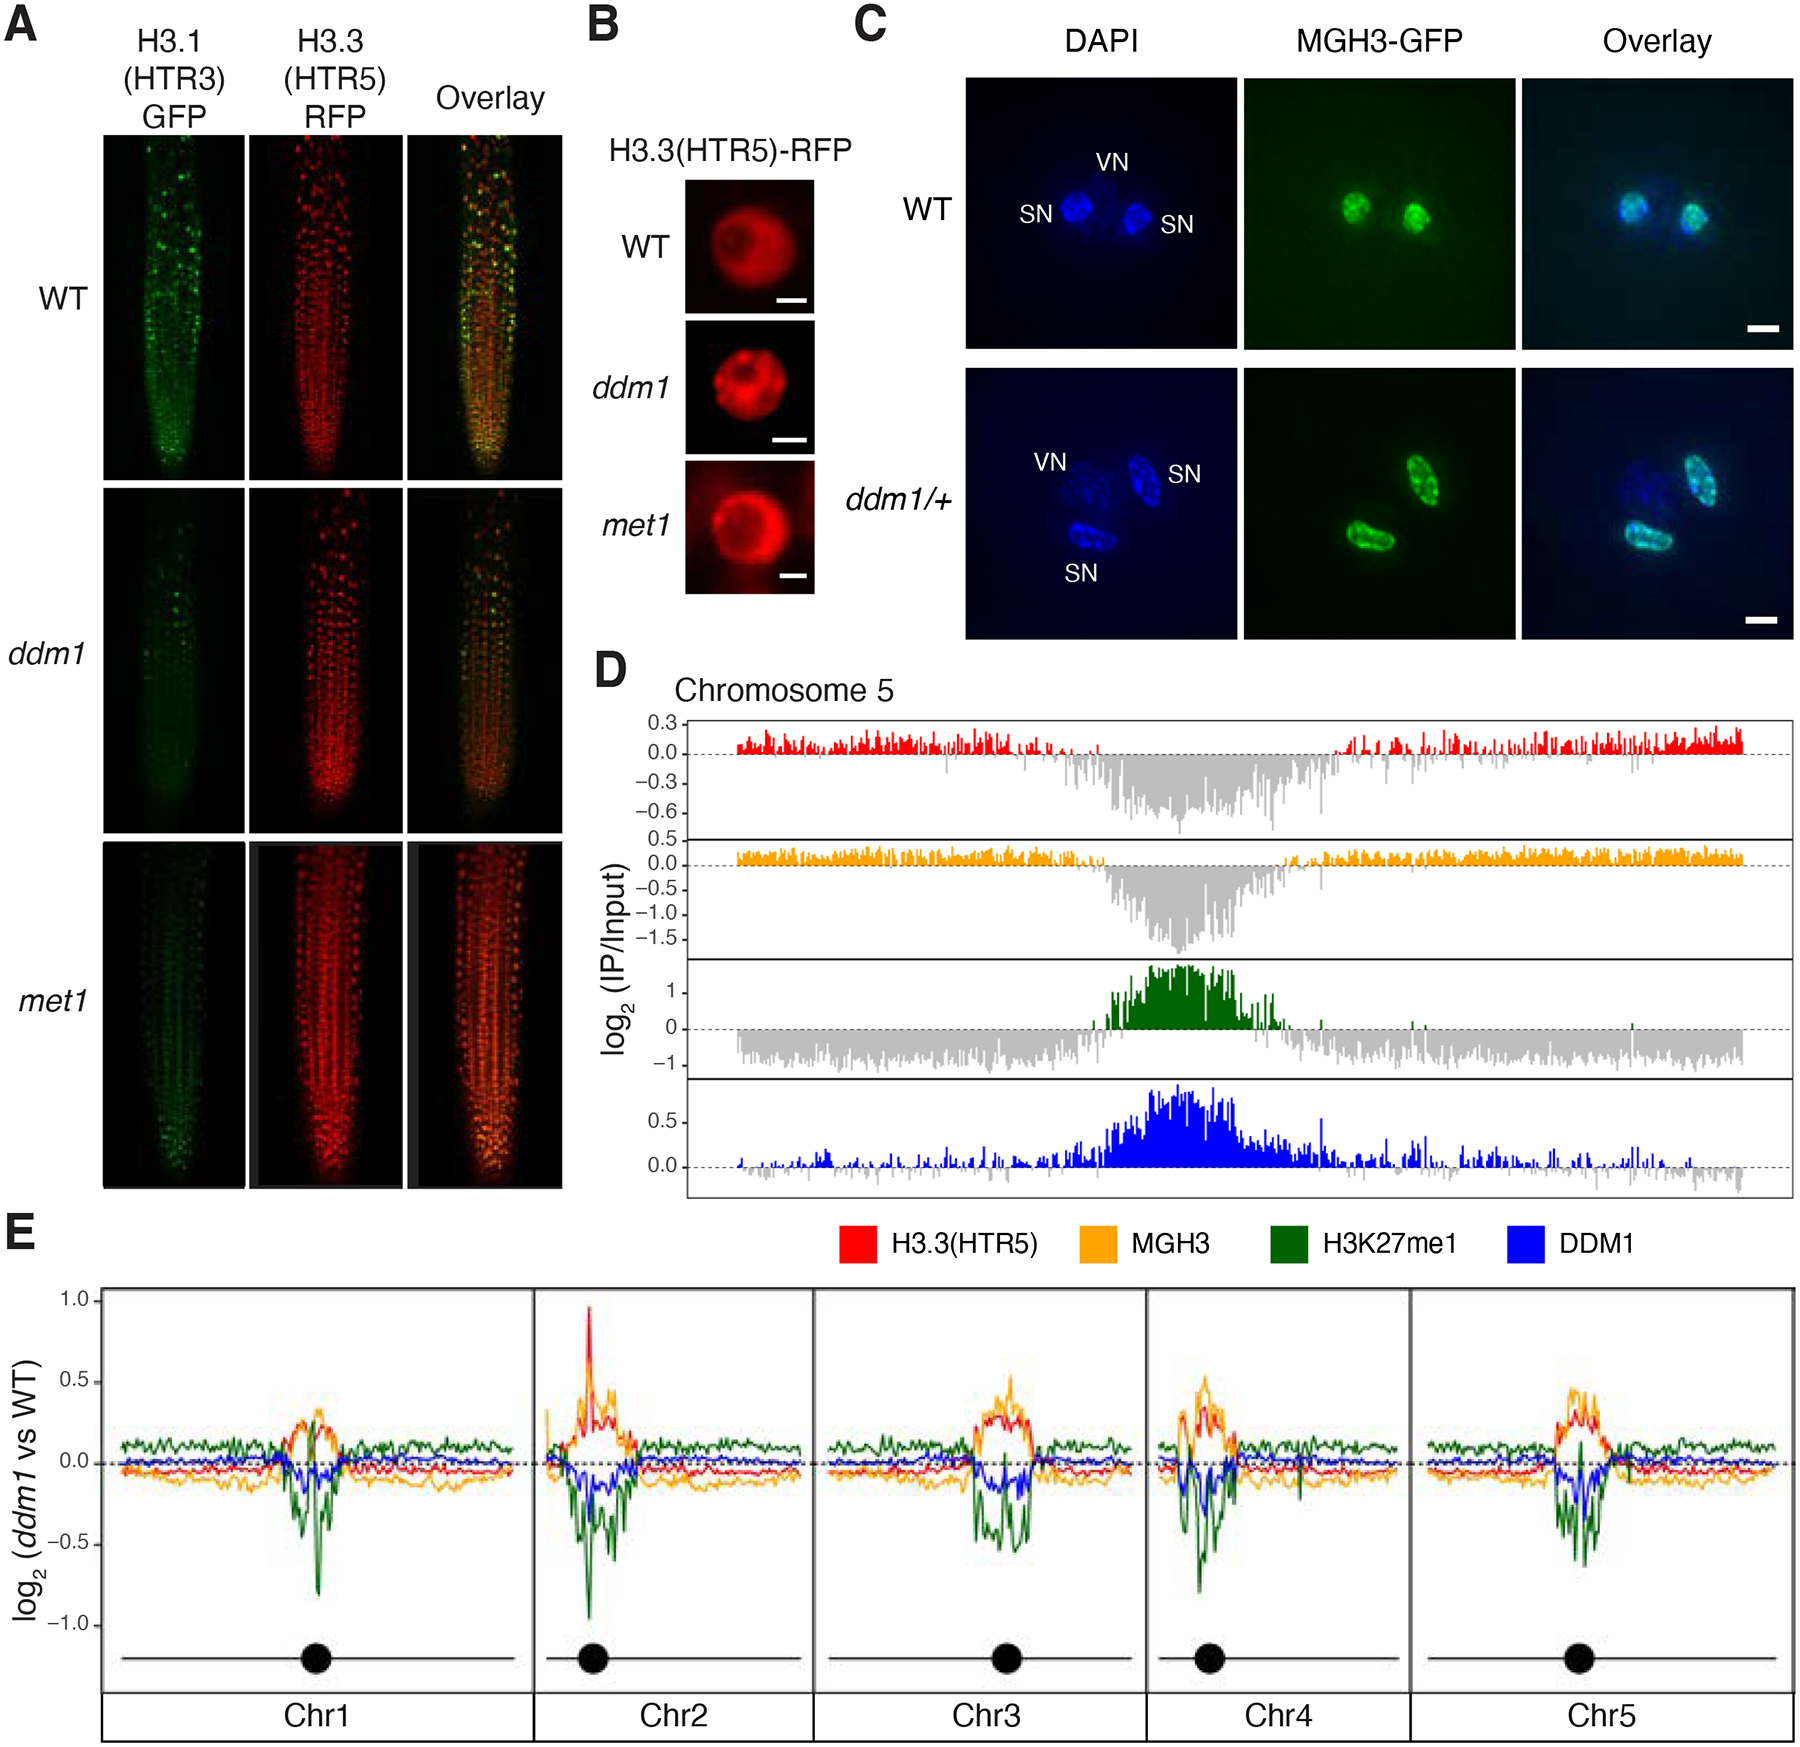
Figure 1.
Replacement of histone H3.1 by H3.3 in ddm1 mutants.
(A) H3.1(HTR3)-GFP and H3.3(HTR5)-RFP localization in Arabidopsis root tips of wild-type (WT), ddm1 , and met1 . (B) Ectopic chromocenter localization of H3.3(HTR5)-RFP in ddm1 as compared to WT and m...
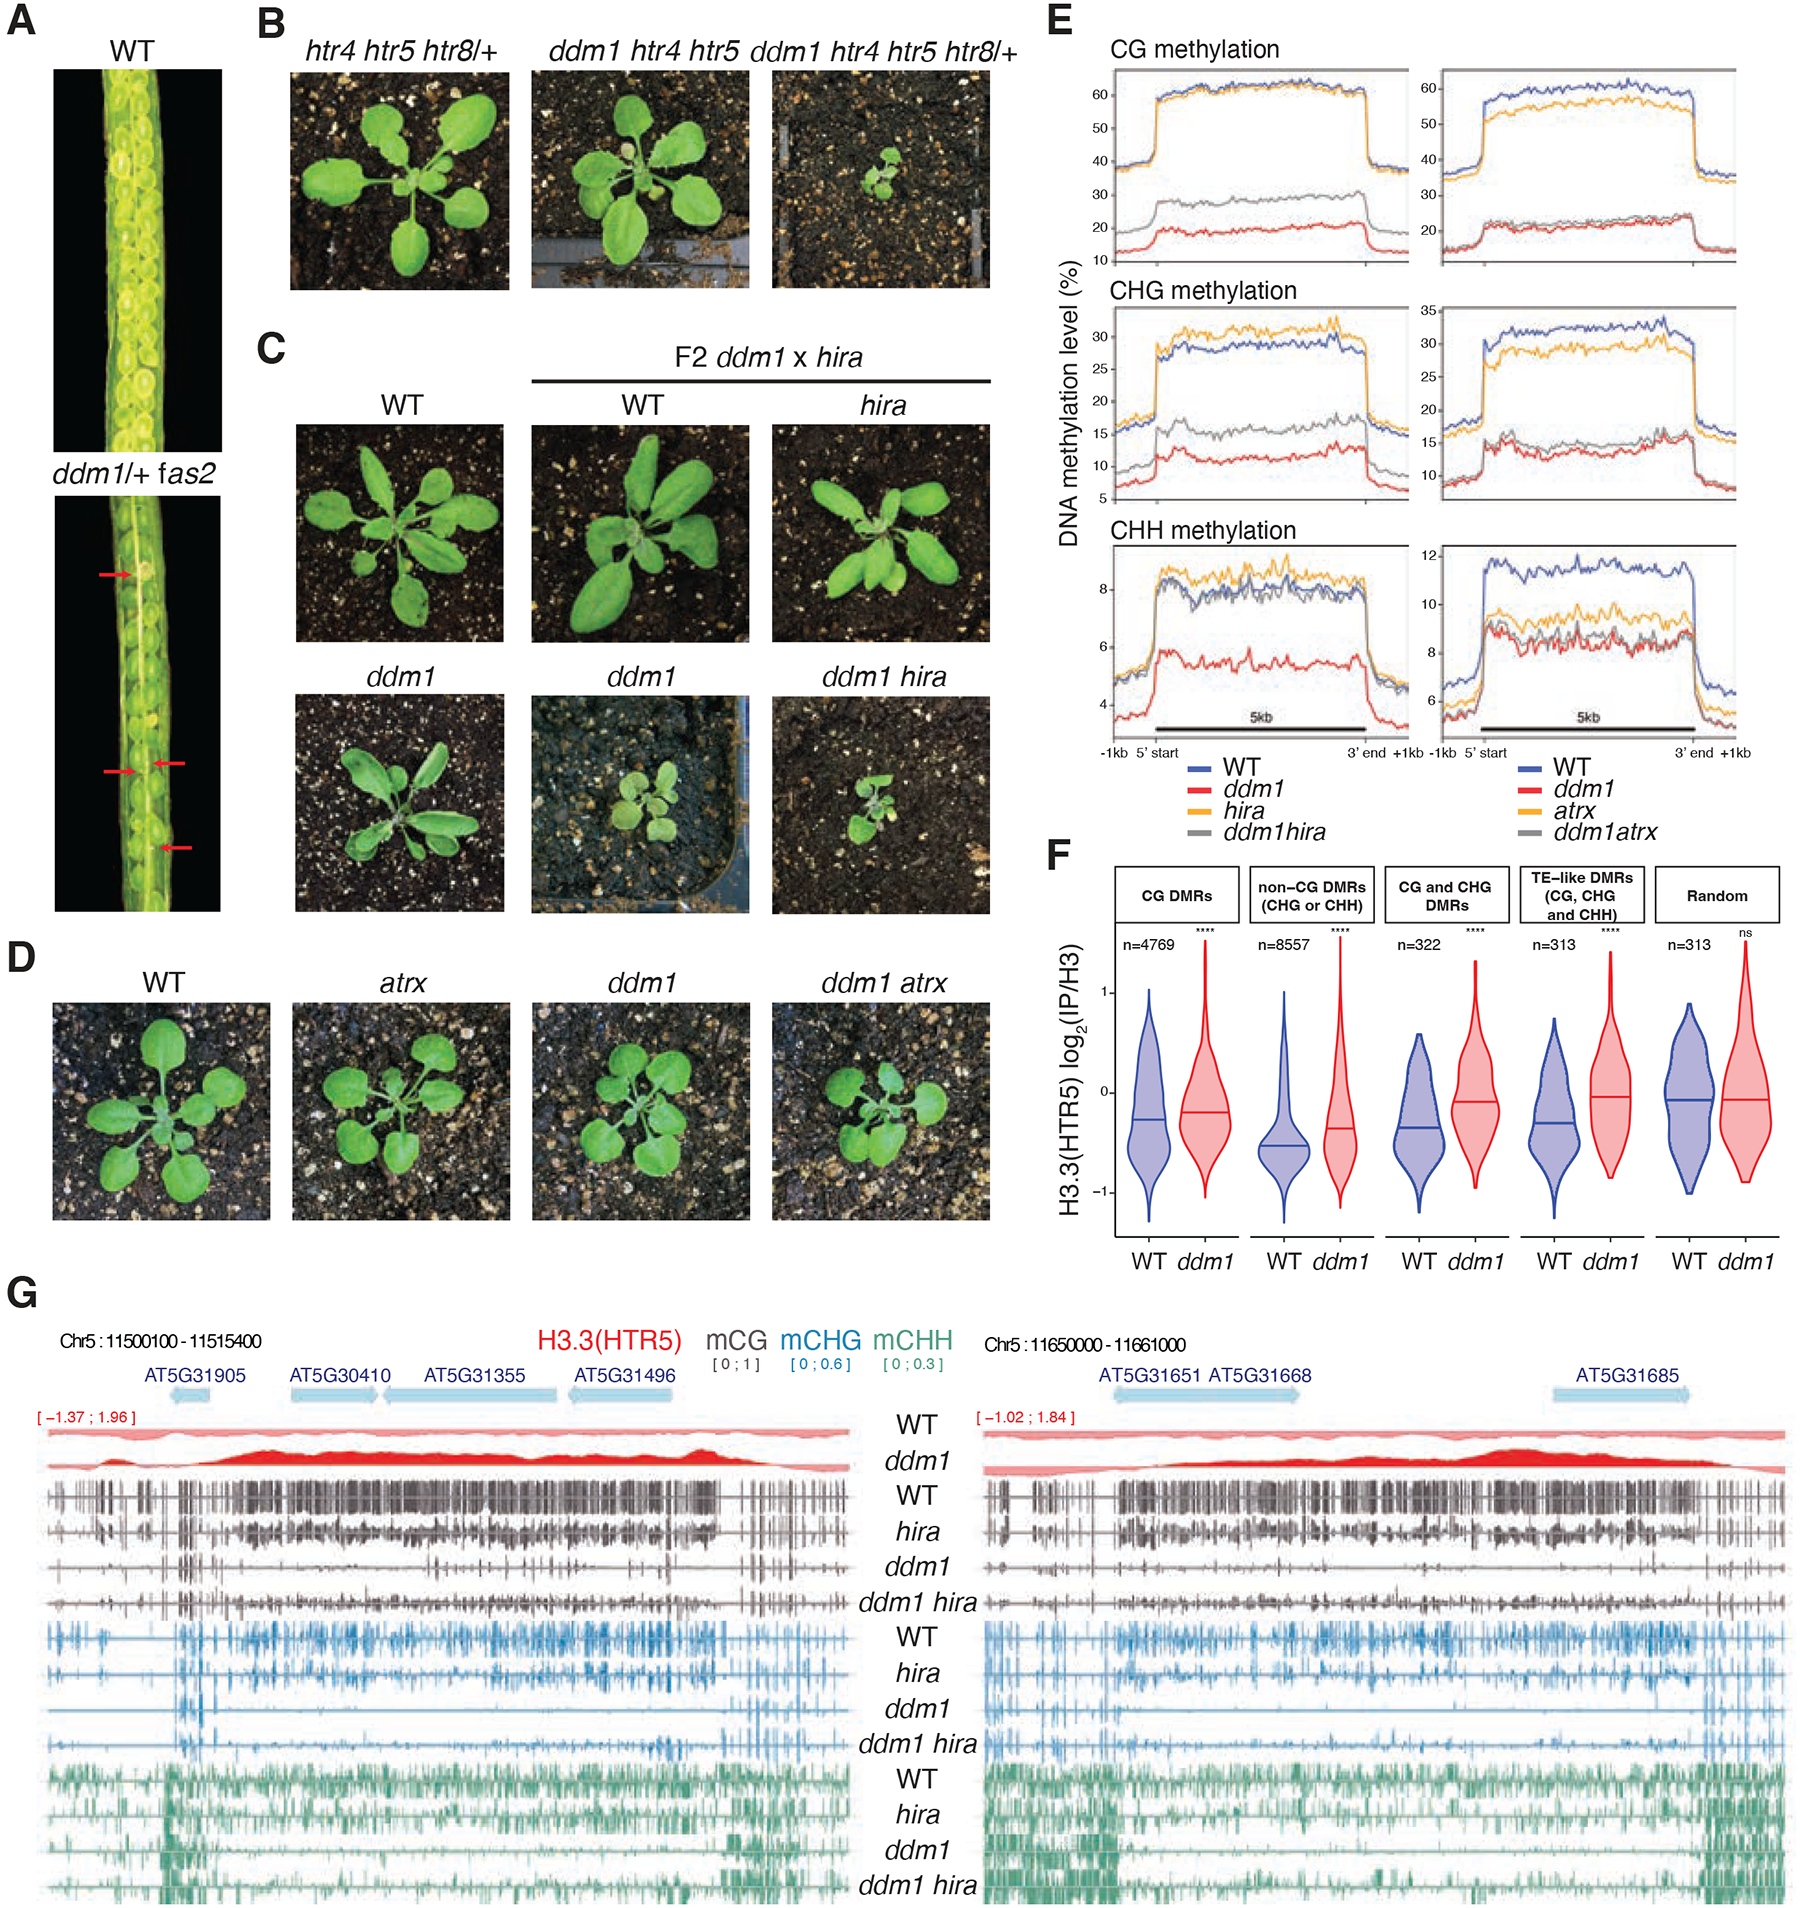
Figure 2.
Genetic interactions between ddm1 and histone H3 variants and chaperones impact DNA methylation.
fas2 and hira are mutants in H3.1 (CAF-1), and H3.3 (HIRA) chaperones, respectively. ATRX is a chromatin remodeler required for H3.3 deposition. (A) Siliques of wild-type (WT) and ddm1 /+ fas2 plants....
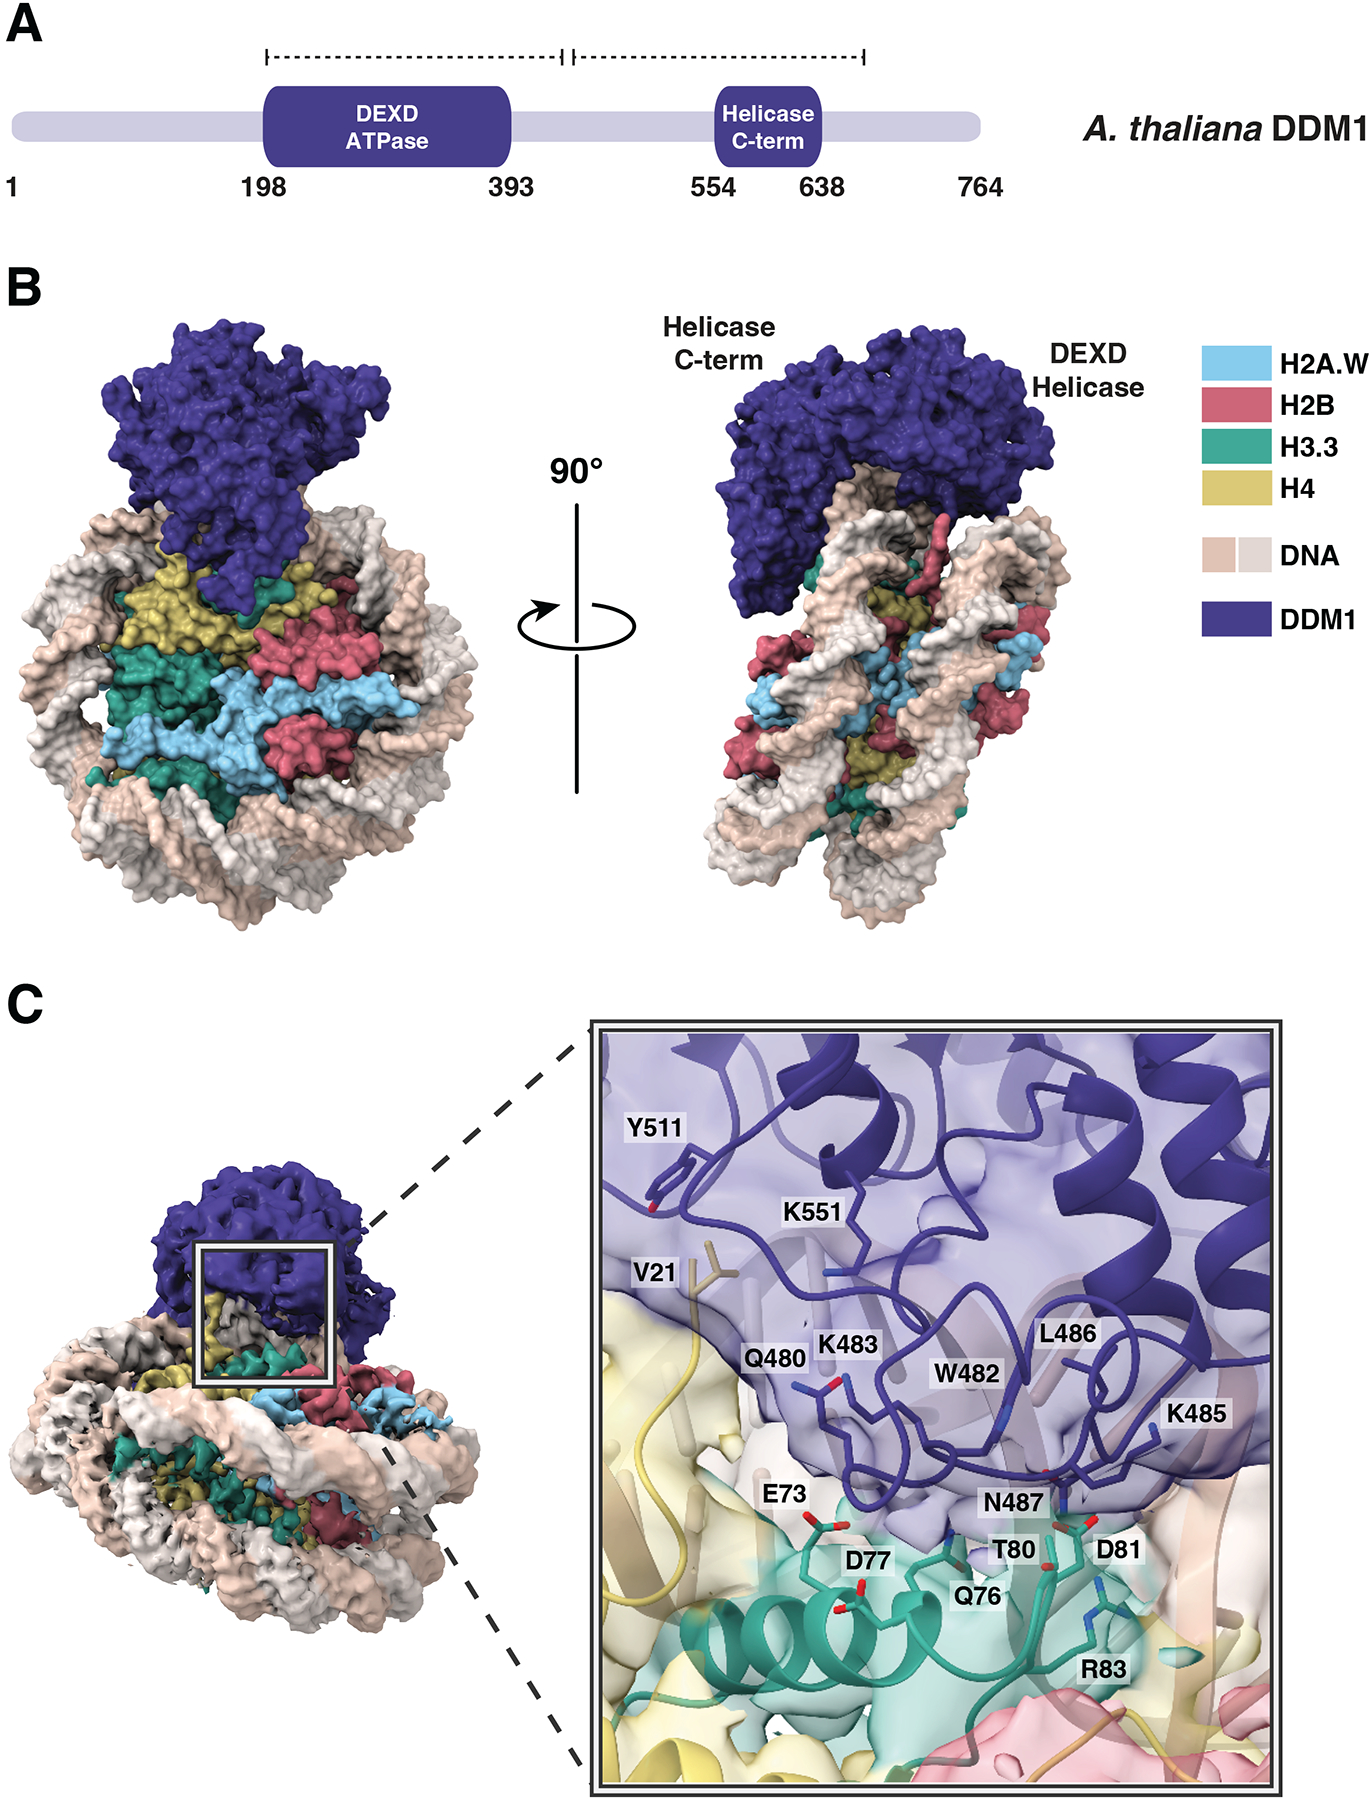
Figure 3.
Structural basis of DDM1-nucleosome interactions.
(A) Protein domain schematic of DDM1. Residue numbers indicate the boundaries of DDM1 and its domains: the N-terminal DEXD ATPase domain and helicase superfamily C-terminal domain (HELICc). Dashed lin...
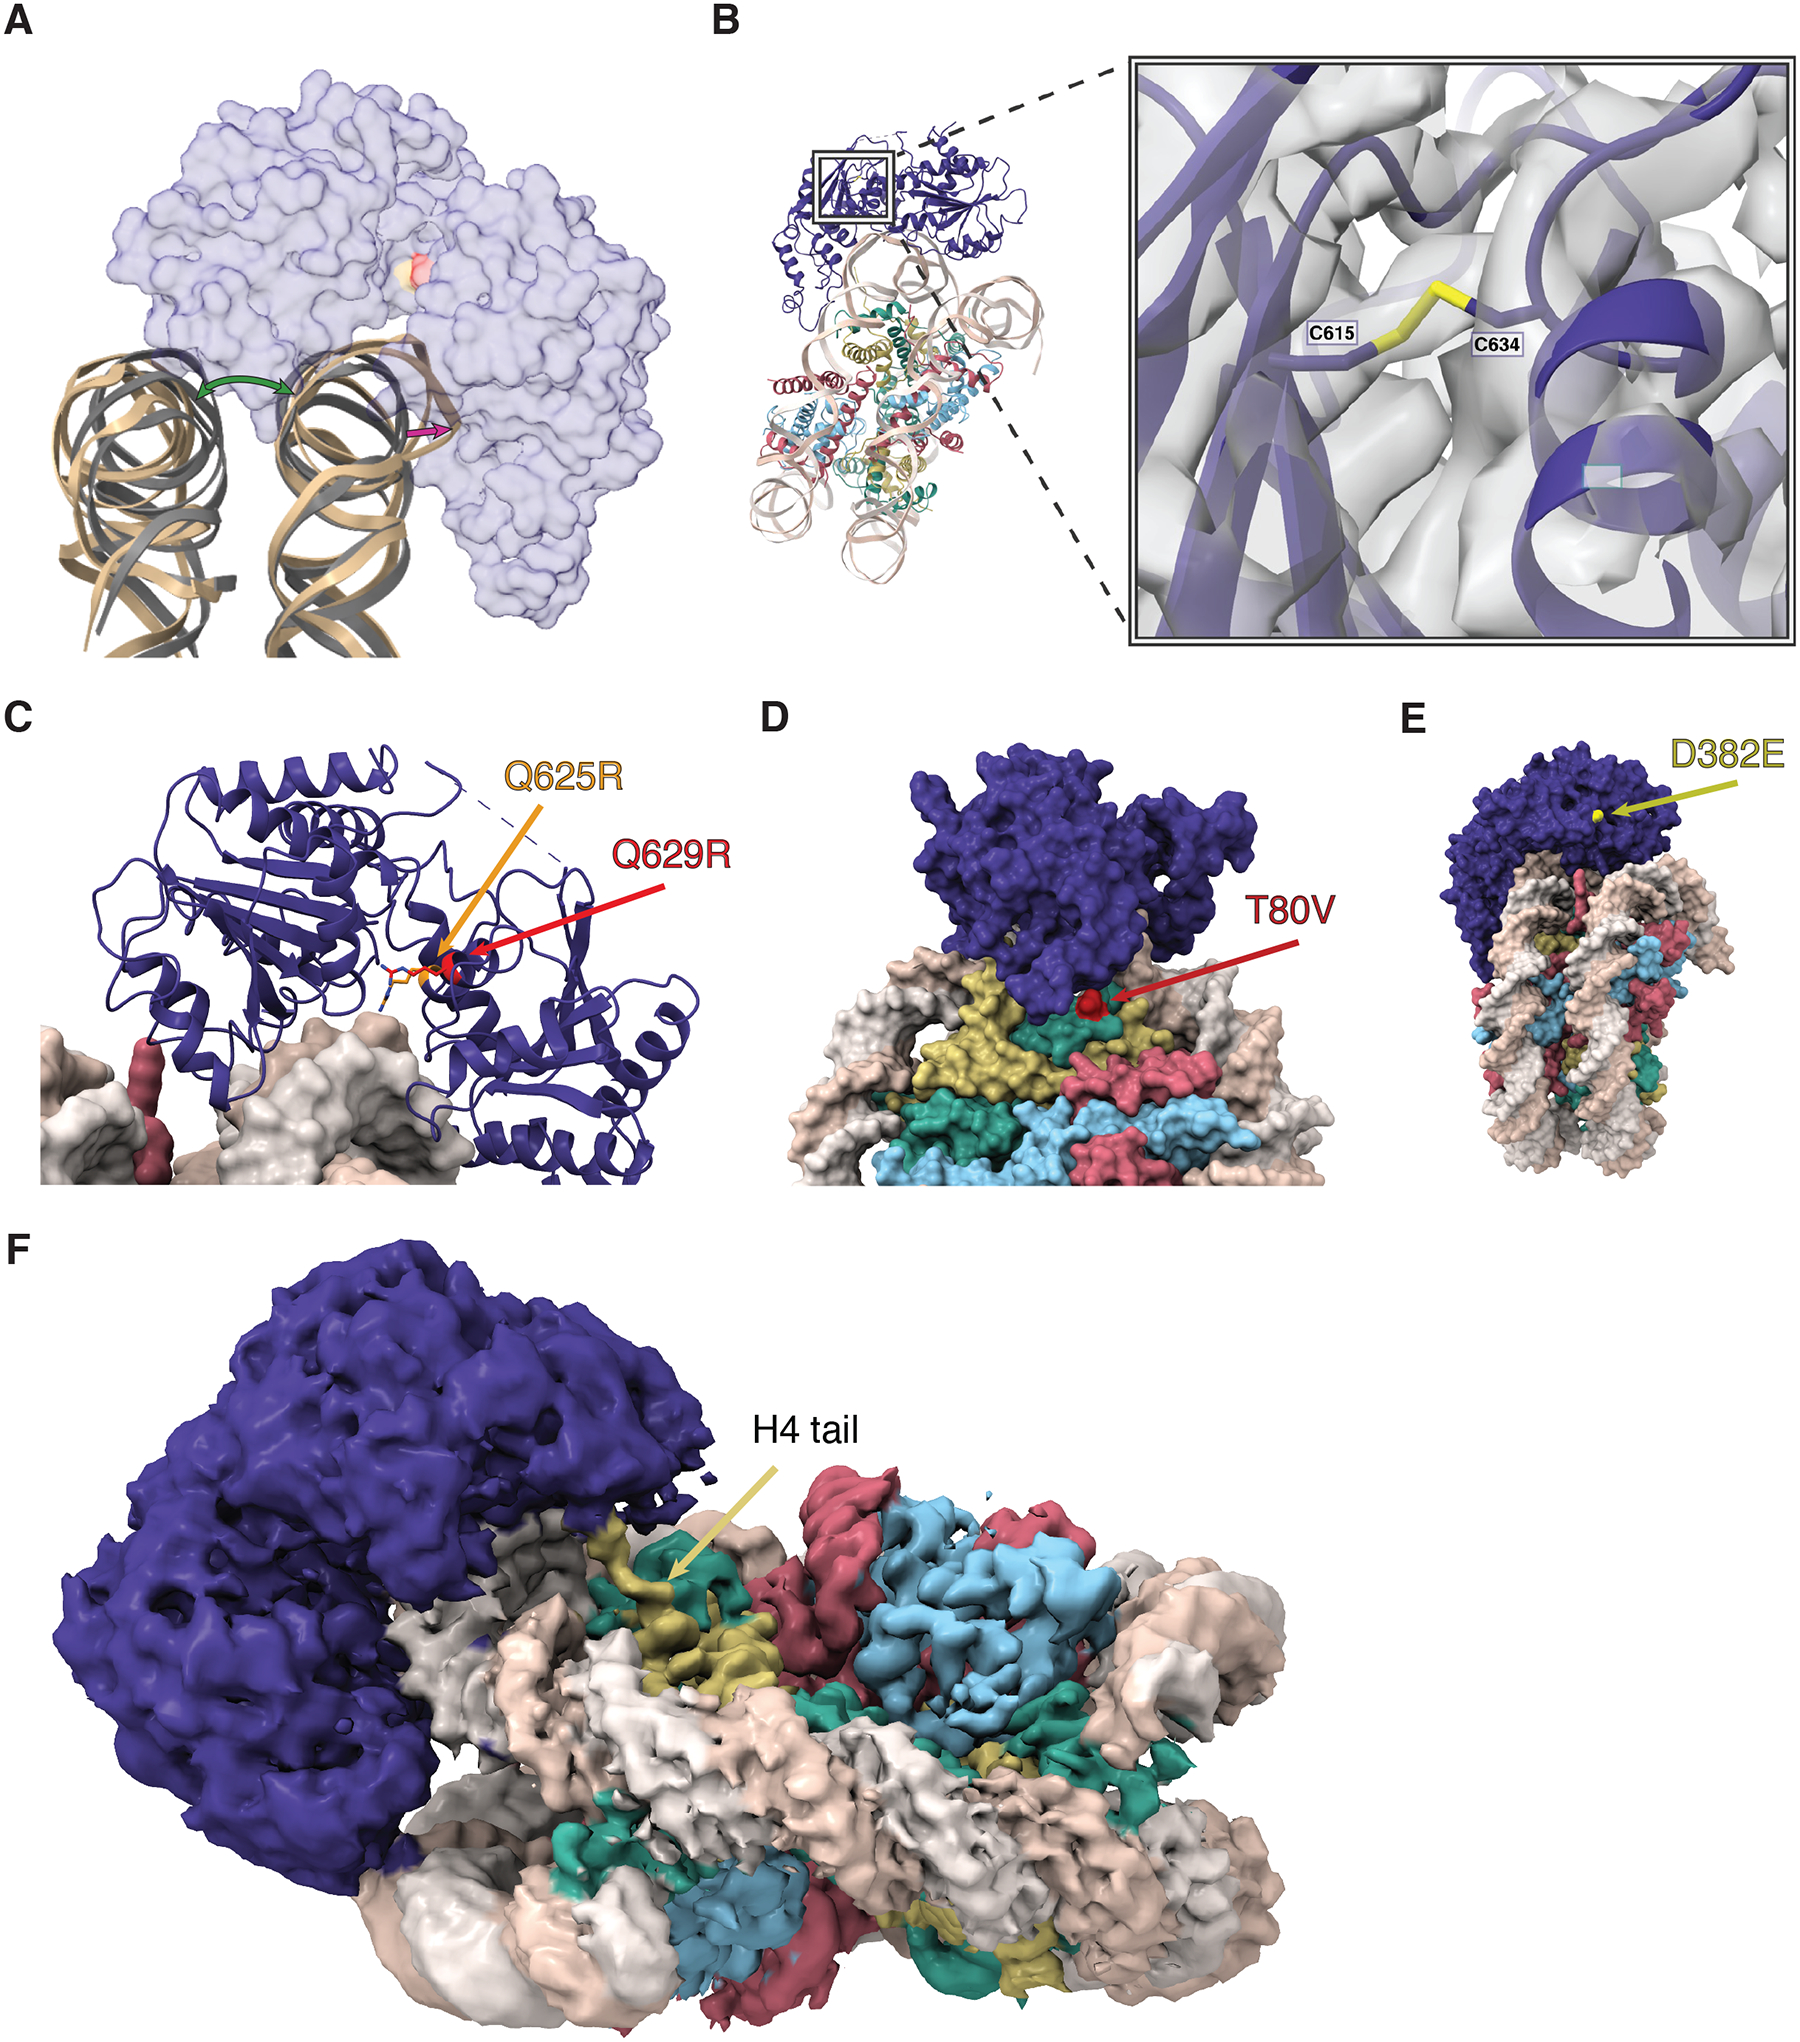
Figure 4.
Structure and function of the Helicase C terminal and ATPase lobes.
(A) A cartoon view of the DNA distortion caused by DDM1 binding. The DNA backbone of the DDM1-nucleosome model (tan) was aligned to a naked nucleosome DNA backbone (grey, PDB code 1KX5), showing the d...
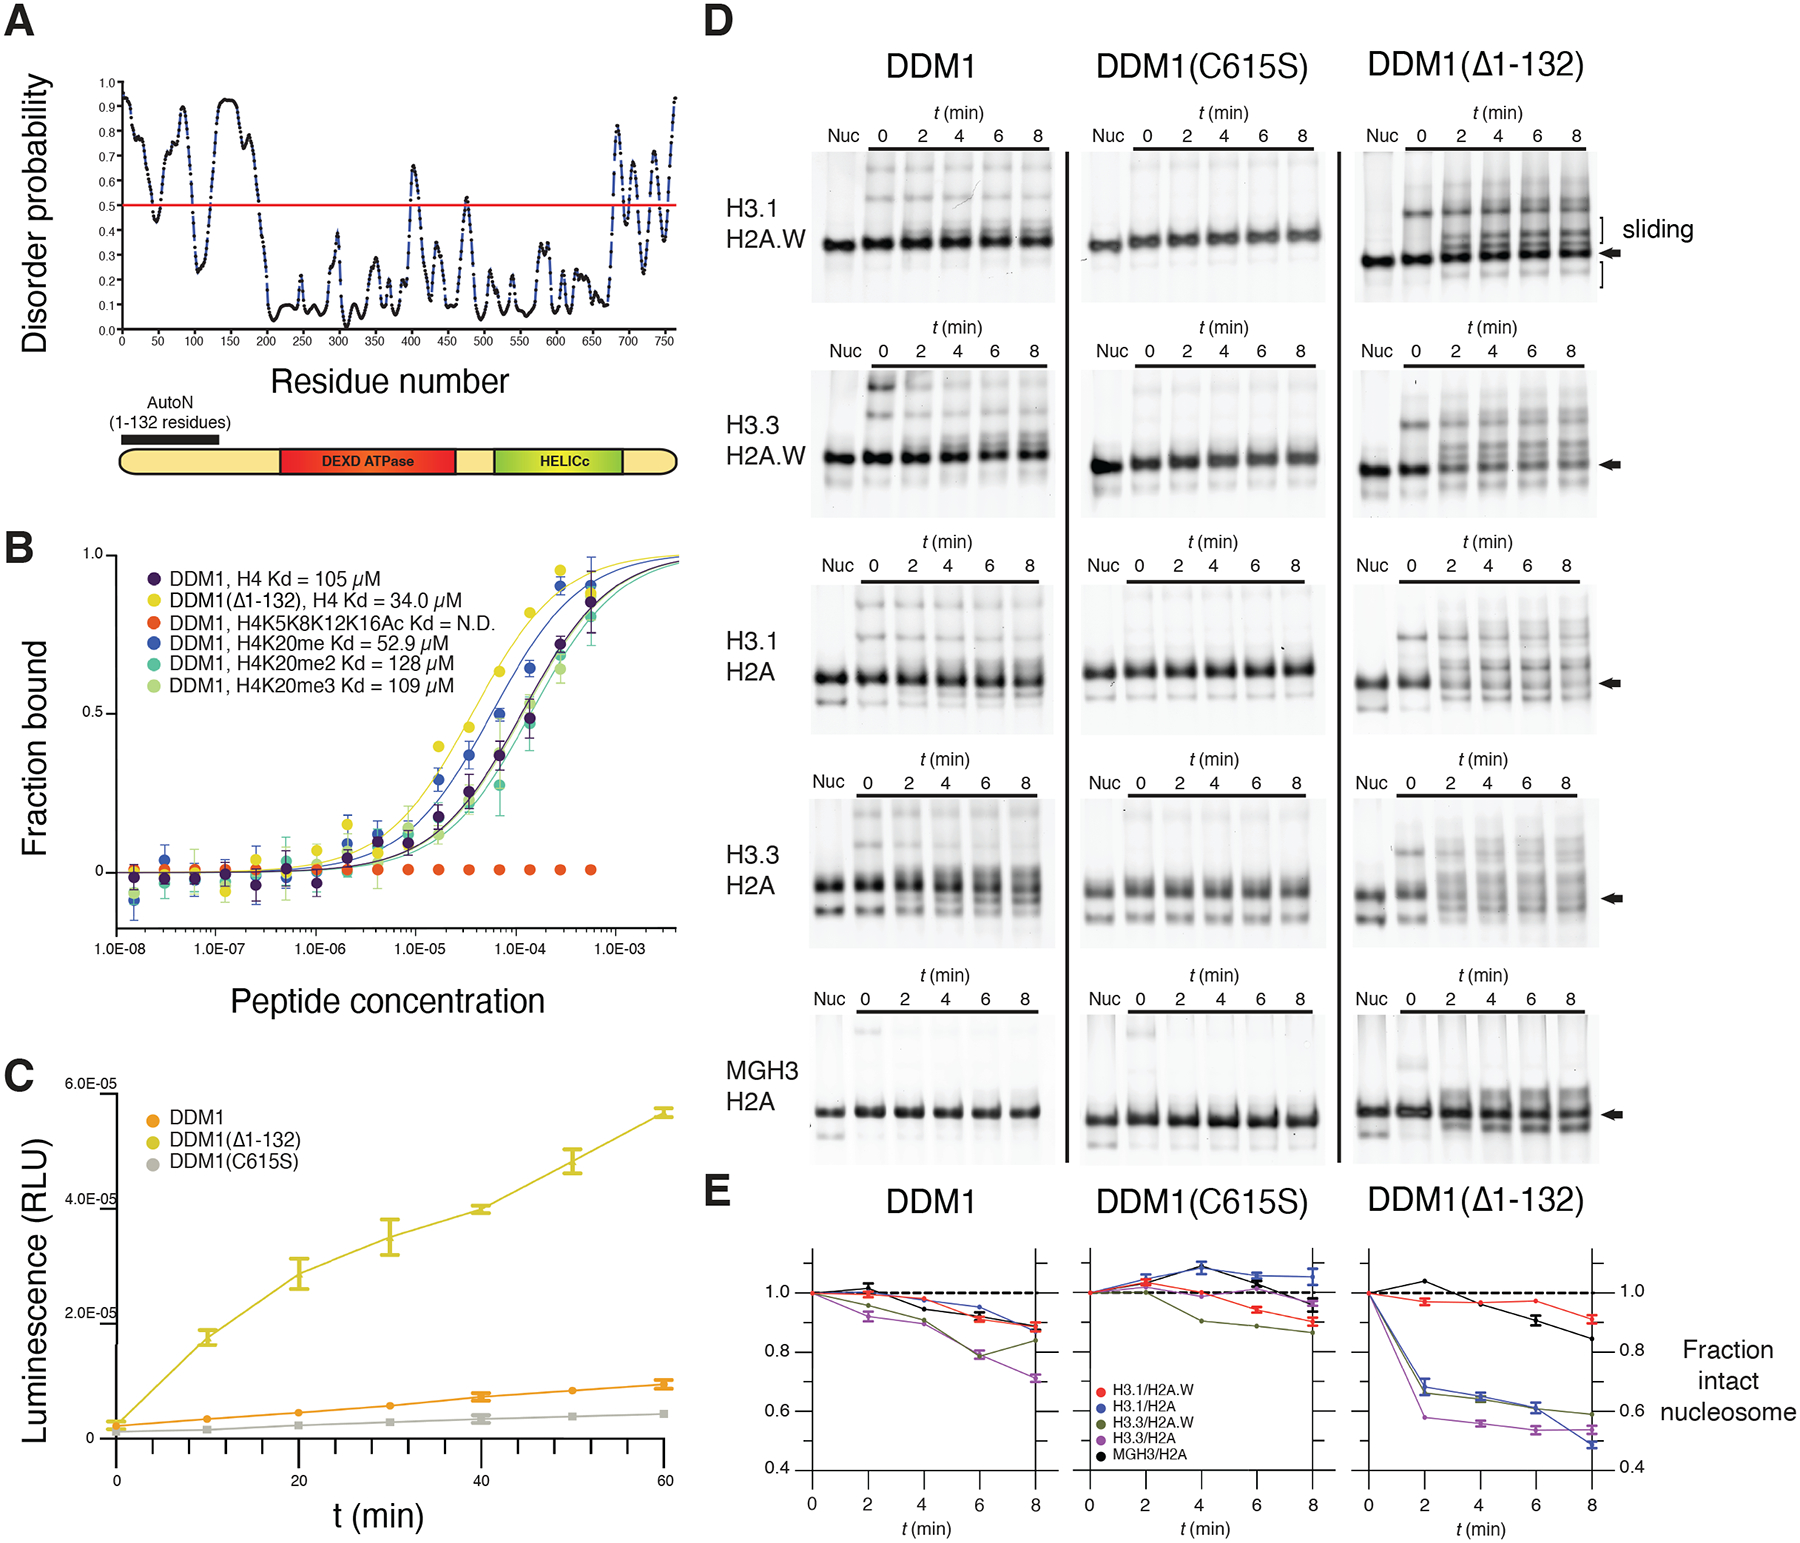
Figure 5.
An N-terminal autoinhibitory domain regulates H4 peptide-binding, ATPase and nucleosome remodeling activities of DDM1 with histone variants.
(A) Disorder predictions for DDM1 were calculated with PrDOS95. The red line indicates the threshold corresponding to a false positive rate of 5%. The autoinhibitory domain (1u2013132 residues) AutoN ...
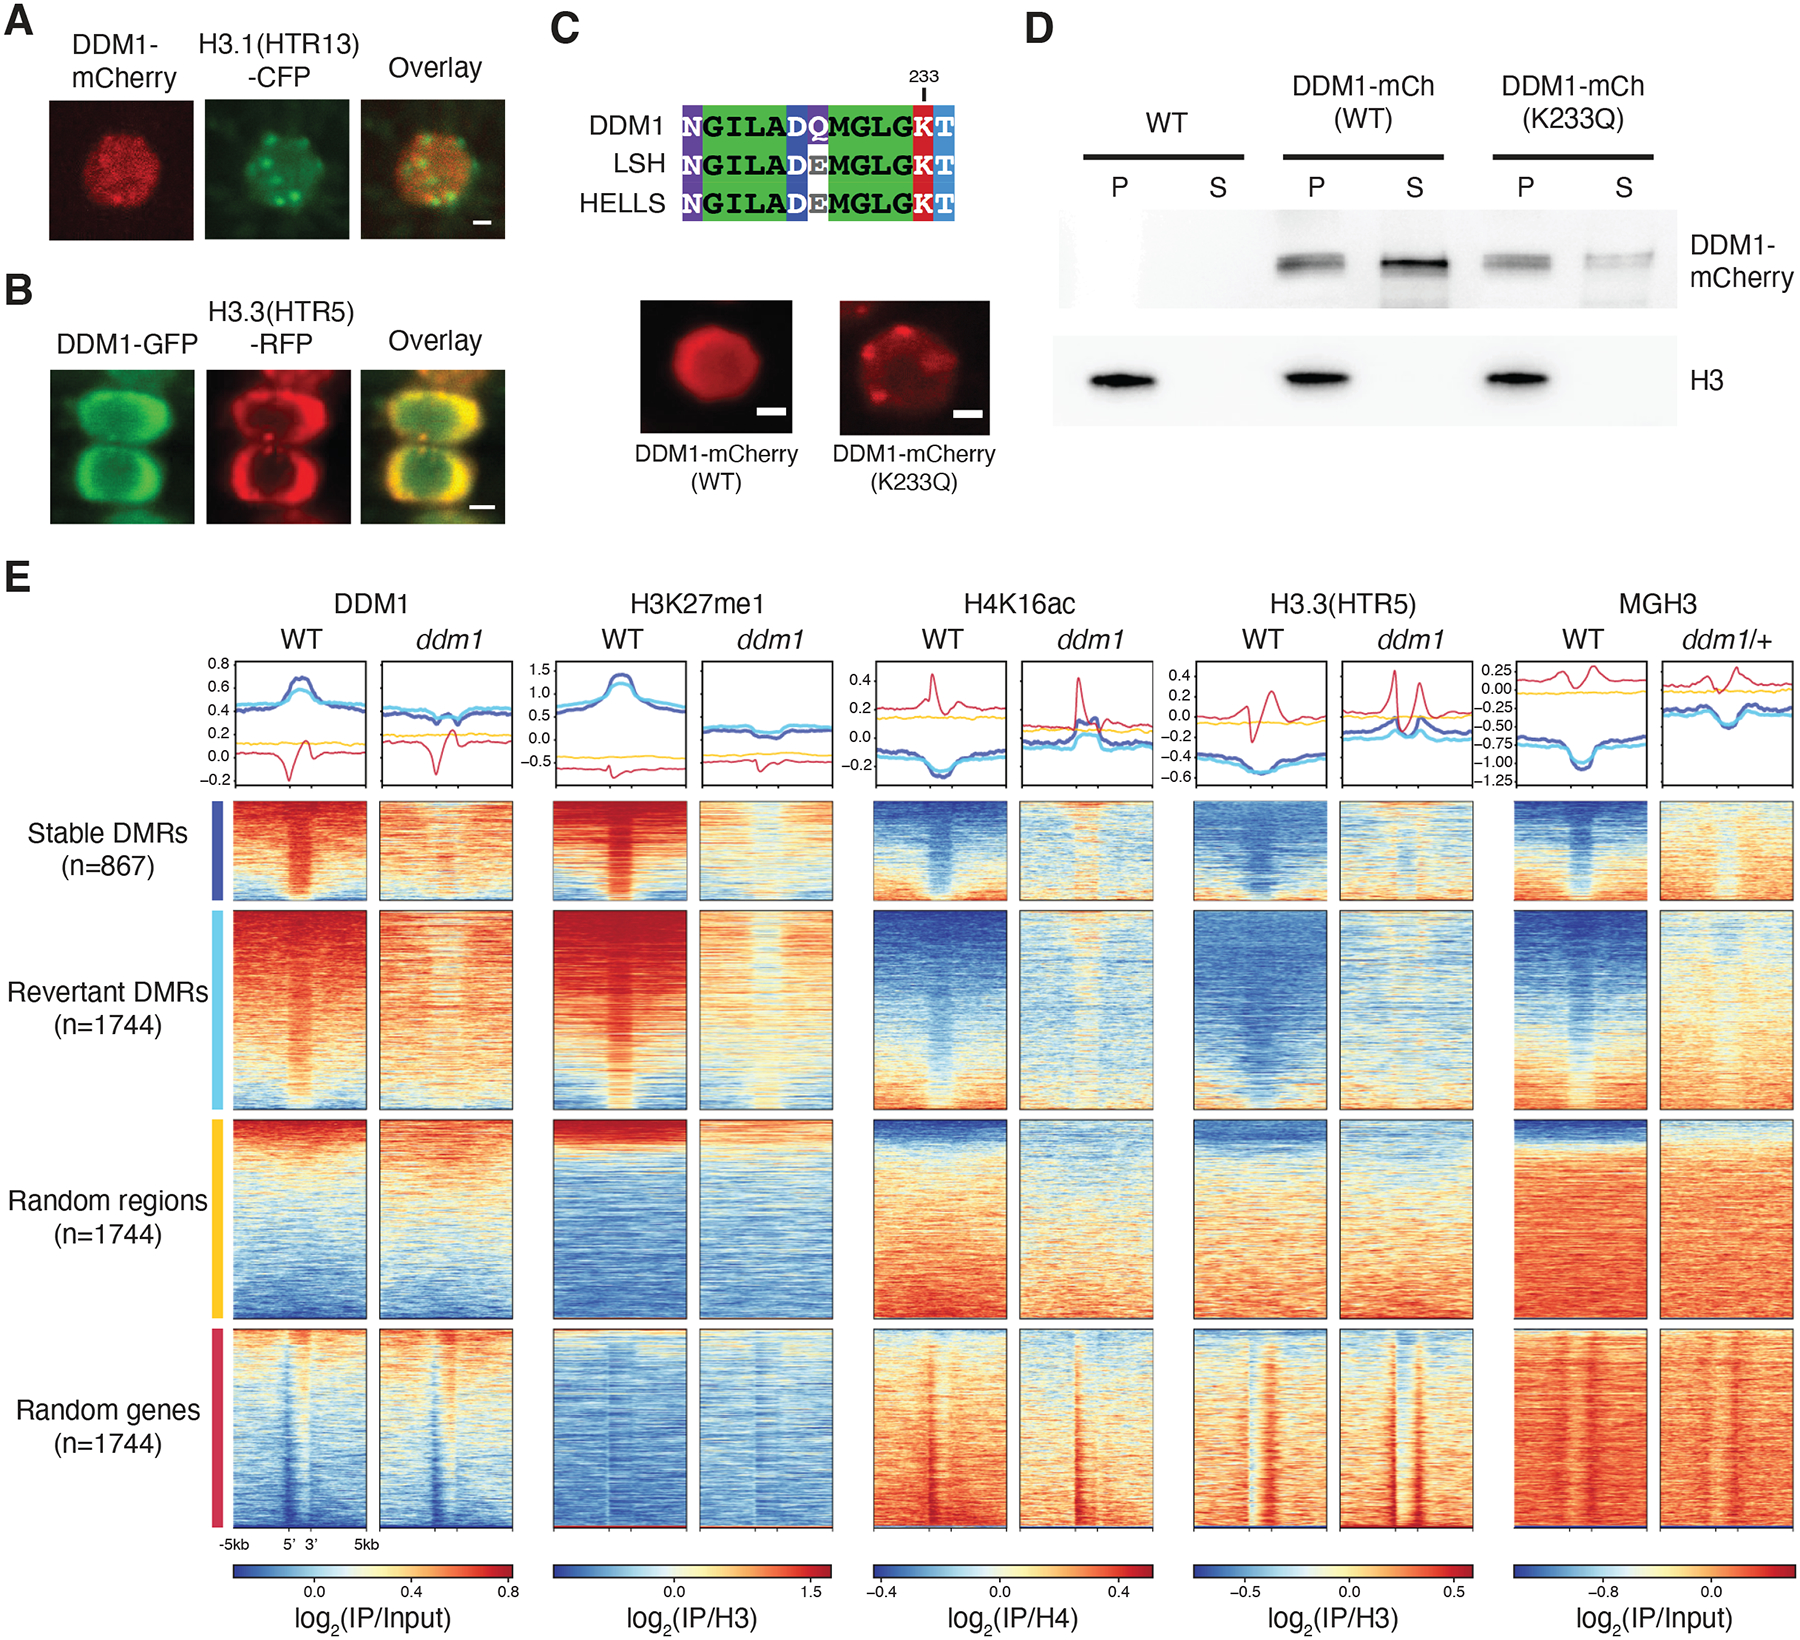
Figure 6.
DDM1 remodels H3.3 and H3.1 during the cell cycle at differentially methylated targets of DDM1.
(A) Subnuclear localization of DDM1-mCherry in root tip cells as compared to H3.1(HTR13)-CFP during presumptive late S-phase (marked by H3.1-labeled chromocenters). (B) Subnuclear localization of DDM1...
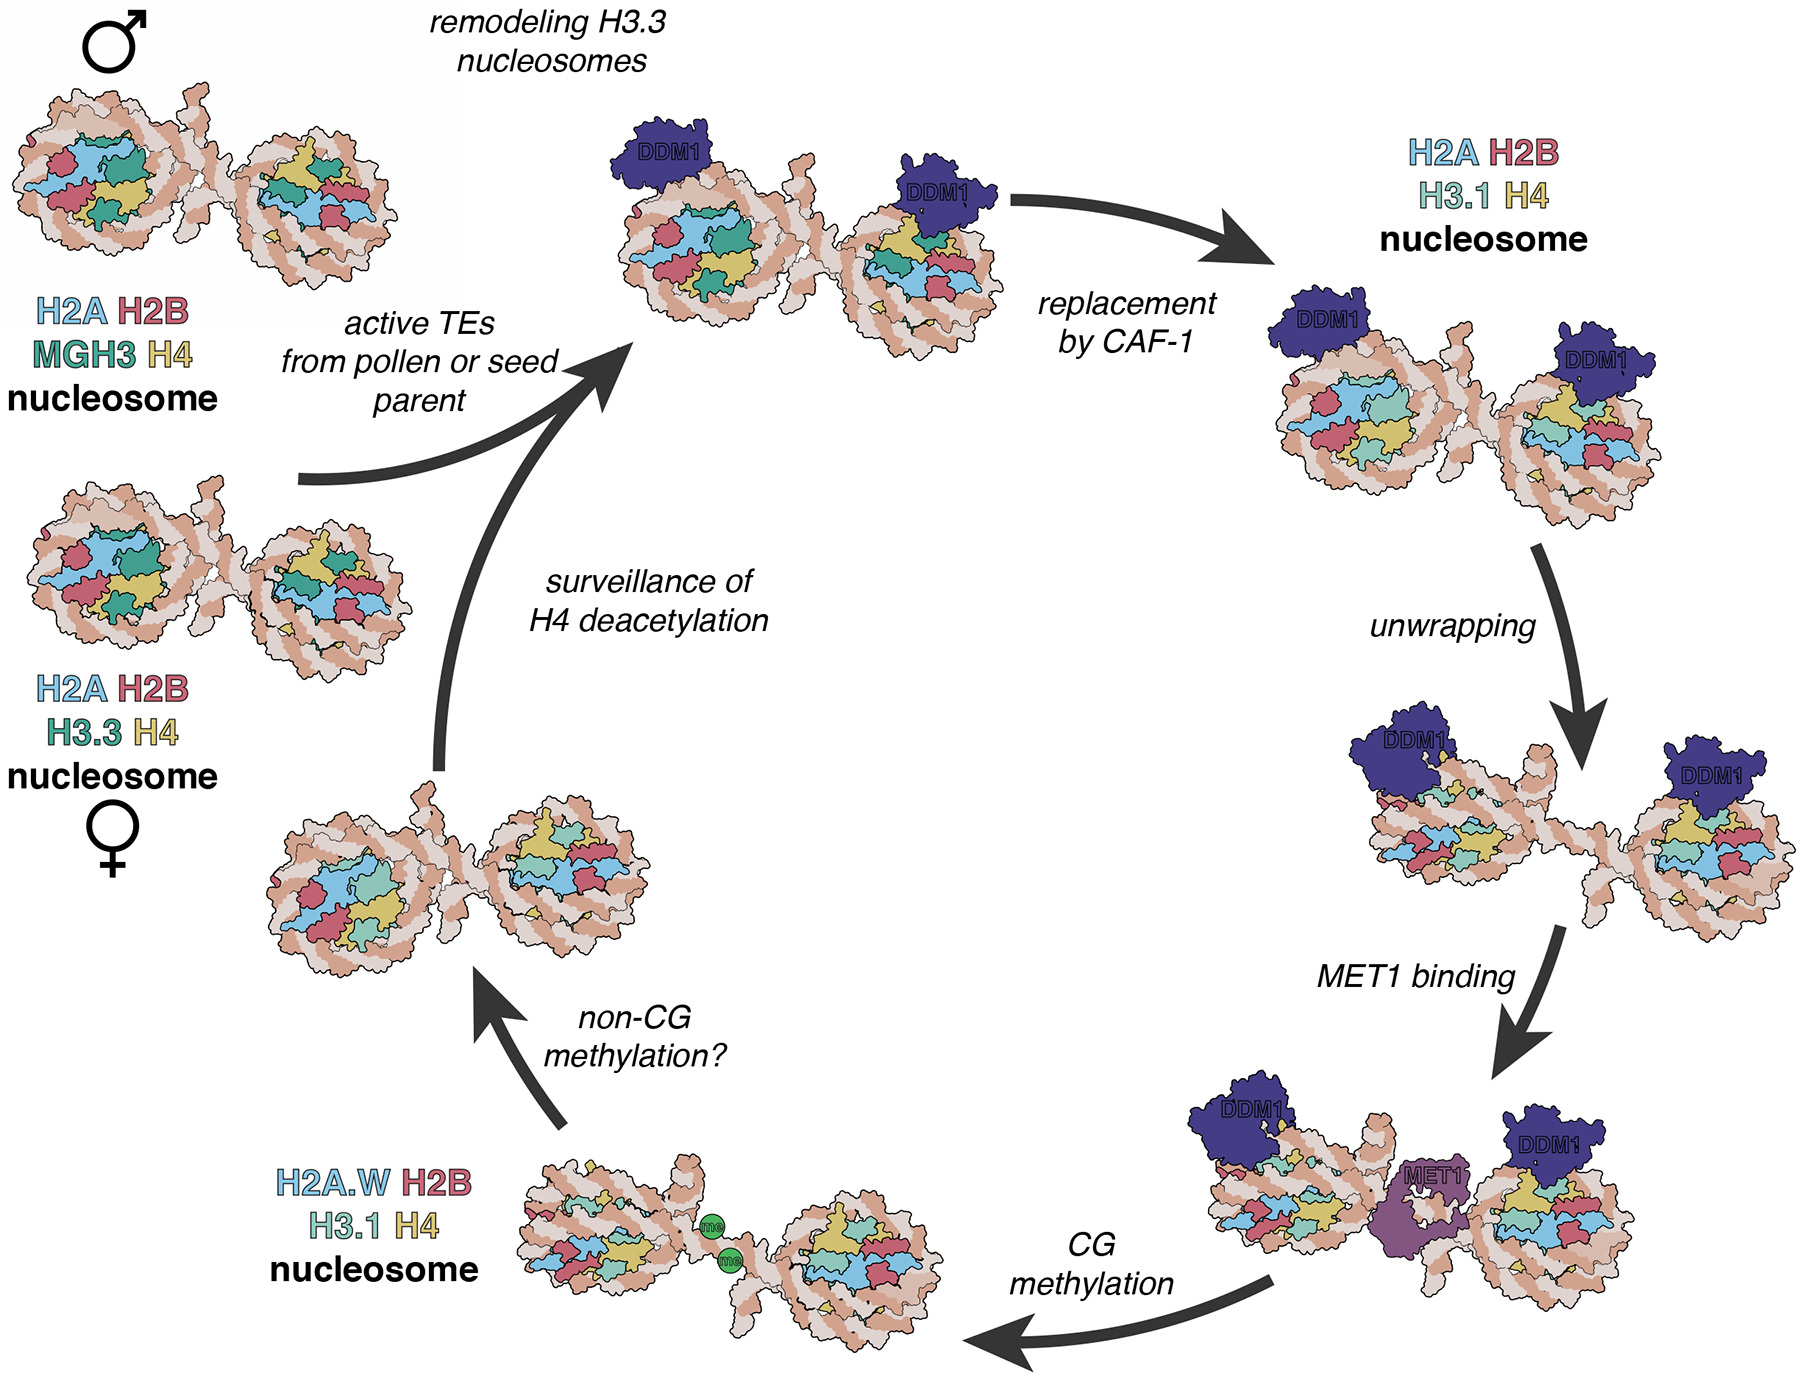
Figure 7.
A model for epigenetic inheritance of unmethylated transposons.
Active transposable elements (TEs) from male and female gametes are unmethylated and comprise MGH3 H2A and H3.3 H2A nucleosomes, respectively. In the zygote, H3.3 H2A nucleosomes are remodeled by DDM1...
Figure images are served from the NIH/NLM PubMed Central Open Access Subset or Europe PMC; copyright remains with the publishers and authors.
💬 Discussion
0 commentsNo comments yet. Be the first to start a discussion!
Leave a Comment