Abstract
AbstractThe genomes of metazoa are organized at multiple scales. Many proteins that regulate genome architecture, including Polycomb group (PcG) proteins, form subnuclear structures. Deciphering mechanistic links between protein organization and chromatin architecture requires precise description and mechanistic perturbations of both. Using super-resolution microscopy, here we show that PcG proteins are organized into hundreds of nanoscale protein clusters. We manipulated PcG clusters by disrupting the polymerization activity of the sterile alpha motif (SAM) of the PcG protein Polyhomeotic (Ph) or by increasing Ph levels. Ph with mutant SAM disrupts clustering of endogenous PcG complexes and chromatin interactions while elevating Ph level increases cluster number and chromatin interactions. These effects can be captured by molecular simulations based on a previously described chromatin polymer model. Both perturbations also alter gene expression. Organization of PcG proteins into small, abundant clusters on chromatin through Ph SAM polymerization activity may shape genome architecture through chromatin interactions.
🔬 Techniques
🧬 Organisms
💻 Software
✨ Fluorophores
🧪 Sample Preparation
🔬 Cell Lines
🏭 Microscope Brands
🧪 Reagent Suppliers
💻 Software Details
💾 Data Repositories
🏛️ Research Organizations (ROR)
Affiliated research institutions:
📋 Methods
Cells lines and protein purifications Drosophila S2 cells were obtained from Expression Systems and cultured on plates or in shaker flasks at 27 °C in ESF921 media (Expression Systems). Constructs for expressing epitope tagged mutant and Ph-WT were generated by cloning Ph into a pMT vector modified to encode tandem 2XFLAG and biotin ligase recognition peptide (BLRP) sequences (note that this construct was described previously 34 48 . Drosophila has highly similar tandem copies of the ph gene, ph-proximal and ph-distal . ph-proximal was used in all of this work. Ph SAM mutations were generated by site-directed mutagenesis. All Ph-coding sequence was verified by sequencing. Stable cell lines were generated by transfecting cells with plasmids encoding BLRP-2XFLAG-Ph (Ph-WT) or BLRP-2XFLAG-Ph-L1547/H1552R (Ph-ML) and a plasmid encoding the E. coli Biotin ligase (BirA) and the puromycin resistance gene ( Supplementary Fig. 2 ). Both Ph variants and BirA are controlled by the metallothionein promoter. For some experiments ( Supplementary Fig. 10 ), cell lines were made with a plasmid-expressing green fluorescent protein constitutively along with the Ph and BirA plasmids. Green fluorescent protein-expressing cells were isolated by FACS to increase the fraction of Ph-expressing cells, and propagated as stable lines. Ph-WT, Ph-EH or Ph-ML expression was induced by treatment for 3 days with 0.5 mM copper sulphate. To purify Ph-associated complexes, nuclear extracts were prepared from 1 l of induced cells. Nuclear extracts were prepared essentially as described 49 . Detailed protocols are available on request. For purification of PcG complexes, nuclear extracts were incubated with anti-FLAG beads overnight at 4 °C on a rotator, washed 2 × with BC300N (20 mM hepes, 20% glycerol, 0.2 mM EDTA, 0.05% NP40, 300 mM KCl, pH 7.9), 2 × with BC600N and 2 × with BC1200N, and once again with BC600N and BC300N. PcG complexes were eluted in BC300N containing 0.4 mg ml −1 of 2X FLAG peptide. Protease inhibitors (0.2 mM PMSF, 10 μg ml −1 leupeptin, 10 μg ml −1 aprotinin, 2 μg ml −1 pepstatin, 16 μg benzamidine, 10 μg ml −1 phenanthroline, 50 μg ml −1 N-a-tosyl-L-lysine chloromethyl ketone hydrochloride (TLCK)) and dithiothrietol (DTT) (0.5 mM) were added to all buffers and extracts, and all procedures were carried out at 4 °C. For tandem anti-FLAG and streptavidin purification, FLAG elutions were pooled and incubated overnight with M280 streptavidin-coated Dynabeads. Beads were captured and washed five times with BC300N, once with BC50N and boiled in sample buffer to release purified proteins. Expression of PRC1 in Sf9 cells and subsequent purification were as described 48 except that nuclei were purified through a sucrose cushion before extraction. Density gradient centrifugation A measure of 4 ml 10–40% glycerol gradients were prepared manually by layering 200μl of solutions with decreasing amounts of glycerol in BC300N. Anti-FLAG (100 μl) purified PcG complexes were mixed with 100 μl of BC300N (containing no glycerol) to make the final glycerol concentration to 10%. A measure of 200 μl of this mix were loaded on the gradients, and centrifuged for 6 h at 103,400 g in an SW55Ti rotor at 4 °C in a Beckman ultracentrifuge. Fractions (200 μl) were collected and analysed by western blotting. Western blots were quantified using Image J software. The gradient input was included on each gel to serve as a standard for quantification of fractions from the same gradient across gels. Supplementary Fig. 12 shows examples of full blots used for quantification. Primary antibodies for analysis of gradients were anti-Ph (kind gift of J. Mueller), anti-PSC (generated in our lab), anti-dRING (kind gift of R. Jones) and anti-Pc (kind gift of J. Mueller).
Show full methods section
Cells lines and protein purifications Drosophila S2 cells were obtained from Expression Systems and cultured on plates or in shaker flasks at 27 °C in ESF921 media (Expression Systems). Constructs for expressing epitope tagged mutant and Ph-WT were generated by cloning Ph into a pMT vector modified to encode tandem 2XFLAG and biotin ligase recognition peptide (BLRP) sequences (note that this construct was described previously 34 48 . Drosophila has highly similar tandem copies of the ph gene, ph-proximal and ph-distal . ph-proximal was used in all of this work. Ph SAM mutations were generated by site-directed mutagenesis. All Ph-coding sequence was verified by sequencing. Stable cell lines were generated by transfecting cells with plasmids encoding BLRP-2XFLAG-Ph (Ph-WT) or BLRP-2XFLAG-Ph-L1547/H1552R (Ph-ML) and a plasmid encoding the E. coli Biotin ligase (BirA) and the puromycin resistance gene ( Supplementary Fig. 2 ). Both Ph variants and BirA are controlled by the metallothionein promoter. For some experiments ( Supplementary Fig. 10 ), cell lines were made with a plasmid-expressing green fluorescent protein constitutively along with the Ph and BirA plasmids. Green fluorescent protein-expressing cells were isolated by FACS to increase the fraction of Ph-expressing cells, and propagated as stable lines. Ph-WT, Ph-EH or Ph-ML expression was induced by treatment for 3 days with 0.5 mM copper sulphate. To purify Ph-associated complexes, nuclear extracts were prepared from 1 l of induced cells. Nuclear extracts were prepared essentially as described 49 . Detailed protocols are available on request. For purification of PcG complexes, nuclear extracts were incubated with anti-FLAG beads overnight at 4 °C on a rotator, washed 2 × with BC300N (20 mM hepes, 20% glycerol, 0.2 mM EDTA, 0.05% NP40, 300 mM KCl, pH 7.9), 2 × with BC600N and 2 × with BC1200N, and once again with BC600N and BC300N. PcG complexes were eluted in BC300N containing 0.4 mg ml −1 of 2X FLAG peptide. Protease inhibitors (0.2 mM PMSF, 10 μg ml −1 leupeptin, 10 μg ml −1 aprotinin, 2 μg ml −1 pepstatin, 16 μg benzamidine, 10 μg ml −1 phenanthroline, 50 μg ml −1 N-a-tosyl-L-lysine chloromethyl ketone hydrochloride (TLCK)) and dithiothrietol (DTT) (0.5 mM) were added to all buffers and extracts, and all procedures were carried out at 4 °C. For tandem anti-FLAG and streptavidin purification, FLAG elutions were pooled and incubated overnight with M280 streptavidin-coated Dynabeads. Beads were captured and washed five times with BC300N, once with BC50N and boiled in sample buffer to release purified proteins. Expression of PRC1 in Sf9 cells and subsequent purification were as described 48 except that nuclei were purified through a sucrose cushion before extraction. Density gradient centrifugation A measure of 4 ml 10–40% glycerol gradients were prepared manually by layering 200μl of solutions with decreasing amounts of glycerol in BC300N. Anti-FLAG (100 μl) purified PcG complexes were mixed with 100 μl of BC300N (containing no glycerol) to make the final glycerol concentration to 10%. A measure of 200 μl of this mix were loaded on the gradients, and centrifuged for 6 h at 103,400 g in an SW55Ti rotor at 4 °C in a Beckman ultracentrifuge. Fractions (200 μl) were collected and analysed by western blotting. Western blots were quantified using Image J software. The gradient input was included on each gel to serve as a standard for quantification of fractions from the same gradient across gels. Supplementary Fig. 12 shows examples of full blots used for quantification. Primary antibodies for analysis of gradients were anti-Ph (kind gift of J. Mueller), anti-PSC (generated in our lab), anti-dRING (kind gift of R. Jones) and anti-Pc (kind gift of J. Mueller).
Immunofluorescence Drosophila S2 cells and S2 cell lines expressing
Ph-WT or Ph-ML were grown on Concanavalin A-coated coverslips for 1.5 h. Cells were washed with phosphate-buffered saline (PBS), fixed with 4% formaldehyde (in PBS) for 10 min and washed twice with PBS. Freshly prepared sodium borohydride (1 mg ml −1 ) solution was added to cells for 7 min, and cells were again washed twice with PBS. Cells were incubated in permeabilization buffer (1 × PBS, 0.02% Tween-20 and 0.1% Triton X-100) for 15 min. Two washes of PBST (1 × PBS, 0.02% Tween-20) were carried out before blocking cells 30 min in PBST containing 2% BSA. Primary antibodies diluted 1:200 in PBST+2% BSA were added to coverslips and incubated overnight at 4 °C. After washing three times with PSBT* (1 × PBS, 0.1% Tween), cells were briefly blocked again for 5 min in PBST*containing 2% BSA. Appropriate secondary antibodies (diluted 1:200 in PBST*+2% BSA) were added to coverslips for 1 h. Coverslips were washed three times with PBST* and mounted for imaging. All procedures were carried out at room temperature unless otherwise indicated. Three primary antibodies were used, anti-Ph, anti-Pc (kind gifts of J. Mueller) and M2 anti-FLAG (Sigma F1804). Secondary antibodies (donkey anti-rabbit, R&D systems D-301-C-ABS2, donkey anti-mouse, R&D systems D-201-C-ABS2, and donkey anti-mouse Jackson Immunoresearch, 715-005-150) were conjugated to NHS-ester reactive Alexa-Fluor 405, Alexa-Fluor 647, Alexa-Fluor 750 or Cy7 dyes. An average labelling ratio of 2 Alexa-Fluor 405 dyes and 1–2 647 dyes or 2–4 Alexa-Fluor 750 or Cy7 dyes per antibody was confirmed by absorption spectroscopy.
STORM imaging
Cells were imaged on a customized Olympus IX-71 inverted microscope configured for oblique incidence excitation. Microscope configuration for sequential dual colour 750/647 imaging using a Quadview set-up was performed as previous described 50 . This configuration requires no moving parts (for example, filterwheels) to switch between chromatic channels, thus reducing alignment error between channels. This set-up has a resolution of 20–25 nm for the Alexa 647 channel and 25–35 nm for the Alexa 750 channel 20 21 . Images of fiducial beads (715/750 FluoSpheres, Life Technologies) visible in both the 750 and 647 channel were acquired prior data acquisition and used later to correct for chromatic aberrations (see below). Fiducial beads (200 nm 540/560 FluoSpheres, Life Technologies), illuminated with a 561 laser were simultaneously tracked during image acquisition. Movies of Alexa750 and Cy7 dyes were taken for 20,000–30,000 frames at 60 Hz. Movies of Alexa647-labelled samples were taken for 60,000–100,000 frames at 60 Hz. 405 activation laser intensity was ramped during a calibration movie for each data set (0.1–30 W cm −2 ) to maintain an approximately constant rate of photo-switching events per frame. The same activation laser ramp and number of frames was then used for all samples in a data set. Imaging buffer was used as previously described for single-colour imaging with Alexa-Fluor647 (ref. 51 ) using β ME as a thiol. Dual-colour imaging was performed with 0.5% (v/v) β ME instead of 1% and with an addition of 1% (v/v) cyclooctatetraene (2M in DMSO), to increase photon count per switching cycle 52 .
Image analysis
Fluorophores were localized using a previously described multi-fitting algorithm 53 . Bead trajectories (imaged at 60 Hz) from fiducial tracking during each image were smoothed with 200 frame averaging window to improve localization accuracy and used to correct stage drift in the STORM images. For multi-colour data, images of fields of 100 nm 715/755 FluoSpheres and 200 nm 540/560 FluoSpheres acquired before and after STORM images were used to compute polynomial chromatic corrections. Typical alignment error for these maps was ∼10 nm. These maps were then applied to the multi-colour STORM data after drift correction for aligning the two colour channels. Clusters were determined as follows: the positions of all detected molecules in the cell were discretized into small bins (typically ∼15 × 15 nm, see below). Any connected set of non-empty bins surrounded by empty bins was considered to be a cluster (including isolated, single bins). Non-empty bins that are adjacent or diagonal to one another were considered connected. Bin size was adjusted for variation in the molecule count density following the equation: bin size=15 nm × (average localizations per cell/localizations in this cell) 1/2 . The range of sizes was further restricted to be between 10 and 30 nm. The resulting bin sizes were 15±2.5 nm (mean±std). This adjustment improved the agreement between the automated cluster calls and the visual impression of clustering across the data set. Colocalization analysis was performed by binning the localizations detected in each channel into 15 × 15 nm bins. The resulting bins were clustered in each channel separately, based on being surrounded by non-empty bins as described above. Clusters smaller than our 30 nm resolution limit (single bins) were excluded from this analysis. Clusters which overlapped (contained at least one bin in which localizations from both channels were detected) were considered to be colocalized. We then report the fraction of localizations which were assigned to clusters considered to be colocalized relative to the total number of localizations from all clusters. We also refer to this ratio as the degree of overlap between the channels. ChIP-seq ChIP was carried out essentially as described 34 .
Drosophila S2 cell lines-expressing
Ph-WT or Ph-ML were induced for 3 days, fixed with 1% formaldehyde for 10 min at RT and quenched with 1 M glycine, pH 7.9. Cells were washed with 1 × PBS, wash buffer I (10 mM hepes, pH 7.6, 10 mM EDTA, 0.5 mM EGTA, 0.25% Triton-X-100), and wash buffer II (10 mM hepes, pH 7.6, 200 mM NaCl, 1 mM EDTA, 0.5 mM EGTA, 0.01% Triton-X-100). Cells were centrifuged and resuspended in sonication buffer (50 mM hepes, pH 7.5, 500 mM NaCl, 1 mM EDTA, 1% Triton X-100, 0.1% sodium deoxycholate, 0.1% SDS) to a cell concentration of 20 × 10 6 cells ml −1 . Cells (1 ml) was sonicated with 4 × 30 s pulses with 30 s between pulses using a Sonics Vibracell sonicator at 40% power. Following sonication, samples were centrifuged for 5 min at 14,000 r.p.m. in a microcentrifuge at 4 °C. The supernatant was used for ChIP. Sonicated chromatin (400 μl) were mixed with 600 μl of ChIP buffer to make buffer concentration to 1 × ChIP buffer (15 mM Tris, pH 8, 150 mM NaCl, 1 mM EDTA, 1% Triton X-100 and 0.01% SDS). The mixture was incubated with beads from 144 μl of M280 streptavidin magnetic beads (Invitrogen) slurry, which were blocked with 0.2 mg ml −1 salmon sperm DNA, and washed with ChIP buffer, overnight at 4 °C on a rotator. Beads were washed 3 × with 1 ml of ChIP buffer, resuspended in 300 μl elution buffer (0.5 M NaCl, 1% SDS) and incubated overnight at 65 °C. Input samples were also mixed with appropriate volume of buffer to make final buffer conditions identical to 1 × elution buffer and all samples were processed similarly from here onwards. A measure of 1 μl of RNase A (30 μg) was added to each sample and samples were incubated for 30 min at 37 °C. Samples were treated with proteinase K (20 μg) for 1 h at 50 °C and DNA was purified using the Nucleospin Extract II kit (Macherey-Nagel). Sequencing libraries were generated as described previously 54 . In brief, ends of the immunoprecipitated DNA were repaired, followed by A-tailing, ligating to universal adaptors and amplification for 10 cycles with indexed primers. Excess adaptors were removed by purification with Agencourt AMPureXP beads (Beckman-Coulter). Fragment size was checked by Bioanalyzer using a high-sensitivity DNA chip and an average size distribution of 300–400 bp was observed. ChIP ChIP experiments to validate binding patterns of Ph-WT and Ph-ML proteins were carried out essentially as described above. ChIP with antibodies against PSC (our lab), Ph (kind gift of J. Mueller), H3 (Abcam ab1791, ChIP grade) and H3K27me3 (Abcam, ab6002, ChIP grade) were carried out essentially as in ref. 34 with the following exceptions. Chromatin (100 μl, corresponding to 2e 6 cells) was diluted to 1X ChIP dilution buffer, and pre-blocked with protein G sepharose (gammabind G, GE Healthcare) that had been incubated with 1% BSA-0.2 mg ml −1 yeast tRNA. Antibodies (4 μg per ChIP) pre-bound to 16 μl of Protein G Dynabeads (Invitrogen) were added to chromatin and samples were incubated overnight at 4 °C with rotation. Washes were carried out for 10 min each at 4 °C with rotation as follows 55 : 1X RIPA (10 mM Tris, pH 8.0, 140 mM NaCl, 1 mM EDTA pH 8.0, 1% Triton X-100, 0.1% sodium deoxycholate, 0.1% SDS), 3X RIPA-500 mM NaCl, 1X LiCl wash (10 mM Tris, pH 8.0, 0.25 M LCl, 1 mM EDTA, 1% NP40 and 1% sodium deoxycholate), 2X TE. Samples were eluted by incubating with 0.5 M NaCl/1% SDS/0.1 M NaHCO 3 at 65 °C twice for 15 min each. To reverse cross-links, ChIP elutions and input samples were incubated for 15 min at 95 °C. Samples were treated with RNaseA and Proteinase K, and purified as described above. Purified DNA was quantified by real-time PCR with SYBR green on a ViiA7 instrument. PCR was run in ‘standard curve' mode with genomic DNA from S2 cells as the standard. Primer sequences were mostly previously described 34 ; additional sequences are in Supplementary Table 1 . 4C-seq After 3 days of induction, Drosophila S2 cells and S2 cells expressing Ph-WT or Ph-ML were cross-linked with formaldehyde as described above. Nuclei were prepared by incubating fixed cells in Buffer A (20 mM hepes pH 7.5, 1.5 mM MgCl 2 , 10 mM KCl and 0.1% NP40) for 12 min on ice, douncing 60 times and centrifuging at 150 g for 1 min at 4 °C. The supernatant was centrifuged at 1,000 g for 10 min, and pelleted nuclei were washed with PBST. 4C-seq was carried out as described elsewhere 31 . In brief, Nuclei were resuspended in 180 μl of water and 20 μl of 10 × NlaIII buffer. Nuclei were digested with NlaIII for 20 h at 37 °C in a thermo-shaker set at 1,000 r.p.m. NlaIII was inactivated by incubating samples at 65 °C for 10 min. Digested DNA was ligated with T4 DNA ligase overnight at 16 °C. Ligation mixture was treated with Proteinase K, cross links were reversed by overnight incubation at 65 °C, and RNase A treatment was performed for 30 min at 37 °C. Phenol–chloroform extracted and ethanol precipitated DNA was digested with DpnII for 7 h at 37 °C in a thermo-shaker set at 1000, rpm. DpnII was inactivated by incubating samples at 65 °C for 15 min and DNA was ligated with T4 DNA ligase overnight at 16 °C. DNA was purified by phenol–chloroform extraction and ethanol precipitation and resuspended in 30 μl of water. DNA (20 ng) per 50 μl of PCR reaction mixture was amplified for 30 cycles by expanded long-range DNA polymerase (Roche) using indexed viewpoint primers. Base pair (100) single-end reads were sequenced at the Genomics Platform, University of Genève. Note that the sequenced primer corresponds to the secondary (DpnII) junction rather than the primary (NlaIII) one. Primers used for 4C-seq are in Supplementary Table 2 . HTS-pipeline analysis of 4C-seq inside the BX-C 4C-seq reads were de-multiplexed and aligned to the Drosophila genome using the HTSstation pipeline ( http:// htsstation.vital-it.ch/ ) 32 . Reads were normalized over a region encompassing the BX-C (chr3R:12367359:12885749) and raw interaction frequencies smoothened using a running mean of three fragments as described previously 56 . The region 5 kb up- and downstream from the viewpoint sequence was excluded from the analysis. These interaction frequencies were averaged over the two experiments to create the tracks displayed in Supplementary Fig. 8 . To create Fig. 3a , Ph-WT and Ph-ML normalized frequencies were divided by those from S2 cells; 1 was subtracted from the ratios so that increased frequencies are positive and decreased ones negative. To analyse the pattern of ‘near' versus ‘far' contacts for the Abd-B and Fab-6 viewpoints (both of which fall within the regulatory region of Abd-B ), the ‘near' region was defined by the boundary between the iab3 and iab4 elements (chr3R:12681222), which regulate abd-A and Abd-B , respectively. To analyse ‘near' versus ‘far' contacts for the Ubx viewpoint, the proximal region was defined by the start of the bxd non-coding transcript (chr3R:12598911). Note that this analysis was carried out using several different boundary demarcations for ‘near' versus ‘far' (for example, iab3/4 for all three viewpoints, the bxd/pbx-iab-2 boundary for Ubx or defining ‘near' as the 70 kb on one side of the viewpoint) with nearly identical results. For this analysis, the boundaries of the BX-C used were chr3R:12480479-12821577. 4C-seqpipe analysis of 4C-seq data 4C-seqpipe analysis was carried out as described 31 . Because our primers were designed to read second enzyme (DpnII) junction rather than the primary (NlaIII) one, DpnII was designated as the first cutter and NlaIII as the second. Contacts were calculated from chr3R:12100000–13100000. fourSig analysis of 4C-seq data To prepare 4C-seq data for analysis, barcode sequences and the ligation junction were removed using fastxtools ( http://hannonlab.cshl.edu/fastx_toolkit ). Sequences were further trimmed to 35 base pairs to allow mapping of even very short-ligated fragments and aligned to the Drosophila genome (dm3) using Bowtie2 (ref. 57 ). Aligned reads were used as the input for fourSig to create tables of reads mapped to restriction fragments. All analysis was carried out using the ‘mappability' function of fourSig . For details on fourSig , please see ref. 35 and the accompanying tutorial http://starmer.med.unc.edu/~jstarmer/fourSig/TUTORIAL.html . The fourSig programme identifies significant contacts by determining a threshold number of reads for a given window size that is higher than the background. For all of our analyses, the FDR for the #reads per window that is significant was set to 0.001, and 1,000 random shuffling steps were used to generate the background threshold. The ‘fdr.prob' parameter which is fraction of iterations that exceed the FDR was set to 0.01. FourSig also prioritizes interactions based on how ‘broad' the interaction is. Thus, the most stringent interactions remain significant if the #reads/window remains significant after removing the fragment with the highest number of reads. We used only the most stringent contacts for BX-C for analysis. FourSig generates tables of merged contiguous windows where significant contacts are observed. These tables were loaded directly into the UCSC genome browser for visualization and have been uploaded to GEO. The contacts identified in different experiments are different lengths. Thus, to compare contacts among different cell types, we used BEDtools 58 to convert the merged windows to the number of restriction fragments. Graphs ( Fig. 4b , Supplementary Fig. 4c ) show the average number of fragments in 4C contacts in Ph-WT or Ph-ML cells normalized to fragments in contacts from S2 cells. For the analysis of chromosome 3R, we used a 25-fragment sliding window. Approximately 9 kb of sequence spanning the viewpoint was excluded from the analysis. A more limited set of tests with smaller or larger window sizes also showed the same trends in the data. To analyse the overlap between contacts identified by fourSig and Ph ChIP peaks, we used the BEDtools intersect function.
ChIP-seq Analysis
Sequencing was performed using Illumina Hi-seq 2000. Two biological replicates of ∼45–50 million (per sample), 50 bp, single-end reads were aligned against the dm3 genome using the BWA aligner with an alignment rate of at least 88% (ref. 59 ). The average fragment length was ∼300–400 bp. We filtered the alignments for uniquely mapped reads and removed PCR duplicates, resulting in 16–28 million reads per sample. We calculated input-subtracted read densities using SPP and calculated SPP broad peaks at fdr50% relative to wild type using the average change across the two biological replicate data sets. We then measured the distance from these points to the centre of the nearest Ph peak using a K-nearest neighbours search (Matlab 2014a) and compared this average distance to the average distance for points that changed by
📊 Figures
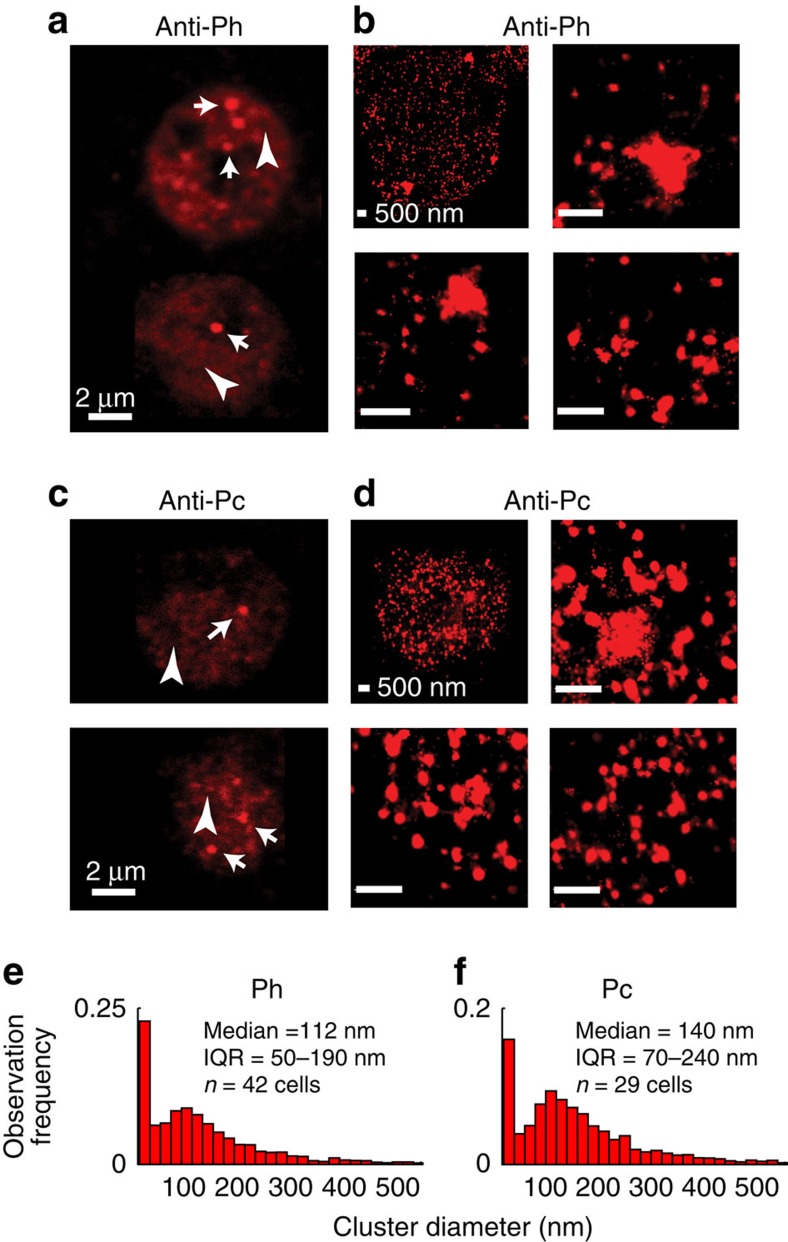
Figure 1
PRC1 has a multi-scale subnuclear organization.
( a , c ) Confocal images showing Ph ( a ) or Pc ( c ) foci (arrows) and diffuse staining (arrow heads) outside foci in Drosophila S2 cells immunostained with anti-Ph ( a ) or anti-Pc ( c ) antibodies...
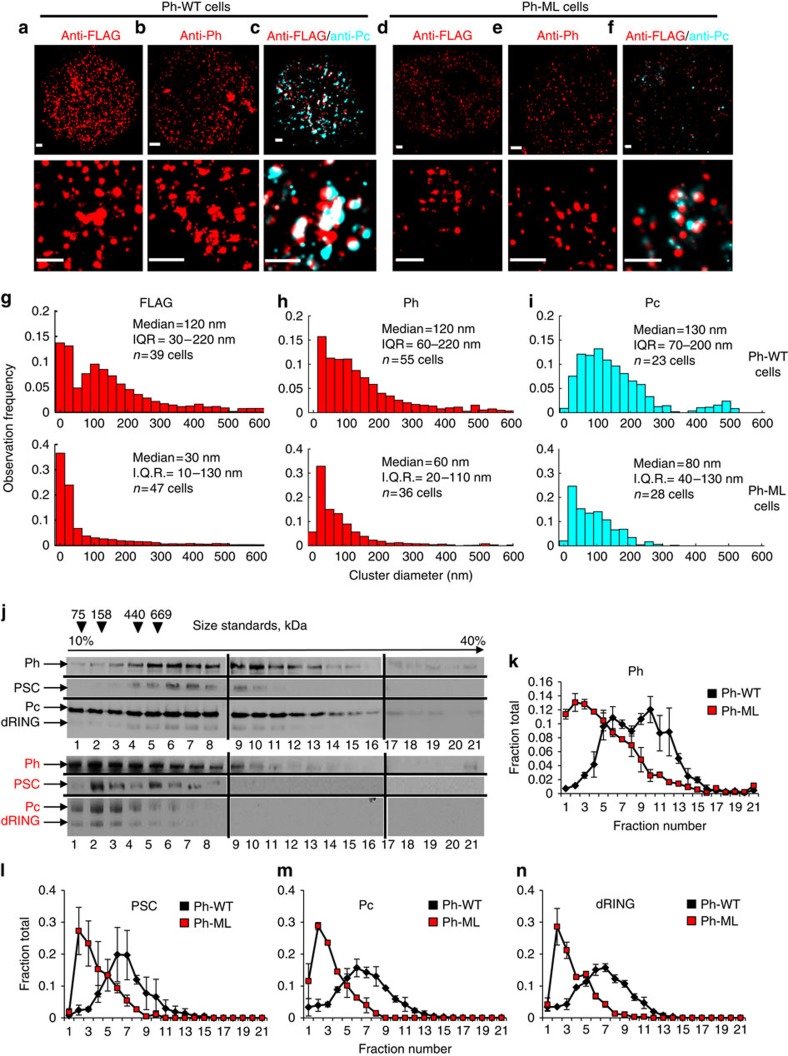
Figure 2
PRC1 clustering depends on Ph SAM polymerization activity.
Drosophila S2 cell lines expressing either Ph-WT ( a u2013 c ) or Ph-ML ( d u2013 f ) were stained with the indicated antibodies and imaged by STORM. Top panels show whole nuclei. Scale bars, 500u2009...
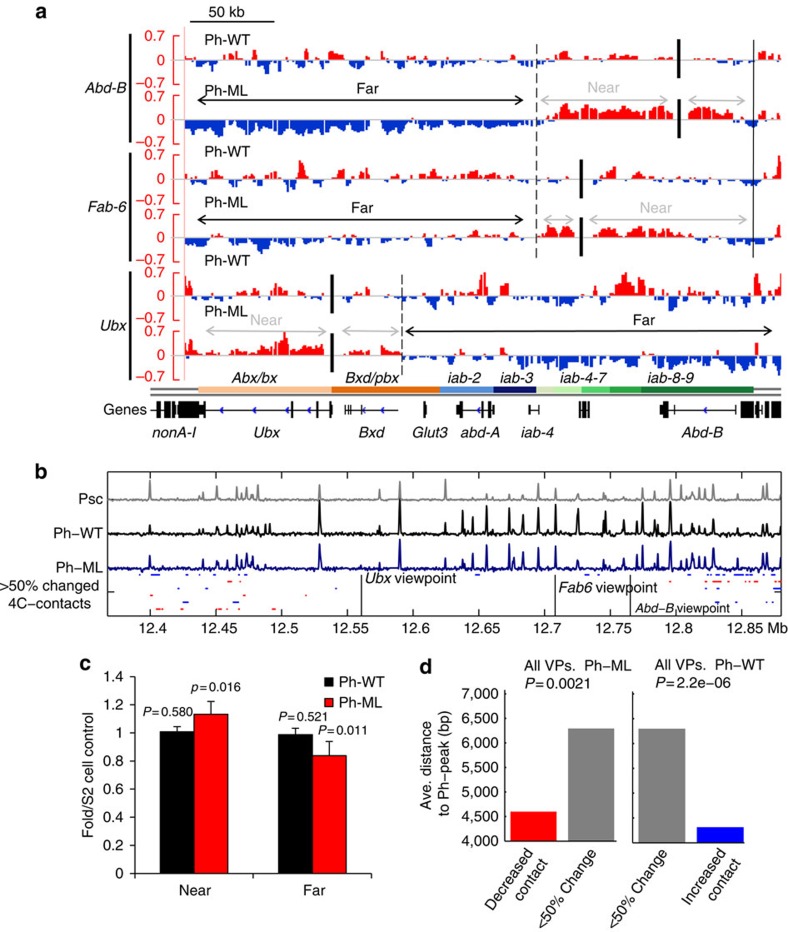
Figure 3
Ph SAM-dependent effects on chromatin organization in the Bithorax-Complex of Hox genes.
( a ) Chromatin interactions in the BX-C as determined by 4C-seq. Tracks show the average (of duplicates) ratio of reads in Ph-WT or Ph-ML expressing cells to those in control S2 cells, minus one so t...
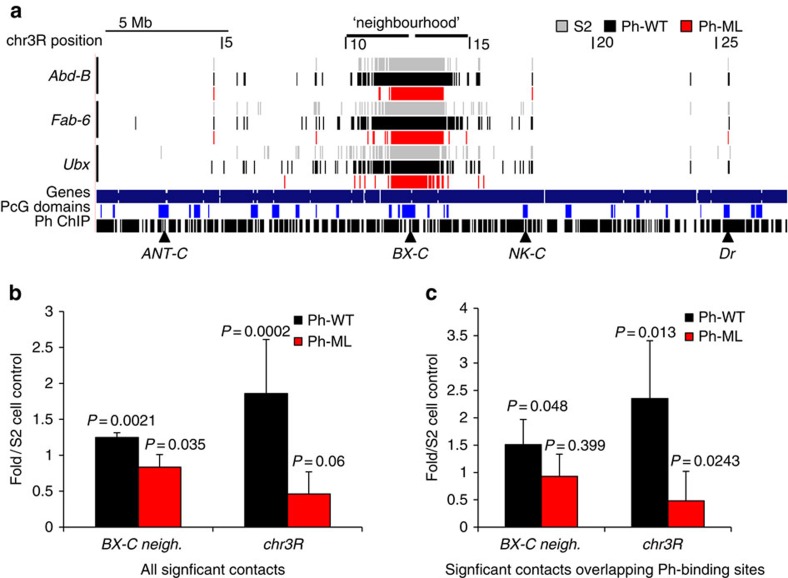
Figure 4
Long-range contacts between the BX-C and regions on chromosome 3R.
( a ) Significant contacts identified using fourSig 35 between viewpoints within the BX-C and chromosome 3R. See also Supplementary Fig. 10 . Triangles mark the BX-C and some PcG domains previously id...
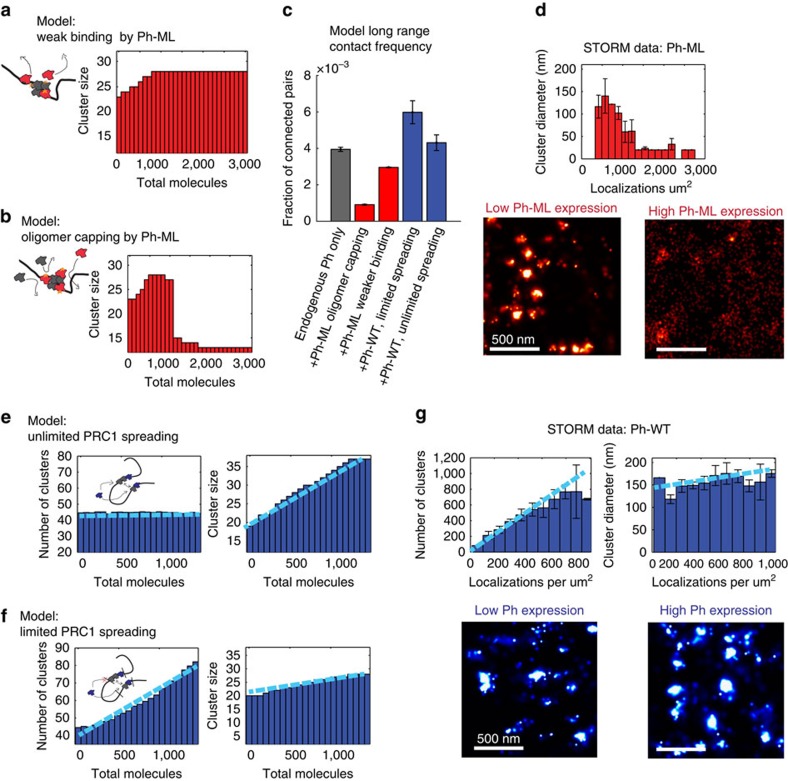
Figure 5
Molecular modelling of Ph SAM-dependent organization of PcG proteins and chromatin topology.
( a , b ) Simulations of the effect of Ph-ML concentration on cluster size in either the weak binding ( a ) or oligomer capping ( b ) models. ( c ) Quantification of the frequency of long-range contac...
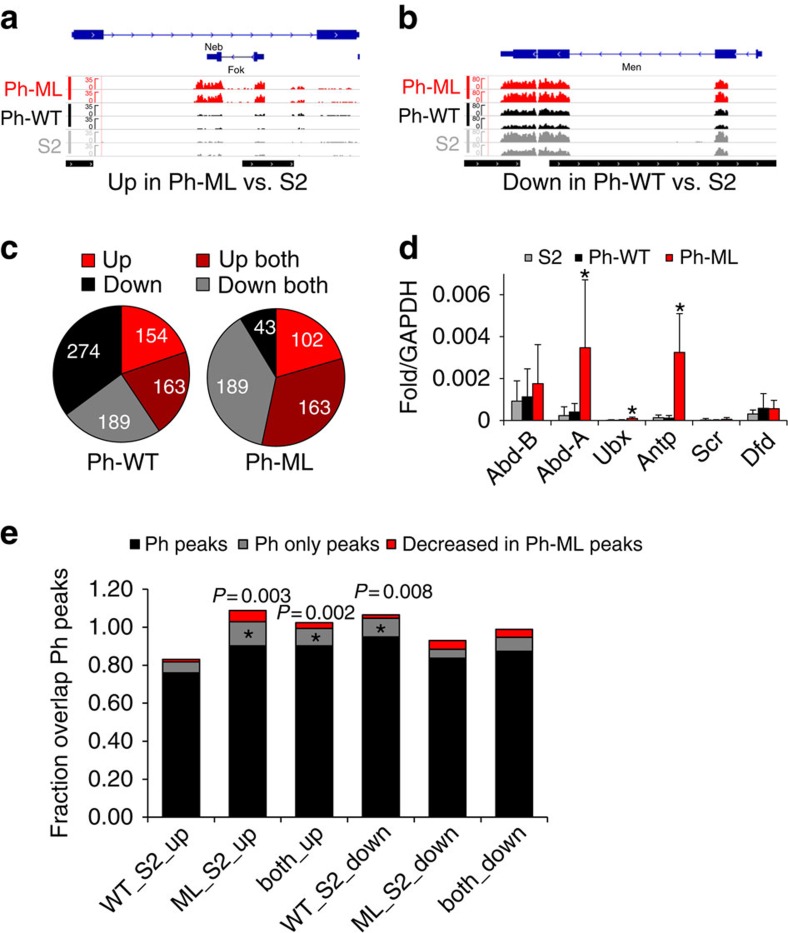
Figure 6
Gene expression changes induced by increased wild-type or mutant Ph.
( a , b ) Sample traces from RNA-seq data of genes that are derepressed in Ph-ML cells ( a ), or repressed in Ph-WT cells ( b ). Normalized traces of both replicates of each of the three data sets (S2...
Figure images are served from the NIH/NLM PubMed Central Open Access Subset or Europe PMC; copyright remains with the publishers and authors.
💬 Discussion
0 commentsNo comments yet. Be the first to start a discussion!
Leave a Comment