Abstract
BACKGROUND: Mammographically dense breast tissue is one of the greatest risk factors for developing breast carcinoma. Despite the strong clinical correlation, breast density has not been causally linked to tumorigenesis, largely because no animal model has existed for studying breast tissue density. Importantly, regions of high breast density are associated with increased stromal collagen. Thus, the influence of the extracellular matrix on breast carcinoma development and the underlying molecular mechanisms are not understood. METHODS: To study the effects of collagen density on mammary tumor formation and progression, we utilized a bi-transgenic tumor model with increased stromal collagen in mouse mammary tissue. Imaging of the tumors and tumor-stromal interface in live tumor tissue was performed with multiphoton laser-scanning microscopy to generate multiphoton excitation and spectrally resolved fluorescent lifetimes of endogenous fluorophores. Second harmonic generation was utilized to image stromal collagen. RESULTS: Herein we demonstrate that increased stromal collagen in mouse mammary tissue significantly increases tumor formation approximately three-fold (p < 0.00001) and results in a significantly more invasive phenotype with approximately three times more lung metastasis (p < 0.05). Furthermore, the increased invasive phenotype of tumor cells that arose within collagen-dense mammary tissues remains after tumor explants are cultured within reconstituted three-dimensional collagen gels. To better understand this behavior we imaged live tumors using nonlinear optical imaging approaches to demonstrate that local invasion is facilitated by stromal collagen re-organization and that this behavior is significantly increased in collagen-dense tissues. In addition, using multiphoton fluorescence and spectral lifetime imaging we identify a metabolic signature for flavin adenine dinucleotide, with increased fluorescent intensity and lifetime, in invading metastatic cells. CONCLUSION: This study provides the first data causally linking increased stromal collagen to mammary tumor formation and metastasis, and demonstrates that fundamental differences arise and persist in epithelial tumor cells that progressed within collagen-dense microenvironments. Furthermore, the imaging techniques and signature identified in this work may provide useful diagnostic tools to rapidly assess fresh tissue biopsies.
🔬 Techniques
💻 Software
✨ Fluorophores
🧪 Sample Preparation
🔬 Cell Lines
🏭 Microscope Brands
🧪 Reagent Suppliers
🔴 Lasers
📷 Detectors
💻 Software Details
🏛️ Research Organizations (ROR)
Affiliated research institutions:
📋 Methods
To study the effects of collagen density on mammary tumor formation and progression, we utilized a bi-transgenic tumor model with increased stromal collagen in mouse mammary tissue. Imaging of the tumors and tumor-stromal interface in live tumor tissue was performed with multiphoton laser-scanning microscopy to generate multiphoton excitation and spectrally resolved fluorescent lifetimes of endogenous fluorophores. Second harmonic generation was utilized to image stromal collagen.
Methods Mice The University of Wisconsin animal use and care committee approved this study. Breeding pairs of Col1a1 tmJae mice [ 26 ] in the B6/129 background were obtained from Jackson Laboratory. Male FVB Polyomavirus middle-T mice under the control of the mammary specific MMTV promoter were originally obtained from Dr Amy Moser (University of Wisconsin) and are abbreviated PyVT following the Jackson Laboratory (from which they originated) nomenclature, but are also commonly abbreviated as PyMT or PyV MT. Col1a1 tmJae homozygote males were crossed to C57BL/6 females to generate heterozygous females that were crossed to PyVT males to generate mice with normal and collagen-dense mammary tissues carrying the polyoma transgene. Mice were palpated every 2 to 3 days starting at 8 weeks of age to identify tumors. Genotyping by polymerase chain reaction (PCR) was performed on DNA extracted from tail biopsies (Wizard SV Genomic DNA Purification System, Promega, Madison, WI) using primers indicated in the strain information provided by The Jackson Laboratory. Mice were examined for palpable tumors starting at eight weeks of age and humanely killed at 15 weeks or when the tumor burden became excessive. Histology and mammary gland whole mounts Selected mammary tissues and tumors were fixed in 4% paraformaldehyde in phosphate buffered saline (PBS) and then embedded in paraffin. In addition, all tissues imaged with multiphoton microscopy were subsequently fixed and processed for histology. Tissue sections were stained with hematoxylin and eosin (H&E) with adjacent sections stained with the selective collagen stain, picrosirius red. Mammary whole mounts were prepared by fixing tissues in Carnoy's solution (10% glacial acetic acid, 30% chloroform, and 60% absolute ethanol), followed by rehydration and staining with carmine alum. Tissues were then dehydrated, cleared with xylene, and mounted.
Show full methods section
To study the effects of collagen density on mammary tumor formation and progression, we utilized a bi-transgenic tumor model with increased stromal collagen in mouse mammary tissue. Imaging of the tumors and tumor-stromal interface in live tumor tissue was performed with multiphoton laser-scanning microscopy to generate multiphoton excitation and spectrally resolved fluorescent lifetimes of endogenous fluorophores. Second harmonic generation was utilized to image stromal collagen.
Methods Mice The University of Wisconsin animal use and care committee approved this study. Breeding pairs of Col1a1 tmJae mice [ 26 ] in the B6/129 background were obtained from Jackson Laboratory. Male FVB Polyomavirus middle-T mice under the control of the mammary specific MMTV promoter were originally obtained from Dr Amy Moser (University of Wisconsin) and are abbreviated PyVT following the Jackson Laboratory (from which they originated) nomenclature, but are also commonly abbreviated as PyMT or PyV MT. Col1a1 tmJae homozygote males were crossed to C57BL/6 females to generate heterozygous females that were crossed to PyVT males to generate mice with normal and collagen-dense mammary tissues carrying the polyoma transgene. Mice were palpated every 2 to 3 days starting at 8 weeks of age to identify tumors. Genotyping by polymerase chain reaction (PCR) was performed on DNA extracted from tail biopsies (Wizard SV Genomic DNA Purification System, Promega, Madison, WI) using primers indicated in the strain information provided by The Jackson Laboratory. Mice were examined for palpable tumors starting at eight weeks of age and humanely killed at 15 weeks or when the tumor burden became excessive. Histology and mammary gland whole mounts Selected mammary tissues and tumors were fixed in 4% paraformaldehyde in phosphate buffered saline (PBS) and then embedded in paraffin. In addition, all tissues imaged with multiphoton microscopy were subsequently fixed and processed for histology. Tissue sections were stained with hematoxylin and eosin (H&E) with adjacent sections stained with the selective collagen stain, picrosirius red. Mammary whole mounts were prepared by fixing tissues in Carnoy's solution (10% glacial acetic acid, 30% chloroform, and 60% absolute ethanol), followed by rehydration and staining with carmine alum. Tissues were then dehydrated, cleared with xylene, and mounted.
Immunofluorescence
Immunofluorescent staining of mammary epithelial cells was performed in a manner similar to the methodology described by Wozniak and co-workers [ 25 ]. Briefly, collagen gels were fixed in 4% paraformaldehyde for 20 minutes at room temperature. Following three washes in PBS, paraformaldehyde fluorescence was quenched with 0.15 M glycine in PBS then the gels were washed with PBS. Triton-X (0.2%) was added to permeabalize the cells, and gels blocked overnight with 2.5% fatty acid-free bovine serum albumin (BSA) + 1% donkey serum. Cell proliferation was then examined by staining with the anti-Ki-67 (mouse clone 7B11; Zymed) primary antibody in PBS containing 1% donkey serum for 30 minutes at room temperature. Following five 10-minute washes in PBS, gels were incubated with anti-mouse tetramethylrhodamine isothiocyanate (TRITC; Jackson ImmunoResearch Laboratories) secondary antibody, phalloidin-fluorescein isothiocyanate (FITC; Jackson ImmunoResearch Laboratories), and bisbenzimide (Sigma-Aldrich) in PBS containing 1% donkey serum for 30 minutes at room temperature. Gels were again washed with PBS and mounted with Prolong Antifade mounting media (Molecular Probes). Imaging was performed on a TE300 Nikon epifluorescence inverted microscope with acquired z-stacks deconvolved using Slidebook imaging software (Olympus). Lung metastasis Lungs from PyVT/wt ( n = 4) and PyVT/Col1a1 ( n = 4) mice (as well as wt/wt and wt/Col1a1 as negative controls) were harvested at 15 weeks, fixed in formalin, and processed for histology. Sections were cut every 50 μm through the entire tissue and sections stained with H&E. Total lung metastases over all sections were then counted.
Three-dimensional invasion assay
Uniform sized tumor explants were harvested from intact tumors using a tissue biopsy punch (3 mm diameter), rinsed with PBS (containing 100 units penicillin, 100 μg streptomycin, and 0.25 μg/ml amphotericin B), and placed into 2.0 mg/ml collagen gels (BD Biosciences, San Diego, CA) that were neutralized with 2× HEPES buffer. Tumors were maintained in collagen gels floated in Dulbecco's Modified Eagle's Medium (DMEM) containing 5% fetal bovine serum (FBS), penicillin (100 units), streptomycin (100 μg), and amphotericin B (0.25 μg/ml) for 10 days over which time the number of distant multicellular colonies were counted.
Isolation of tumor cells and migration assay
Tumors from PyVT/wt and PyVT/Col1a1 backgrounds were minced and digested with 2 mg/ml collagenase and 10 μg/ml hyaluronidase in DMEM containing penicillin (100 units), streptomycin (100 μg), and amphotericin B (0.25 μg/ml). Following gentle shaking at 37°C for 3 hours, cells were pelleted, washed, and plated in DMEM containing 5% FBS. Thirty-six hours post-harvest the tumor cells were transferred to Transwell plates (Corning Inc, Corning, NY) using serum and soluble collagen containing media as the chemoattractant.
Multiphoton laser-scanning microscopy
For live tissue imaging by multiphoton excitation (MPE) and second harmonic generation (SHG), mammary tumors were harvested and live tissue maintained in buffered media at 37°C. All tissues were imaged immediately following tissue harvest using an Optical Workstation [ 27 ] that was constructed around a Nikon Eclipse TE300. A Tsunami Ti:sapphire laser driven by a Millenia 5 W pump laser (Spectra Physics, Mountain View, CA) excitation source producing around 100 fs pulse widths and tuned to 890 nm was utilized to generate both MPE and SHG. The beam was focused onto the sample with a Nikon 60X Plan Apo water-immersion lens (numerical aperture (NA) = 1.2). All SHG imaging was detected from the back-scattered SHG signal [ 28 ], and the presence of collagen confirmed in our tissues using fluorescence lifetime imaging microscopy (FLIM) on the same optical workstation, since the SHG from collagen has no lifetime. Furthermore, owing to the fundamentally different physical behavior of MPE and SHG, signals could be discriminated by filtering the emission signal. We used a 464 nm (cut-on) long pass filter to isolate the emission from autofluorescence from the conserved 445 nm SHG emission. A 445 nm (narrow-band pass) filter was therefore used to isolate the SHG emission. Acquisition was performed with WiscScan [ 29 ] a software acquisition package developed at LOCI (Laboratory for Optical and Computational Instrumentation, University of Wisconsin, Madison, WI) and image analysis for MPE/SHG was performed with ImageJ and VisBio [ 30 ] software. For TACS-1 image analysis, additional surface rendering plug-ins for ImageJ were utilized [ 31 ]. For TACS-2 and -3, ImageJ was used to quantify the collagen fiber angle relative to the tumor. The tumor boundary was defined and the angle relative to the tangent of tumor boundary was measured every 10 μm as reported previously [ 27 ].
Fluorescence and spectral lifetime imaging microscopy
FLIM was performed on live tissue with the optical workstation described above and as described previously [ 27 ]. Briefly, the Ti:sapphire laser (Millennium/Tsunami, Spectra-Physics, Mountain View, CA) was tuned to 890 nm with the beam focused onto the sample with a Nikon 60X Plan Apo water-immersion lens (NA = 1.2). Intensity and FLIM data were collected by a H7422 GaAsP photon-counting photomultiplier tube (PMT; Hamamatsu, Bridgewater, NJ) connected to a time-correlated single photon counting (TCSPC) system (SPC-730, Becker & Hickl, Berlin, Germany).
Multiphoton spectral lifetime imaging microscopy
(SLIM) was performed using a second-generation system that evolved from a previously described instrument [ 32 ] built around an inverted microscope (Eclipse TE2000, Nikon, Melville, NY). Briefly, a Mira Ti:sapphire mode-locking laser driven by a Verdi 8 W laser (Coherent Mira, Coherent, Santa Clara, CA) was used to generate pulse widths of approximately 120 fs at a repetition rate of 76 MHz. Intensity and fluorescence lifetime data were collected over 16 individual 10 nm spectral-width channels using a 16-anode photon counting linear PMT array (PML-16, Becker & Hickl) connected to a TCSPC system (SPC-830, Becker&Hickl). Fluorescent lifetime analysis from FLIM and SLIM was carried out with SPCImage (Becker & Hickl) as well as with a LOCI created computational tool, SlimPlotter [ 33 ], which allows visualization and analysis of the lifetimes by spectral channel.
Statistical analysis
For multi-group comparisons, one-way analysis of variance (ANOVA) with a post-hoc Tukey-Kramer test was used. We performed t -testing for two-group comparisons.
Supplementary Material Additional file 1 The multiphoton spectral lifetime imaging microscopy (SLIM) analysis of live tumors.
Multiphoton fluorescence lifetime imaging microscopy
(FLIM) demonstrates the measurable fluorescence lifetimes of live tumor cells as shown in Figures 6 and 7 . Using SLIM, the fluorescence lifetimes following 890 nm two-photon excitation of live three-dimensional tumors are measured within a defined spectra, allowing identification of the emitting fluorophore and noise removal from adjacent spectra. For instance, examination of the 440–450 nm emission spectra from SLIM confirms the presence of collagen bounding tumor cells. For an 890 nm two-photon excitation the second harmonic generation (SHG) signal is maximal at 445 nm and has no lifetime (dark blue). In addition, the maximal emission signal from tumor cells is 535 nm as shown in Figure 6a , indicating the emission results from excitation of the endogenous fluorophore flavin adenine dinucleotide (FAD). Color bar 0 to 1 ns. Click here for file
📊 Figures
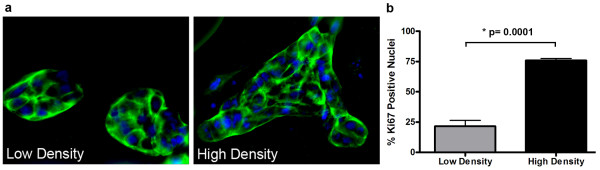
Figure 1
Increased collagen matrix density directly promotes epithelial cell proliferation . (a) Actin staining to visualize MCF10A human mammary epithelial cells cultured within low (1.3 mg/ml) and high-densi...
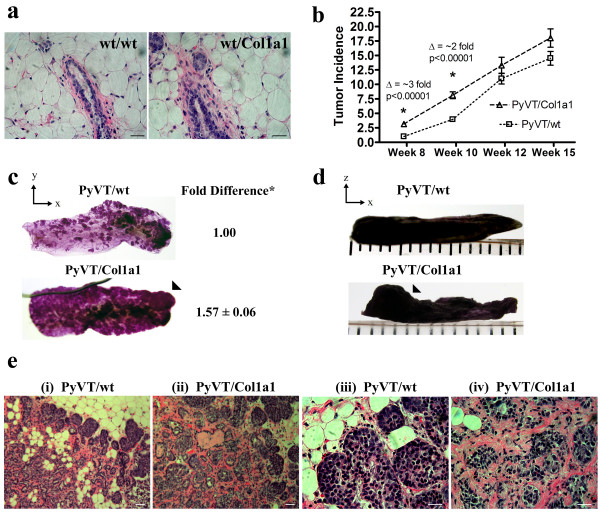
Figure 2
High mammary collagen density promotes tumor formation . (a) Histology of mammary glands from 10-week-old wild-type and heterozygous Col1a1 tmJae mice showing increased stromal collagen and hypercellu...
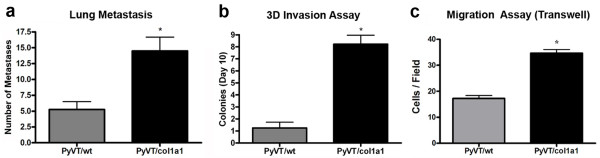
Figure 3
Increased metastasis associated with dense stromal collagen . (a) Increased number of lung metastases per lung at 15 weeks in mice that formed tumors in collagen-dense mammary glands (PyVT/Col1a1) whe...
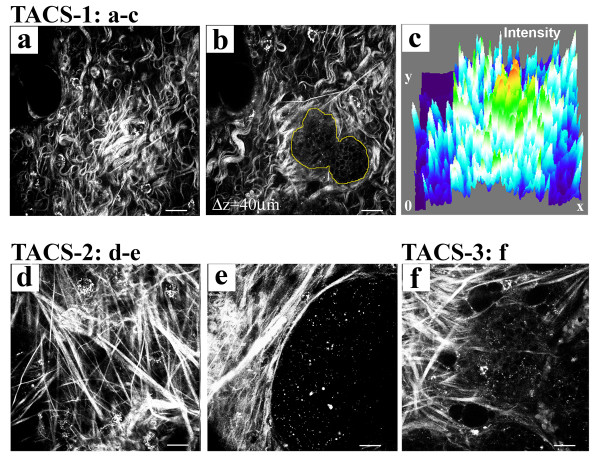
Figure 4
Tumor-associated collagen signatures . (a)-(c) Example of TACS-1. A region of locally dense collagen (a) near (40 u03bcm 'above') a small tumor region (b) that is within the globally increased collage...
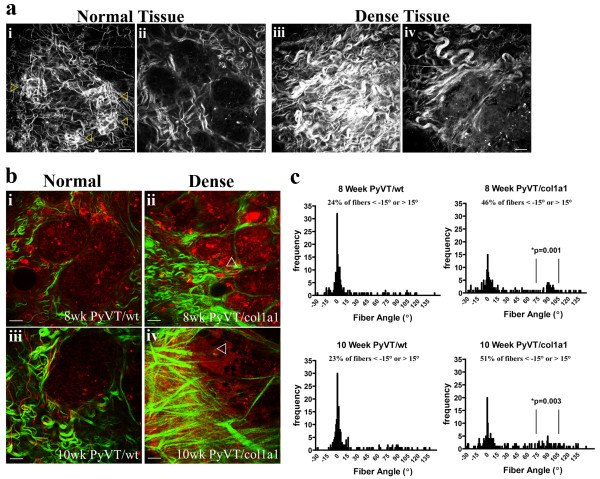
Figure 5
Increased progression of tumor-associated collagen signatures and increased local invasion with high collagen density . (a) TACS-1 in 8-week-old normal (wild-type; ( i ), ( ii )) and collagen-dense (c...
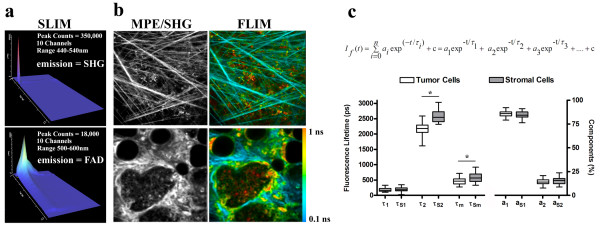
Figure 6
FLIM an SLIM analysis of mammary tumors . (a) Multiphoton spectral lifetime imaging microscopy (SLIM) analysis of the emission spectrum from endogenous fluorescence resulting from excitation at 890 nm...
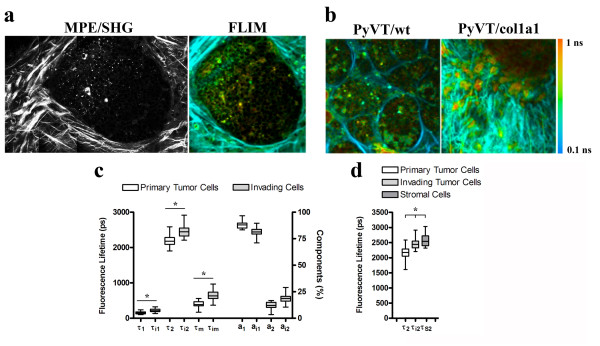
Figure 7
Fluorescence lifetime imaging microscopy analysis of invading tumor cells . (a) Intensity and fluorescence lifetime imaging microscopy (FLIM) images of cells away from and near invasive TACS-3 regions...
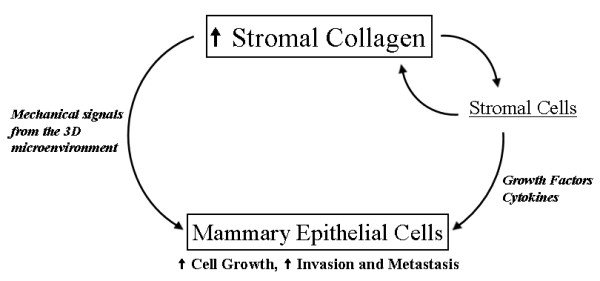
Figure 8
Model for advancement of mammary epithelial tumors by increased stromal collagen . Increased fibrillar collagen in the mammary stroma directly regulates the three-dimensional mechanical microenvironme...
Figure images are served from the NIH/NLM PubMed Central Open Access Subset or Europe PMC; copyright remains with the publishers and authors.
💬 Discussion
0 commentsNo comments yet. Be the first to start a discussion!
Leave a Comment