Abstract
Substrate-binding proteins (SBPs) are associated with ATP-binding cassette importers and switch from an open to a closed conformation upon substrate binding, providing specificity for transport. We investigated the effect of substrates on the conformational dynamics of six SBPs and the impact on transport. Using single-molecule FRET, we reveal an unrecognized diversity of plasticity in SBPs. We show that a unique closed SBP conformation does not exist for transported substrates. Instead, SBPs sample a range of conformations that activate transport. Certain non-transported ligands leave the structure largely unaltered or trigger a conformation distinct from that of transported substrates. Intriguingly, in some cases, similar SBP conformations are formed by both transported and non-transported ligands. In this case, the inability for transport arises from slow opening of the SBP or the selectivity provided by the translocator. Our results reveal the complex interplay between ligand-SBP interactions, SBP conformational dynamics and substrate transport.
🔬 Techniques
🧬 Organisms
✨ Fluorophores
🧪 Sample Preparation
🔬 Cell Lines
🏭 Microscope Brands
🧪 Reagent Suppliers
🔴 Lasers
🔎 Objectives
💻 Software Details
💾 Data Repositories
🏷️ Research Resource Identifiers (RRIDs)
Verified research resources used in this paper:
🏛️ Research Organizations (ROR)
Affiliated research institutions:
📋 Methods
Key resources table
Reagent type (species) or resource Designation Source or reference Identifiers Additional information Gene( Escherichia coli ) MalE NA UniProt: P0AEX9 Antibody Mouse anti-his Qiagen RRID: AB_2714179 (1:200) Strain, strain background ( Streptococcus pneumoniae ) D39 National Collection of Type Cultures NCTC:7466 Capsular serotype 2 Strain, strain background ( Streptococcus pneumoniae ) D39 ∆psaA This paper Replacement of psaA with the Janus cassette ( ∆psaA :: Janus ) Strain, strain background ( Streptococcus pneumoniae ) D39 ∆czcD This paper Replacement of czcD with the Janus cassette ( ∆czcD :: Janus ) Strain, strain background ( Streptococcus pneumoniae ) D39 Ω psaA D280N This paper Replacement of ∆psaA :: Janus with psaA D280N ( ∆psaA :: psaA D280N ) Strain, strain background ( Streptococcus pneumoniae ) D39 Ω psaA D280N ∆czcD This paper Replacement of ∆psaA :: Janus with psaA D280N; replacement of czcD with the Janus cassette ( ∆psaA :: psaA D280N ∆czcD :: Janus ) Strain, strain background ( Lactococcus lactis ) NZ9000 NIZO food research Strain, strain background ( Lactococcus lactis ) GKW9000 DOI: 10.1038/ nsmb2929 Lactococcus lactis NZ9000 with glnPQ gene deleted Strain, strain background ( Escherichia coli ) K12 Other Provided by Tassos Economou, KU Leuven Strain, strain background ( Escherichia coli ) BL 21 DE3 Other Provided by Tassos Economou, KU Leuven Recombinant DNA reagent pET20b Merck Cat#:69739–3 Recombinant DNA reagent pNZglnPQhis DOI: 10.1047/ jbc.M500522200 Expression plasmid for GlnPQ Recombinant DNA reagent SBD1-T159C/G87C DOI: 10.1038/ nsmb2929 Expression plasmid for SBD1(T159C/G87C) Recombinant DNA reagent SBD2-T369C/S451C DOI: 10.1038/ nsmb2929 Expression plasmid for SBD2(T369C/S451C) Recombinant DNA reagent pCAMcLIC01-PsaA DOI: 10.1038/ nchembio.1382 Expression plasmid for PsaA Recombinant DNA reagent pCAMcLIC01-PsaAD280N DOI: 10.1038/ nchembio.1382 Expression plasmid for PsaA(D280N) Recombinant DNA reagent pNZOpuCHis DOI: 10.1093/ emboj/cdg581 Expression plasmid for OpuAC Recombinant DNA reagent pNZcLIC-OppA DOI: 10.1002/pro.97 Expression plasmid for OppA Recombinant DNA reagent PsaA-V76C/K237C This paper Expression plasmid for PsaA(V76C/K237C) from the pCAMcLIC01-PsaA construct Recombinant DNA reagent PsaA-E74C/K237C This paper Expression plasmid for PsaA(E74C/K237C) from the pCAMcLIC01-PsaA construct Recombinant DNA reagent PsaA-D280N/V76C/K237C This paper Expression plasmid for PsaA(D280N/V76C/K237C) from the pCAMcLIC01-PsaAD280N construct Recombinant DNA reagent MalE-T36C/S352C This paper Progenitors: PCR, E. coli gDNA; pET20b vector Recombinant DNA reagent MalE-T36C/N205C This paper Progenitors: PCR, E. coli gDNA; pET20b vector Recombinant DNA reagent MalE-K34C/ R354C This paper Progenitors: PCR, E. coli gDNA; pET20b vector Recombinant DNA reagent MalE-T36C/S352C/ A96W/I329W This paper Progenitors: PCR, E. coli gDNA; pET20b vector Recombinant DNA reagent OpuAC-V360C/ N423C This paper Expression plasmid for OpuAC(V360C/N423C) from the pNZOpuCHis construct Recombinant DNA reagent OppA-A209C/ S441C This paper Expression plasmid for OppA(A209C/ S441C) from the pNZcLIC-OppA construct Sequence- based reagent Primers Merck see Supplementary File 2 Peptide, recombinant protein RPPGFSPFR Merck Cat#:B3259 peptide sequence: RPPGFSPFR Peptide, recombinant protein RDMPIQAF CASLO ApS peptide sequence: RDMPIQAF Peptide, recombinant protein SLSQSKVLPVPQ CASLO ApS peptide sequence: SLSQSKVLPVPQ Peptide, recombinant protein SLSQSKVLP CASLO ApS peptide sequence: SLSQSKVLP Chemical compound, drug Glycine Betaine Merck Cat#:B3501 Chemical compound, drug Carnitine Merck Cat#:94954 Chemical compound, drug Maltose Merck Cat#:63418 Chemical compound, drug Maltotriose Merck Cat#:851493 Chemical compound, drug Maltotetraose Carbosynth Limited Cat#:OM06979 Chemical compound, drug Maltopentaose Merck Cat#:M8128 Chemical compound, drug Maltohexaose Santa Cruz Biotechnology Cat#:sc-218665 Chemical compound, drug Maltoheptaose Carbosynth Limited Cat#:OM06868 Chemical compound, drug Maltodecaose Carbosynth Limited Cat#: OM146832 Chemical compound, drug Maltooctaose Carbosynth Limited Cat#:OM06941 Chemical compound, drug Beta Cyclodextrin Merck Cat#:C4767 Chemical compound, drug Maltotetroitol Carbosynth Limited Cat#:OM02796 Chemical compound, drug Maltotriitol Merck Cat#:M4295 Chemical compound, drug 3 H-Asparagine American Radiolabeled Chemicals Cat#:ART 0500–250 µCi Chemical compound, drug 14 C-Glutamine PerkinEllmer Cat#:NEC451050UC Chemical compound, drug 14 C-Histidine PerkinEllmer Cat#:NEC277E050UC Chemical compound, drug 14 C-Arginine Moravek Cat#:MC 137 Chemical compound, drug 3 H-Lysine PerkinEllmer Cat#:NET376250UC Chemical compound, drug Alexa555 Thermo Fisher Scientific Cat#:A20346 Chemical compound, drug Alexa647 Thermo Fisher Scientific Cat#:A20347 Chemical compound, drug Cy3B GE Healthcare Cat#:PA63131 Chemical compound, drug ATTO647N ATTO-TECH Cat#:AD 647 N-45 Software, algorithm Dual-Channel- Burst-Search DOI: 10.1021/ jp063483n Software, algorithm LabView data acquisition DOI: 10.1371/journal. pone.0175766 Provided by Shimon Weiss, UCLA Software, algorithm Hidden Markov Model DOI: 10.1109/ 5.18626 Software, algorithm Origin OriginLab RRID: SCR_002815 Software, algorithm MATLAB MathWorks RRID: SCR_001622 Gene expression and SBP purification N-terminal extension of the soluble SBPs with a His x tag (His 10 PsaA, His 10 SBD1, His 10 SBD2, His 10 OppA and His 6 OpuAC) were expressed and purified as previously described ( Gouridis et al., 2015 ; Wolters et al., 2010 ; Doeven et al., 2004 ; Couñago et al., 2014 ). Protein derivatives having the cysteine point mutations were constructed using QuickChange mutagenesis ( Bok and Keller, 2012 ) or Megaprimer PCR mutagenesis ( Vander Kooi, 2013 ) protocols. Primers are indicated in Supplementary file 2 and all sequences were by sequencing. OppA, OpuAC, PsaA and PsaA(D280N) derivatives were constructed using as templates vectors pNZcLIC-OppA ( Berntsson et al., 2009 ), pNZOpuCHis ( Biemans-Oldehinkel and Poolman, 2003 ), pCAMcLIC01-PsaA ( Couñago et al., 2014 ) and pCAMcLIC01-PsaAD280N ( Couñago et al., 2014 ), respectively. Construction of SBD1 and SBD2 cysteine derivatives was accomplished as described previously ( Gouridis et al., 2015 ). The mal E gene (UniProt: P0AEX9 ) was isolated from the genome of Escherichia coli K12. The primers were designed to exclude the signal peptide (amino acids 1–26). Primers introduced Nde I and Hind III restriction sites, and the gene product was sub-cloned in the pET20b vector (Merck). MalE derivatives having the cysteine or other point mutations were constructed using QuickChange mutagenesis ( Bok and Keller, 2012 ) and Megaprimer PCR mutagenesis ( Vander Kooi, 2013 ) protocols. Primers are indicated in Supplementary file 2 and all sequences were verified by sequencing. His 6 MalE was over-expressed in E. coli BL21 DE3 cells ( F–ompT gal dcm lon hsdSB ( r B –m B ) λ(DE3 [ lacI lacUV5-T7p07 ind1 sam7 nin5 ]) [malB+]K-12(λS)). Cells harbouring plasmids expressing the MalE wild-type and derivatives were grown at 30°C until an optical density (OD 600 ) of 0.5 was reached. Protein expression was then induced by addition of 0.25 mM isopropyl β-D-1-thiogalactopyranoside (IPTG). After 2 hr induction cells were harvested. DNase 500 ug/ml (Merck) was added and passed twice through a French pressure cell at 1,500 psi and 2 mM phenylmethylsulfonyl fluoride (PMSF) was added to inhibit proteases. The soluble supernatant was isolated by centrifugation at 50,000 × g for 30 min at 4°C. The soluble material was then purified and loaded on Ni 2+ -sepharose resin (GE Healthcare) in 50 mM Tris-HCl, pH 8.0, 1 M KCl, 10% glycerol, 10 mM imidazole and 1 mM dithiothreitol (DTT; Sigma-Aldrich). The immobilized proteins were washed (50 mM Tris-HCl, pH 8.0, 50 mM KCl, 10% glycerol, 10 mM imidazole and 1 mM DTT plus 50 mM Tris-HCl, pH 8.0, 1 M KCl, 10% glycerol, 30 mM imidazole and 1 mM DTT sequentially) and then eluted (50 mM Tris-HCl, pH 8.0, 50 mM KCl, 10% glycerol, 300 mM imidazole and 1 mM DTT). Protein fractions were pooled (supplemented with 5 mM EDTA and 10 mM DTT), concentrated (10.000 MWCO Amicon; Merck-Millipore), dialyzed against 100–1000 volumes of buffer (50 mM Tris-HCl, pH 8.0, 50 mM KCl, 50% glycerol and 10 mM DTT), aliquoted and stored at −20°C until required.
Show full methods section
Key resources table
Reagent type (species) or resource Designation Source or reference Identifiers Additional information Gene( Escherichia coli ) MalE NA UniProt: P0AEX9 Antibody Mouse anti-his Qiagen RRID: AB_2714179 (1:200) Strain, strain background ( Streptococcus pneumoniae ) D39 National Collection of Type Cultures NCTC:7466 Capsular serotype 2 Strain, strain background ( Streptococcus pneumoniae ) D39 ∆psaA This paper Replacement of psaA with the Janus cassette ( ∆psaA :: Janus ) Strain, strain background ( Streptococcus pneumoniae ) D39 ∆czcD This paper Replacement of czcD with the Janus cassette ( ∆czcD :: Janus ) Strain, strain background ( Streptococcus pneumoniae ) D39 Ω psaA D280N This paper Replacement of ∆psaA :: Janus with psaA D280N ( ∆psaA :: psaA D280N ) Strain, strain background ( Streptococcus pneumoniae ) D39 Ω psaA D280N ∆czcD This paper Replacement of ∆psaA :: Janus with psaA D280N; replacement of czcD with the Janus cassette ( ∆psaA :: psaA D280N ∆czcD :: Janus ) Strain, strain background ( Lactococcus lactis ) NZ9000 NIZO food research Strain, strain background ( Lactococcus lactis ) GKW9000 DOI: 10.1038/ nsmb2929 Lactococcus lactis NZ9000 with glnPQ gene deleted Strain, strain background ( Escherichia coli ) K12 Other Provided by Tassos Economou, KU Leuven Strain, strain background ( Escherichia coli ) BL 21 DE3 Other Provided by Tassos Economou, KU Leuven Recombinant DNA reagent pET20b Merck Cat#:69739–3 Recombinant DNA reagent pNZglnPQhis DOI: 10.1047/ jbc.M500522200 Expression plasmid for GlnPQ Recombinant DNA reagent SBD1-T159C/G87C DOI: 10.1038/ nsmb2929 Expression plasmid for SBD1(T159C/G87C) Recombinant DNA reagent SBD2-T369C/S451C DOI: 10.1038/ nsmb2929 Expression plasmid for SBD2(T369C/S451C) Recombinant DNA reagent pCAMcLIC01-PsaA DOI: 10.1038/ nchembio.1382 Expression plasmid for PsaA Recombinant DNA reagent pCAMcLIC01-PsaAD280N DOI: 10.1038/ nchembio.1382 Expression plasmid for PsaA(D280N) Recombinant DNA reagent pNZOpuCHis DOI: 10.1093/ emboj/cdg581 Expression plasmid for OpuAC Recombinant DNA reagent pNZcLIC-OppA DOI: 10.1002/pro.97 Expression plasmid for OppA Recombinant DNA reagent PsaA-V76C/K237C This paper Expression plasmid for PsaA(V76C/K237C) from the pCAMcLIC01-PsaA construct Recombinant DNA reagent PsaA-E74C/K237C This paper Expression plasmid for PsaA(E74C/K237C) from the pCAMcLIC01-PsaA construct Recombinant DNA reagent PsaA-D280N/V76C/K237C This paper Expression plasmid for PsaA(D280N/V76C/K237C) from the pCAMcLIC01-PsaAD280N construct Recombinant DNA reagent MalE-T36C/S352C This paper Progenitors: PCR, E. coli gDNA; pET20b vector Recombinant DNA reagent MalE-T36C/N205C This paper Progenitors: PCR, E. coli gDNA; pET20b vector Recombinant DNA reagent MalE-K34C/ R354C This paper Progenitors: PCR, E. coli gDNA; pET20b vector Recombinant DNA reagent MalE-T36C/S352C/ A96W/I329W This paper Progenitors: PCR, E. coli gDNA; pET20b vector Recombinant DNA reagent OpuAC-V360C/ N423C This paper Expression plasmid for OpuAC(V360C/N423C) from the pNZOpuCHis construct Recombinant DNA reagent OppA-A209C/ S441C This paper Expression plasmid for OppA(A209C/ S441C) from the pNZcLIC-OppA construct Sequence- based reagent Primers Merck see Supplementary File 2 Peptide, recombinant protein RPPGFSPFR Merck Cat#:B3259 peptide sequence: RPPGFSPFR Peptide, recombinant protein RDMPIQAF CASLO ApS peptide sequence: RDMPIQAF Peptide, recombinant protein SLSQSKVLPVPQ CASLO ApS peptide sequence: SLSQSKVLPVPQ Peptide, recombinant protein SLSQSKVLP CASLO ApS peptide sequence: SLSQSKVLP Chemical compound, drug Glycine Betaine Merck Cat#:B3501 Chemical compound, drug Carnitine Merck Cat#:94954 Chemical compound, drug Maltose Merck Cat#:63418 Chemical compound, drug Maltotriose Merck Cat#:851493 Chemical compound, drug Maltotetraose Carbosynth Limited Cat#:OM06979 Chemical compound, drug Maltopentaose Merck Cat#:M8128 Chemical compound, drug Maltohexaose Santa Cruz Biotechnology Cat#:sc-218665 Chemical compound, drug Maltoheptaose Carbosynth Limited Cat#:OM06868 Chemical compound, drug Maltodecaose Carbosynth Limited Cat#: OM146832 Chemical compound, drug Maltooctaose Carbosynth Limited Cat#:OM06941 Chemical compound, drug Beta Cyclodextrin Merck Cat#:C4767 Chemical compound, drug Maltotetroitol Carbosynth Limited Cat#:OM02796 Chemical compound, drug Maltotriitol Merck Cat#:M4295 Chemical compound, drug 3 H-Asparagine American Radiolabeled Chemicals Cat#:ART 0500–250 µCi Chemical compound, drug 14 C-Glutamine PerkinEllmer Cat#:NEC451050UC Chemical compound, drug 14 C-Histidine PerkinEllmer Cat#:NEC277E050UC Chemical compound, drug 14 C-Arginine Moravek Cat#:MC 137 Chemical compound, drug 3 H-Lysine PerkinEllmer Cat#:NET376250UC Chemical compound, drug Alexa555 Thermo Fisher Scientific Cat#:A20346 Chemical compound, drug Alexa647 Thermo Fisher Scientific Cat#:A20347 Chemical compound, drug Cy3B GE Healthcare Cat#:PA63131 Chemical compound, drug ATTO647N ATTO-TECH Cat#:AD 647 N-45 Software, algorithm Dual-Channel- Burst-Search DOI: 10.1021/ jp063483n Software, algorithm LabView data acquisition DOI: 10.1371/journal. pone.0175766 Provided by Shimon Weiss, UCLA Software, algorithm Hidden Markov Model DOI: 10.1109/ 5.18626 Software, algorithm Origin OriginLab RRID: SCR_002815 Software, algorithm MATLAB MathWorks RRID: SCR_001622 Gene expression and SBP purification N-terminal extension of the soluble SBPs with a His x tag (His 10 PsaA, His 10 SBD1, His 10 SBD2, His 10 OppA and His 6 OpuAC) were expressed and purified as previously described ( Gouridis et al., 2015 ; Wolters et al., 2010 ; Doeven et al., 2004 ; Couñago et al., 2014 ). Protein derivatives having the cysteine point mutations were constructed using QuickChange mutagenesis ( Bok and Keller, 2012 ) or Megaprimer PCR mutagenesis ( Vander Kooi, 2013 ) protocols. Primers are indicated in Supplementary file 2 and all sequences were by sequencing. OppA, OpuAC, PsaA and PsaA(D280N) derivatives were constructed using as templates vectors pNZcLIC-OppA ( Berntsson et al., 2009 ), pNZOpuCHis ( Biemans-Oldehinkel and Poolman, 2003 ), pCAMcLIC01-PsaA ( Couñago et al., 2014 ) and pCAMcLIC01-PsaAD280N ( Couñago et al., 2014 ), respectively. Construction of SBD1 and SBD2 cysteine derivatives was accomplished as described previously ( Gouridis et al., 2015 ). The mal E gene (UniProt: P0AEX9 ) was isolated from the genome of Escherichia coli K12. The primers were designed to exclude the signal peptide (amino acids 1–26). Primers introduced Nde I and Hind III restriction sites, and the gene product was sub-cloned in the pET20b vector (Merck). MalE derivatives having the cysteine or other point mutations were constructed using QuickChange mutagenesis ( Bok and Keller, 2012 ) and Megaprimer PCR mutagenesis ( Vander Kooi, 2013 ) protocols. Primers are indicated in Supplementary file 2 and all sequences were verified by sequencing. His 6 MalE was over-expressed in E. coli BL21 DE3 cells ( F–ompT gal dcm lon hsdSB ( r B –m B ) λ(DE3 [ lacI lacUV5-T7p07 ind1 sam7 nin5 ]) [malB+]K-12(λS)). Cells harbouring plasmids expressing the MalE wild-type and derivatives were grown at 30°C until an optical density (OD 600 ) of 0.5 was reached. Protein expression was then induced by addition of 0.25 mM isopropyl β-D-1-thiogalactopyranoside (IPTG). After 2 hr induction cells were harvested. DNase 500 ug/ml (Merck) was added and passed twice through a French pressure cell at 1,500 psi and 2 mM phenylmethylsulfonyl fluoride (PMSF) was added to inhibit proteases. The soluble supernatant was isolated by centrifugation at 50,000 × g for 30 min at 4°C. The soluble material was then purified and loaded on Ni 2+ -sepharose resin (GE Healthcare) in 50 mM Tris-HCl, pH 8.0, 1 M KCl, 10% glycerol, 10 mM imidazole and 1 mM dithiothreitol (DTT; Sigma-Aldrich). The immobilized proteins were washed (50 mM Tris-HCl, pH 8.0, 50 mM KCl, 10% glycerol, 10 mM imidazole and 1 mM DTT plus 50 mM Tris-HCl, pH 8.0, 1 M KCl, 10% glycerol, 30 mM imidazole and 1 mM DTT sequentially) and then eluted (50 mM Tris-HCl, pH 8.0, 50 mM KCl, 10% glycerol, 300 mM imidazole and 1 mM DTT). Protein fractions were pooled (supplemented with 5 mM EDTA and 10 mM DTT), concentrated (10.000 MWCO Amicon; Merck-Millipore), dialyzed against 100–1000 volumes of buffer (50 mM Tris-HCl, pH 8.0, 50 mM KCl, 50% glycerol and 10 mM DTT), aliquoted and stored at −20°C until required.
Uptake experiments in whole cells
Lactococcus lactis GKW9000 carrying pNZglnPQhis ( Schuurman-Wolters and Poolman, 2005 ) was cultivated semi-anaerobically at 30°C in M17 (Oxoid) medium supplemented with 1% (w/v) glucose and 5 μg/ml chloramphenicol. For uptake experiments cells were grown in GM17 to an OD 600 of 0.4, induced for 1 hr with 0.01% of culture supernatant of the nisin A-producing strain NZ9700 and harvested by centrifugation for 10 min at 4000 x g ; the final nisin A concentration is ~1 ng/ml. After washing twice with 10 mM PIPES-KOH, 80 mM KCl, pH 6.0, the cells were resuspended to OD 600 = 50 in the same buffer. Uptake experiments were performed at 0.1–0.5 mg/ml total protein in 30 mM PIPES-KOH, 30 mM MES-KOH, 30 mM HEPES-KOH (pH 6.0). Before starting the transport assays, the cells were equilibrated and energized at 30°C for 3 min in the presence of 10 mM glucose plus 5 mM MgCl 2 . After 3 min, the uptake reaction was started by addition of either [ 14 C]-glutamine, [ 14 C]-histidine, [ 14 C]-lysine (all from PerkinElmer), [ 14 C]-arginine (Moravek) or [ 3 H]-asparagine (ARC); the specific radioactivity was adjusted for each experiment (amino-acid concentration) to obtain sufficient signal above background; the final amino acid concentrations are indicated in the figure legends. At given time intervals, samples were taken and diluted into 2 ml ice-cold 100 mM LiCl. The samples were rapidly filtered through 0.45 µm pore-size cellulose nitrate filters (Amersham) and the filter was washed once with ice-cold 100 mM LiCl. The radioactivity on the filters was determined by liquid scintillation counting. Purification and membrane reconstitution of GlnPQ for in vitro transport assays Membrane vesicles of Lactococcus lactis GKW9000 carrying pNZglnPQhis ( Schuurman-Wolters and Poolman, 2005 ) were prepared as described before ( Lycklama A Nijeholt et al., 2018 ). For reconstitution into proteoliposomes, 150 mg of total protein in membrane vesicles was solubilized in 50 mM potassium phosphate pH 8.0, 200 mM NaCl, 20% glycerol and 0.5% (w/v) DDM for 30 min at 4°C. The sample was centrifuged (12 min, 300,000 xg ) and the supernatant was collected. Subsequently, GlnPQ was allowed to bind to Ni-Sepharose (1.5 ml bed volume) for 1 hr at 4°C after addition of 10 mM imidazole. The resin was rinsed with 20 column volumes of wash buffer (50 mM potassium phosphate, pH 8.0, 200 mM NaCl, 20% (v/v) glycerol, 50 mM imidazole and 0.02% (w/v) DDM). The protein was eluted with five column volumes of elution buffer (50 mM potassium phosphate, pH 8.0, 200 mM NaCl, 10% (w/v) glycerol, 500 mM imidazole plus 0.02% (w/v) DDM). The purified GlnPQ was used for reconstitution into liposomes composed of egg yolk L-α-phosphatidylcholine and purified E. coli lipids (Avanti polar lipids) in a 1:3 ratio (w/w) as described before ( Geertsma et al., 2008 ) with a final protein/lipid ratio of 1:100 (w/w). An ATP regenerating system, consisting of 50 mM potassium phosphate, pH 7.0, creatine kinase (2.4 mg/ml), Na 2 -ATP (10 mM), MgSO 4 (10 mM), and Na 2 -creatine-phosphate (24 mM) was enclosed in the proteoliposomes by two freeze/thaw cycles, after which the vesicles were stored at −80°C. On the day of the uptake experiment, the proteoliposomes were extruded 13 times through a polycarbonate filter (200 nm pore size), diluted to 3 ml with 100 mM potassium phosphate, pH 7.0, centrifuged (265,000 g for 20 min), and then washed and resuspended in 100 mM potassium phosphate, pH 7.0, to a concentration of 50 mg of lipid/ml. Uptake in proteoliposomes was measured in 100 mM potassium phosphate, pH 7.0, supplemented with 5 µM of [ 14 C]-glutamine or [ 3 H]-asparagine. This medium, supplemented with or without unlabeled amino acids (asparagine, arginine, glutamine, histidine or lysine), was incubated at 30°C for 2 min prior to adding proteoliposomes (kept on ice) to a final concentration of 1–5 mg of lipid/ml. At given time intervals, 40 µl samples were taken and diluted with 2 ml of ice-cold isotonic buffer (100 mM potassium phosphate, pH 7.0). The samples were collected on 0.45 m pore size cellulose nitrate filters and washed twice as described above. After addition of 2 ml Ultima Gold scintillation liquid (PerkinElmer), radioactivity was measured on a Tri-Carb 2800TR (PerkinElmer). A single time-dependent uptake experiment is shown in Figure 4A–C and consistent results were obtained upon repetition with an independent sample preparation. Zinc accumulation in whole cells The S. pneumoniae D39 mutant strains Ω psaA D280N and ∆ czcD were constructed using the Janus cassette system ( Sung et al., 2001 ). Briefly, the upstream and downstream flanking regions of psaA and czcD were amplified using primers ( Supplementary file 2 ) with complementarity to either psaA D280N (Ω psaA D280N ), generated via site-directed mutagenesis of psaA following manufacturer instructions (Agilent), or the Janus cassette (∆ czcD ) and were joined by overlap extension PCR. These linear fragments were used to replace by homologous recombination psaA and czcD, respectively, in the chromosome of wild-type and ∆ czcD strains. For metal accumulation analyses, S. pneumoniae strains were grown in a cation-defined semi-synthetic medium (CDM) with casein hydrolysate and 0.5% yeast extract, as described previously ( Plumptre et al., 2014 ). Whole cell metal ion accumulation was determined by inductively coupled plasma-mass spectrometry (ICP-MS) essentially as previously described ( Begg et al., 2015 ). Briefly, S. pneumoniae strains were inoculated into CDM supplemented with 50 μM ZnSO 4 at a starting OD 600 of 0.05 and grown to mid-log phase (OD 600 = 0.3–0.4) at 37°C in the presence of 5% CO 2 . Cells were washed by centrifugation six times in PBS with 5 mM EDTA, harvested, and desiccated at 95°C for 18 hr. Metal ion content was released by treatment with 500 μL of 35% HNO 3 at 95°C for 60 min. Metal content was analysed on an Agilent 8900 QQQ ICP-MS ( Couñago et al., 2014 ). Isothermal titration calorimetry (ITC) Purified OppA was dialyzed overnight against 50 mM Tris-HCl, pH 7.4, 50 mM KCl. ITC experiments were carried by microcalorimetry on a ITC200 calorimeter (MicroCal). The peptide (RPPGFSFR) stock solution (200 μM) was prepared in the dialysis buffer and was stepwise injected (2 μl) into the reaction cell containing 20 μM OppA. All experiments were carried out at 25°C with a mixing rate of 400 rpm. Data were analyzed with a one site-binding model using, provided by the Origin software (OriginLab).
Protein labeling for FRET measurements
Surface-exposed and non-conserved positions were chosen for Cys engineering and subsequent labeling, based on X-ray crystal structures of OpuAC (3L6G, 3L6H), SBD1 (4AL9), SBD2 (4KR5, 4KQP), PsaA (3ZK7, 1PSZ), OppA (3FTO, 3RYA) and MalE (1OMP, 1ANF). Unlabeled protein derivatives (20–40 mg/ml) were stored at −20°C in the appropriate buffer (50 mM Tris-HCl, pH 7.4, 50 mM KCl, 50% glycerol for MalE and OppA. 25 mM Tris-HCl, pH 8.0, 150 mM NaCl, 1 μM EDTA, 50% glycerol for PsaA. 50 mM KPi, pH 7.4, 50 mM KCl, 50% glycerol for OpuAC, SBD1 and SBD2) supplemented with 1 mM DTT. Stochastic labeling was performed with the maleimide derivative of dyes Cy3B (GE Healthcare) and ATTO647N (ATTO-TEC) for OpuAC. MalE, SBD1, SBD2, OppA and PsaA were labeled with Alexa555 and Alexa647 maleimide (ThermoFisher). The purified proteins were first treated with 10 mM DTT for 30 min to reduce oxidized cysteines. After dilution of the protein sample to a DTT concentration of 1 mM the reduced protein were immobilized on a Ni 2+ -Sepharose resin (GE Healthcare) and washed with 10 column volumes of buffer A (50 mM Tris-HCl, pH 7.4, 50 mM KCl for MalE and OppA. 25 mM Tris-HCl, pH 8.0, 150 mM NaCl, 1 μM EDTA for PsaA. 50 mM KPi, pH 7.4, 50 mM KCl for OpuAC, SBD1 and SBD2) to remove the DTT. To make sure that no endogenous ligand was left, for some experiments, and prior to removing the DTT, we unfolded the immobilized-SBPs by treatment with 6 M of urea supplemented with 1 mM DTT and refolded them again by washing with buffer A. The resin was incubated 1–8 hr at 4°C with the dyes dissolved in buffer A. To ensure a high labeling efficiency, the dye concentration was ~20 times higher than the protein concentration. Subsequently, unbound dyes were removed by washing the column with at least 20 column volumes of buffer A. Elution of the proteins was done by supplementing buffer A with 400 mM imidazole. The labeled proteins were further purified by size-exclusion chromatography (Superdex 200, GE Healthcare) using buffer A. Sample composition was assessed by recording the absorbance at 280 nm (protein), 559 nm (donor), and 645 nm (acceptor) to estimate labeling efficiency. For all proteins, the labeling efficiency was >90%. Fluorescence anisotropy To verify that the measurements of apparent FRET efficiency report on inter-probe distances between the donor and acceptor fluorophores, at least one of the fluorophores must be able to rotate freely. To investigate this, we determined the anisotropy values of labeled proteins. The fluorescence intensity was measured on a scanning spectrofluorometer (Jasco FP-8300; 10 nm excitation and emission bandwidth; 8 s integration time) around the emission maxima of the fluorophores (for donor, λ ex = 535 nm and λ em = 580 nm; for acceptor, λ ex = 635 nm and λ em = 660 nm). Anisotropy values r were obtained from on r = ( I V V - G I V H ) / ( I V V + 2 G I V H ) , where I V V and I V H are the fluorescence emission intensities in the vertical and horizontal orientation, respectively, upon excitation along the vertical orientation. The sensitivity of the spectrometer to different polarizations was corrected via the factor G = I H V / I H H , where I H V and I H H are the fluorescence emission intensities in the vertical and horizontal orientation, respectively, upon excitation along the horizontal orientation. G -values were determined to be 1.8-1.9. The anisotropy was measured in buffer A and the labeled proteins and free-fluorophores in a concentration range of 50−500 nM at room temperature. Solution-based smFRET and ALEX Solution-based smFRET and alternating laser excitation (ALEX) ( Kapanidis et al., 2004 ) experiments were carried out at 25–100 pM of labeled protein at room temperature in buffer A supplemented with additional reagents as stated in the text. Microscope cover slides (no. 1.5H precision cover slides, VWR Marienfeld) were coated with 1 mg/mL BSA for 30–60 s to prevent fluorophore and/or protein interactions with the glass material. Excess BSA was subsequently removed by washing and exchange with buffer A. All smFRET experiments were performed using a home-built confocal microscope. In brief, two laser-diodes (Coherent Obis) with emission wavelength of 532 and 637 nm were directly modulated for alternating periods of 50 µs and used for confocal excitation. The laser beams where coupled into a single-mode fiber (PM-S405-XP, Thorlabs) and collimated (MB06, Q-Optics/Linos) before entering a water immersion objective (60X, NA 1.2, UPlanSAPO 60XO, Olympus). The fluorescence was collected by excitation at a depth of 20 µm. Average laser powers were 30 μW at 532 nm (~30 kW/cm 2 ) and 15 μW at 637 nm (~15 kW/cm 2 ). Excitation and emission light was separated by a dichroic beam splitter (zt532/642rpc, AHF Analysentechnik), which is mounted in an inverse microscope body (IX71, Olympus). Emitted light was focused onto a 50 µm pinhole and spectrally separated (640DCXR, AHF Analysentechnik) onto two single-photon avalanche diodes (TAU-SPADs-100, Picoquant) with appropriate spectral filtering (donor channel: HC582/75; acceptor channel: Edge Basic 647LP; AHF Analysentechnik). Registration of photon arrival times and alternation of the lasers was controlled by an NI-Card (PXI-6602, National Instruments) using LabView data acquisition software of the Weiss laboratory ( Ingargiola et al., 2017 ). An individual labeled protein diffusing through the confocal volume generates a burst of photons. To identify fluorescence bursts a dual-channel burst search ( Nir et al., 2006 ) was used with parameters M = 15, T = 500 μs and L = 25. In brief, a fluorescent signal is considered a burst, when a total of L photons having M neighboring photons within a time window of length T centred on their own arrival time. A first burst search was done that includes the donor and acceptor photons detected during the donor excitation, and a second burst search was done including only the acceptor photons detected during the acceptor excitation. The two separate burst searches were combined to define intervals when both donor and acceptor fluorophores are active. These intervals define the bursts. Only bursts having >150 photons were further analysed The three relevant photon streams were analysed (DA, donor-based acceptor emission; DD, donor-based donor emission; AA, acceptor-based acceptor emission) and assignment is based on the excitation period and detection channel ( Kapanidis et al., 2004 ). The apparent FRET efficiency is calculated via F(DA)/[F(DA)+F(DD)] and the Stoichiometry S by [F(DD)+F(DA)]/[(F(DD)+F(DA)+F(AA)], where F(·) denotes the summing over all photons within the burst ( Kapanidis et al., 2004 ). The accurate FRET efficiency E was calculated by correcting the apparent FRET efficiency for background, direct excitation of the acceptor by donor excitation, leakage of donor fluorescence in the acceptor detection channel and relative differences in the efficiencies of the detectors and the quantum yield of the dyes ( Nir et al., 2006 ). Corrections are made using established protocols as described in Lee et al ( Nir et al., 2006 ). From the average E (see below), the mean inter-dye distance R was calculated via E = 1/(1+(R/R 0 ) 6 ), using R 0 of 5.1 nm for Alexa555/Alexa647 and 6.2 nm for Cy3B/Atto647N. Binning the detected bursts into a 2D (apparent) FRET/S histogram allowed the selection of the donor and acceptor labeled molecules and reduce artefacts arising from fluorophore bleaching ( Kapanidis et al., 2004 ). The selected (apparent) FRET histogram were fitted with a Gaussian distribution using nonlinear least square, to obtain a 95% Wald confidence interval for the distribution mean. Statements about the significance of the mean of the FRET distributions are based on a comparison of the appropriate confidence intervals. In addition, a two-way Kolmogorov-Smirnov test was performed, as implemented in Matlab (MathWorks), on the selected burst corresponding to donor and acceptor-labeled proteins.
Scanning confocal microscopy
Confocal scanning experiments were performed at room temperature and using a home-built confocal scanning microscope as described previously ( Husada et al., 2018 ). In brief, surface scanning was performed using a XYZ-piezo stage with 100 × 100 × 20 µm range (P-517–3 CD with E-725.3CDA, Physik Instrumente). The detector signal was registered using a HydraHarp 400 picosecond event timer and a module for time-correlated single photon counting (both Picoquant). Data were recorded with constant 532 nm excitation at an intensity of 0.5 μW (~125 W/cm 2 ) for SBD1, SBD2, PsaA, OppA and MalE, but 1.5 μW (~400 W/cm 2 ) for OpuAC. Scanning images of 10 × 10 µm were recorded with 50 nm step size and 2 ms integration time at each pixel. After each surface scan, the positions of labeled proteins were identified manually; the position information was used to subsequently generate time traces. Surface immobilization was conducted using an anti-HIS antibody and established surface-chemistry protocols as described ( Gouridis et al., 2015 ). A flow-cell arrangement was used as described before ( Gouridis et al., 2015 ; Roy et al., 2008 ) for studies of surface-tethered proteins, except for MalE. MalE was studied on standard functionalized cover-slides since MalE was extremely sensitive to contaminations of maltodextrins in double-sided tape or other flow-cell parts. All experiments of OpuAC and PsaA were carried out in degassed buffer A under oxygen-free conditions obtained utilizing an oxygen-scavenging system supplemented with 10 mM of (±)−6-Hydroxy-2,5,7,8-tetramethylchromane-2-carboxylic acid (Trolox; Merck) ( van der Velde et al., 2016 ). For MalE, SBD1, SBD2 and OppA experiments were carried out in buffer A supplemented with 1 mM Trolox and 10 mM Cysteamine (Merck).
Analysis of fluorescence trajectories
Time-traces were analysed by integrating the detected red and green photon streams in time-bins as stated throughout the text. Only traces lasting longer than 50 time-bins, having on average more than 10 photons per time-bin that showed clear bleaching steps, were used for further analysis. The number of analysed molecules, transitions and the total observation time are indicated in Supplementary file 4 . The apparent FRET per time-bin was calculated by dividing the red photons by the total number of photons per time-bin. The state-trajectory of the FRET time-trace was modelled by a Hidden Markov Model (HMM) ( Rabiner and Lawrence, 1990 ). For this an implementation of HMM was programmed in Matlab (MathWorks), based on the work of Rabiner ( Rabiner and Lawrence, 1990 ). In the analysis, we assumed that the FRET time-trace (the observation sequence) can be considered as a HMM with two states having a one-dimensional Gaussian-output distribution. The Gaussian output-distribution of state i ( i =1, 2) is parameterized by its mean and variance. The parameters λ (transition probabilities that connect the states and parameters of output-distribution), given the observation sequence, was found by maximizing the likelihood function. This was iteratively done using the Baum-Welch algorithm ( Baum and Petrie, 1966 ). Care was taken to avoid floating point underflow and was done as described ( Rabiner and Lawrence, 1990 ). With the inferred parameters λ , the most probable state-trajectory is then found using the Viterbi algorithm ( Viterbi, 1967 ). The time spent in each state (open, closed) was inferred from the most probable state-trajectory, an histogram was made and the mean time spent in each state was calculated.
Ensemble FRET
Fluorescence spectra of labeled
SBD1 and SBD2 proteins were measured on a scanning spectrofluorometer (Jasco FP-8300; λ ex = 552 nm, 5 nm excitation and emission bandwidth; 3 s integration time). The apparent FRET efficiency was calculated via I acceptor /(I acceptor +I donor ), where I acceptor and I donor are fluorescence intensities around the emission maxima of the acceptor (660 nm) and donor fluorophore (600 nm), respectively. Measurements were performed at 20°C with ~200 nM labeled protein dissolved in buffer A.
Additional files 10.7554/eLife.44652.030 Supplementary file 1. P-values of two-way Kolmogorov-Smirnov test on the solution-based smFRET data. 10.7554/eLife.44652.031 Supplementary file 2. Primer sequences of all protein constructs used in this study. 10.7554/eLife.44652.032 Supplementary file 3. Apparent FRET efficiency values of solution-based measurements. 10.7554/eLife.44652.033 Supplementary file 4. Statistics of confocal scanning experiments of immobilized molecules. 10.7554/eLife.44652.034 Transparent reporting form
📊 Figures
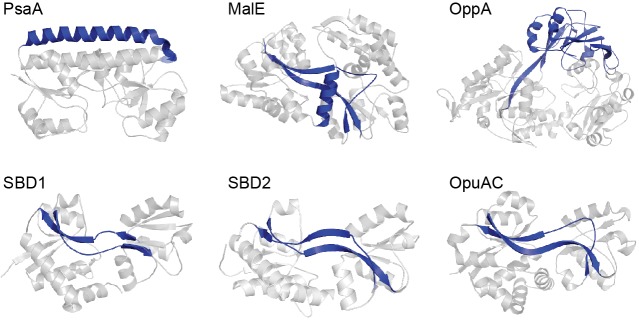
Figure 1.
Representative SBPs from different structural clusters, categorized by their hinge region.
X-ray crystal structures of PsaA (3ZK7; cluster A), MalE (1OMP; cluster B), OppA (3FTO; cluster C), OpuAC (3L6G; cluster F), SBD1 (4LA9; cluster F) and SBD2 (4KR5; cluster F) are all shown in the open...
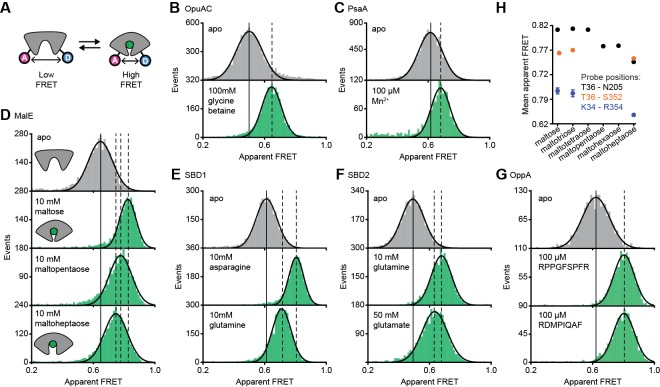
Figure 2.
Conformational states of SBPs probed by smFRET reveal multiple active conformations.
( A ) Experimental strategy to study SBP conformational changes via FRET. Solution-based apparent FRET efficiency histograms of OpuAC(V360C/N423C) ( B ), PsaA(V76C/K237C) ( C ), MalE(T36C/S352C) ( D )...
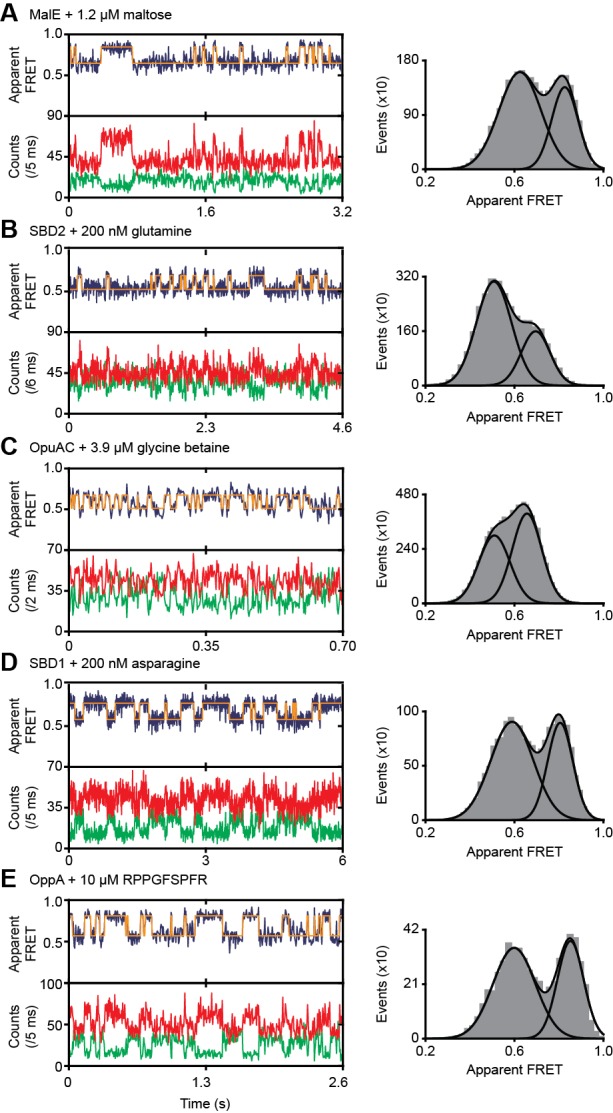
Figure 2u2014figure supplement 1.
Ligand-induced conformational dynamics of SBPs.
Representative fluorescence trajectories (left) and apparent FRET efficiency histograms from all fluorescence trajectories (right) of MalE(T36C/S352C) ( A ), SBD2(T369C/S451) ( B ), OpuAC(V360C/N423C)...
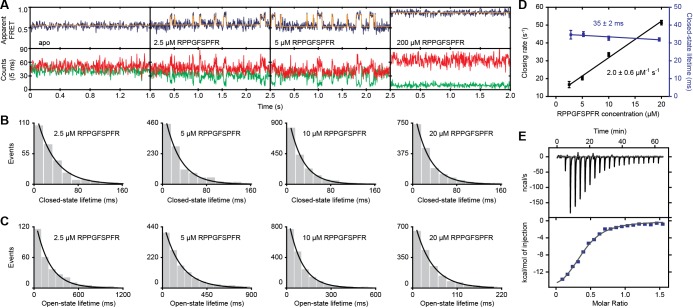
Figure 2u2014figure supplement 2.
OppA uses an induced-fit ligand binding mechanism.
( A ) Representative fluorescence trajectories of OppA(A209C/S441C) at different peptide (RPPGFSFR) concentrations; donor (green) and acceptor (red) photon counts. The top panel shows the calculated a...
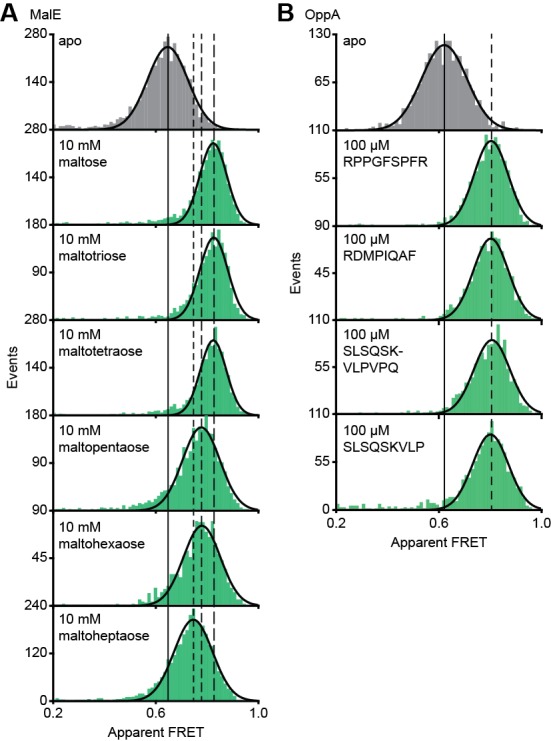
Figure 2u2014figure supplement 3.
Translocation competent conformation(s) of MalE and OppA.
Solution-based apparent FRET efficiency histogram of MalE(T36C/S352C) ( A ) and OppA(A209C/S441C) ( B ) in the absence and presence of different cognate substrates as indicated. The OppA substrates ar...
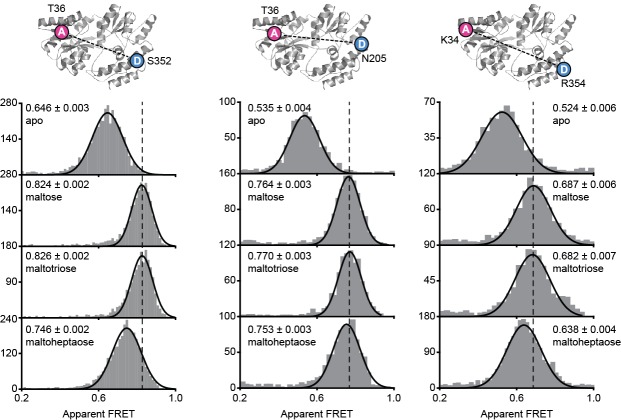
Figure 2u2014figure supplement 4.
MalE conformations studied by smFRET.
Solution-based apparent FRET efficiency histogram of MalE(T36C/S352C), MalE(T36C/N205C) and MalE(K34C/R354C) in the absence and presence of different cognate substrates as indicated. Bars are the data...
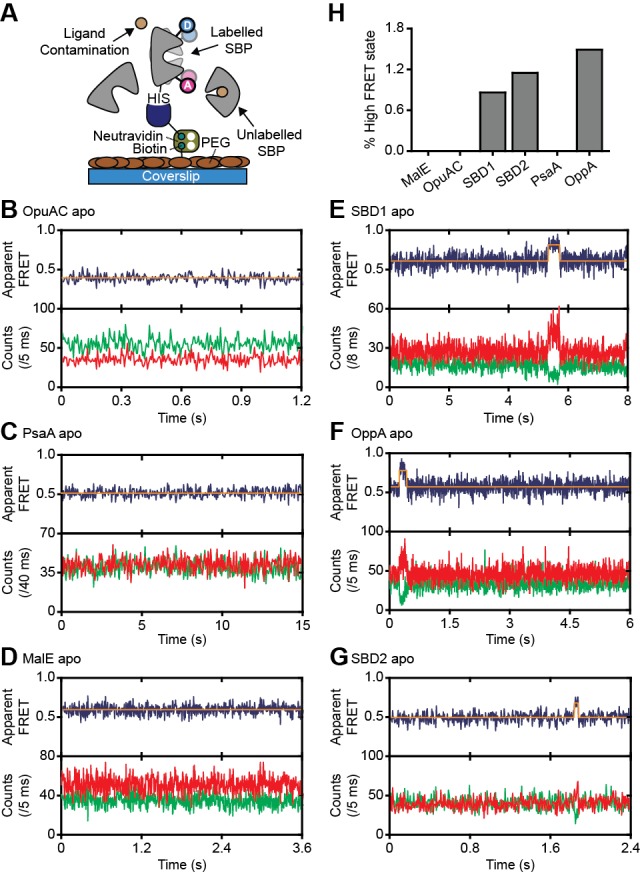
Figure 3.
Rare conformational states of ligand-free SBPs.
( A ) Schematic of the experimental strategy to study the conformational dynamics of ligand-free SBPs. Representative fluorescence trajectories of OpuAC(V360C/N423C) ( B ), PsaA(V76C/K237C) ( C ), Mal...
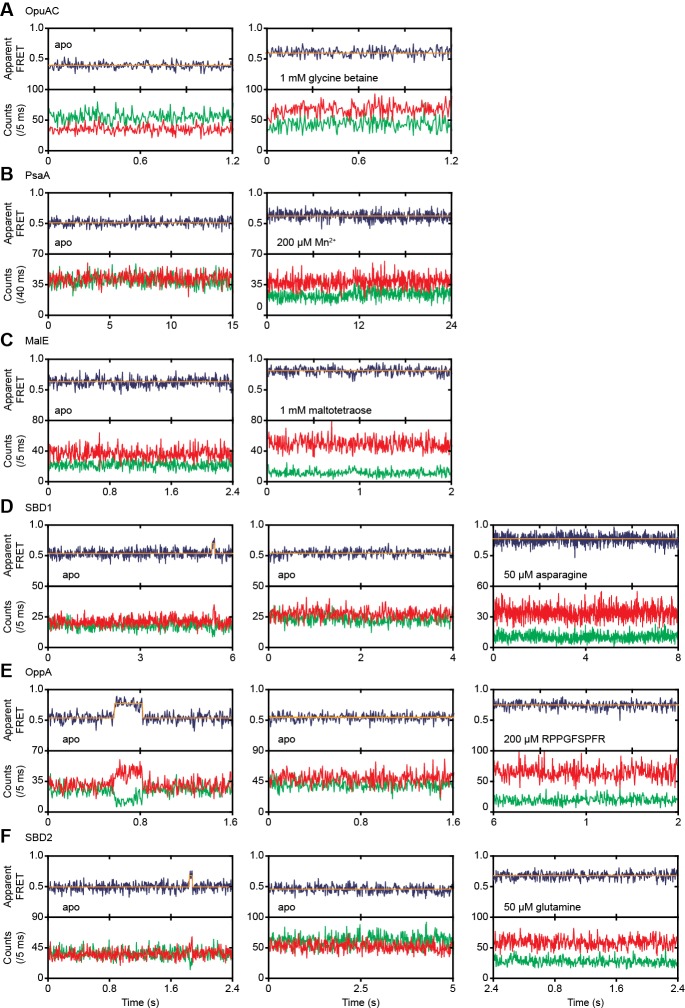
Figure 3u2014figure supplement 1.
Conformational dynamics of ligand-free and ligand-bound SBPs.
Representative fluorescence trajectories of OpuAC(V360C/N423C) ( A ), PsaA(V76C/K237C) ( B ), MalE(T36C/S352C) ( C ), SBD1(T159C/G87C) ( D ), OppA(A209C/S441C) ( E ) and SBD2(T369C/S451) ( F ) in the ...
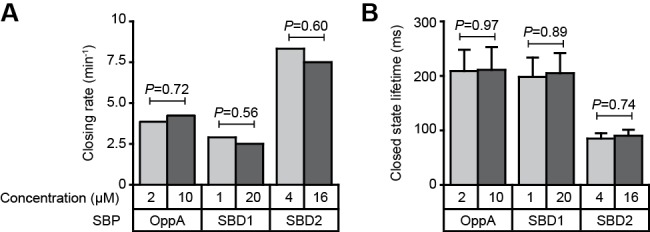
Figure 3u2014figure supplement 2.
Intrinsic conformational dynamics in the presence of unlabeled protein.
Closing rate ( A ) and average lifetime of the closed conformation ( B ) for OppA, SBD1 and SBD2 in the absence of ligand and in the presence of different concentrations of unlabeled protein to scaven...
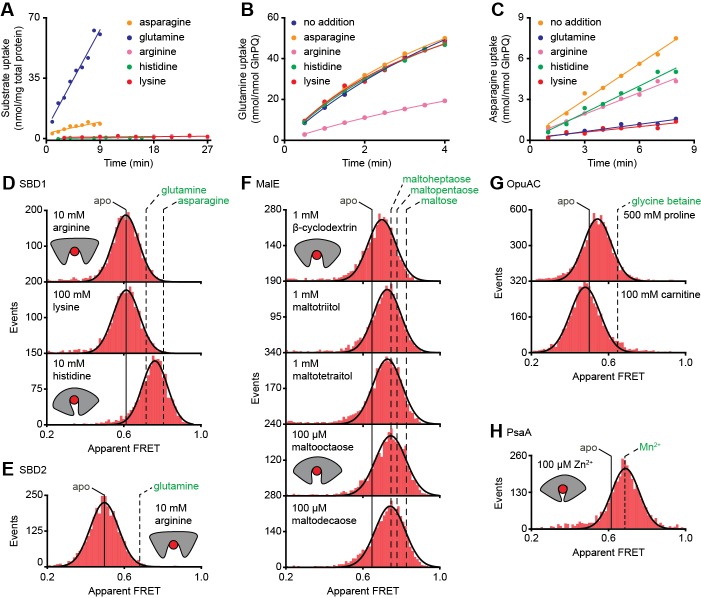
Figure 4.
Substrate-specificity of GlnPQ and SBP conformations induced by non-cognate substrates.
( A ) Time-dependent uptake [ 14 C]-asparagine (5 u03bcM), [ 14 C]-glutamine (5 u03bcM), [ 14 C]-arginine (100 u03bcM), [ 14 C]-histidine (100 u03bcM) and [ 3 H]-lysine (100 u03bcM) by GlnPQ in L. lac...
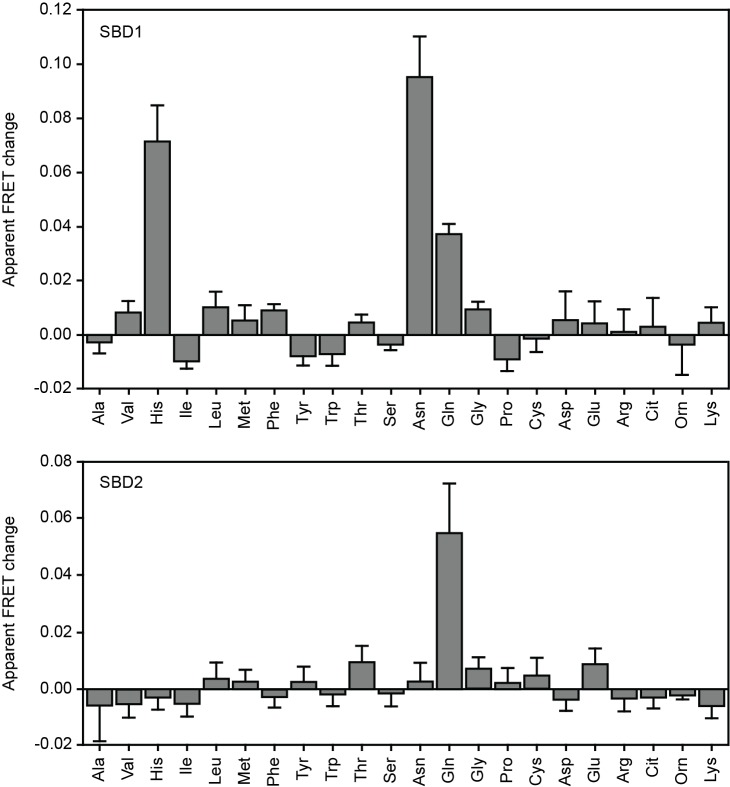
Figure 4u2014figure supplement 1.
Substrate binding of SBD1 and SBD2 studied by ensemble FRET.
The mean apparent FRET change of SBD1 (top) and SBD2 (bottom) in the presence of 5 mM of the indicated amino acids relative to their absence; measurements were performed in 50 mM KPi, 50 mM KCl, pH 7....
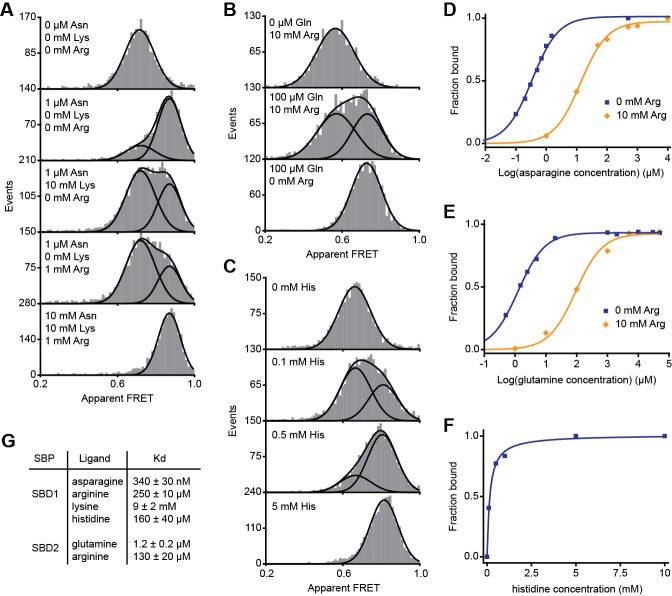
Figure 4u2014figure supplement 2.
Non-cognate substrate binding by SBD1 and SBD2.
Solution-based apparent FRET efficiency histograms of SBD1(T159C/G87C) ( A and C ) and SBD2(T369C/S451) ( B ) in the presence of different ligand concentrations as indicated. Bars are the data and the...
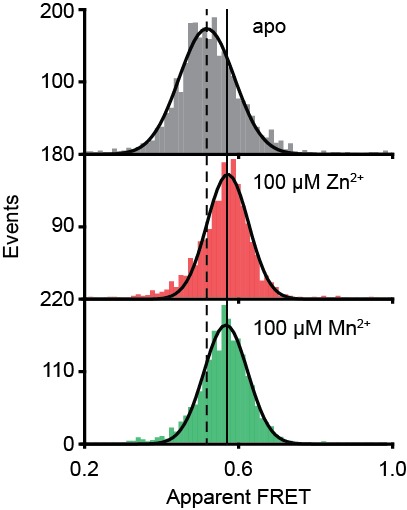
Figure 4u2014figure supplement 3.
PsaA(E74C/K237C) conformational changes probed by smFRET.
Solution-based apparent FRET efficiency histogram of PsaA(E74C/K237C) in the presence and absence of metals as indicated. Bars are the data and solid line a Gaussian fit. The 95% confidence interval f...
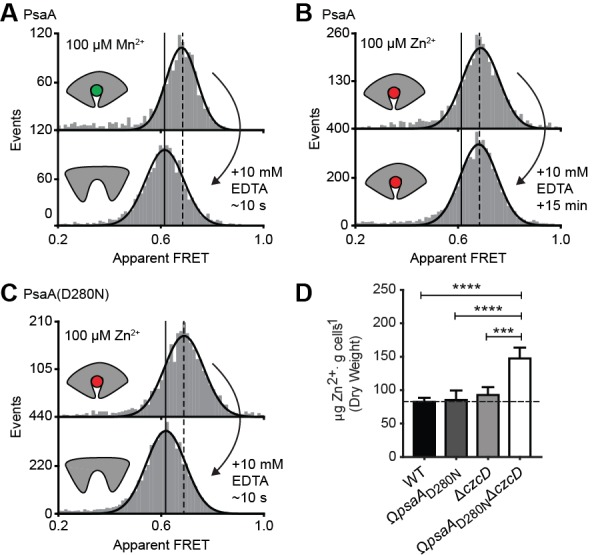
Figure 5.
Opening transition in PsaA dictates transport specificity.
Solution-based apparent FRET efficiency histograms of PsaA(V76C/K237C) in the presence of Mn 2+ ( A ) or Zn 2+ ( B ) and PsaA(D280N) in the presence of Zn 2+ ( C ) upon addition of 10 mM EDTA and incu...
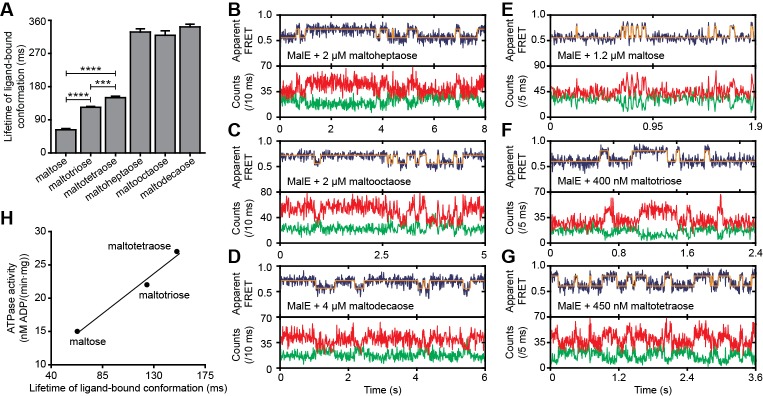
Figure 6.
Lifetime of MalE ligand-bound conformations and relation to activity.
( A ) Mean lifetime of the ligand-bound conformations of MalE, obtained from all single-molecule fluorescence trajectories in the presence of different maltodextrins as indicated. Data corresponds to ...
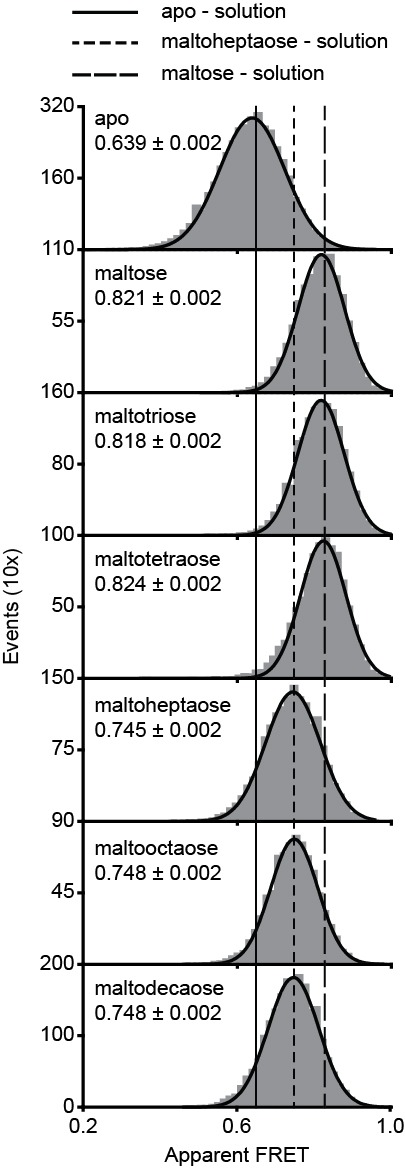
Figure 6u2014figure supplement 1.
Surface-based smFRET histogram of MalE.
( A ) Surface-based apparent FRET efficiency histogram of MalE(T36C/S352C) in the presence of different maltodextrin substrates as indicated. From the probable state-trajectory of the Hidden Markov Mo...
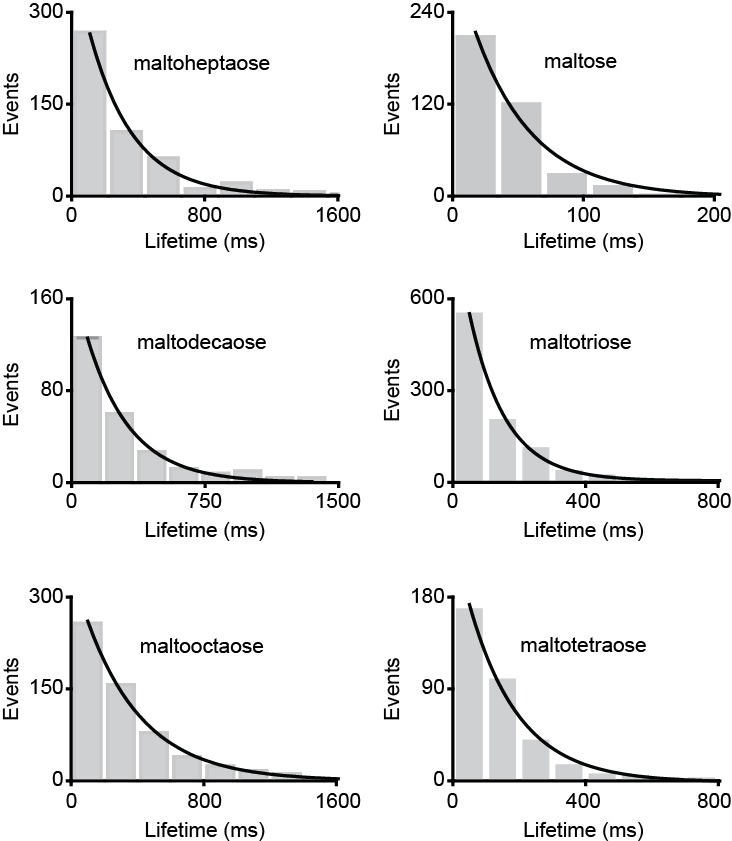
Figure 6u2014figure supplement 2.
Lifetimeu00a0distribution of the ligand-bound conformations of MalE.
Dwell time histogram of the high FRET (closed ligand-bound conformation) as obtained from the most probable state-trajectory of the Hidden Markov Model (HMM) of all molecules per condition as shown in...
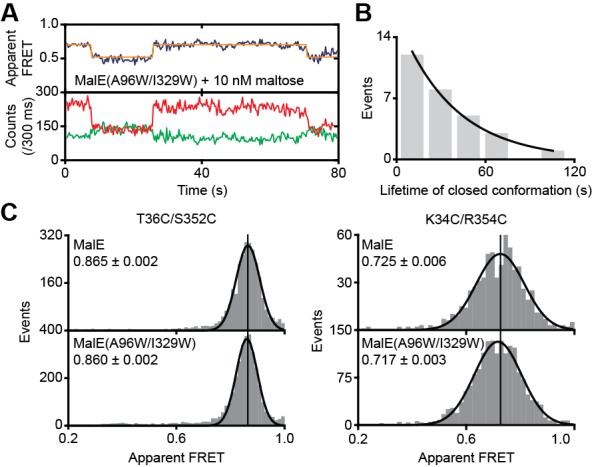
Figure 6u2014figure supplement 3.
Conformational changes and dynamics of MalE(A96W/I329W).
( A ) Representative fluorescence trajectories of MalE(T36C/S352C/A96W/I329W) in the presence of 10 nM maltose. Fluorescence trajectories: the top panel shows the calculated apparent FRET efficiency (...
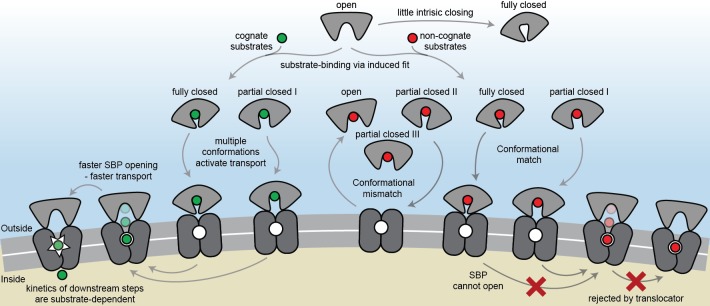
Figure 7.
The conformational changes and dynamics of SBPs and the regulation of transport.
Schematic summarizing the plasticity of ligand binding and solute import via ABC importers. Intrinsic closing of an SBP is a rare event or absent in some SBPs (u2018little intrinsic closingu2019). Lig...
Figure images are served from the NIH/NLM PubMed Central Open Access Subset or Europe PMC; copyright remains with the publishers and authors.
💬 Discussion
0 commentsNo comments yet. Be the first to start a discussion!
Leave a Comment