Abstract
Naturalistic escape requires versatile context-specific flight with rapid evaluation of local geometry to identify and use efficient escape routes. It is unknown how spatial navigation and escape circuits are recruited to produce context-specific flight. Using mice, we show that activity in cholecystokinin-expressing hypothalamic dorsal premammillary nucleus (PMd-cck) cells is sufficient and necessary for context-specific escape that adapts to each environment's layout. In contrast, numerous other nuclei implicated in flight only induced stereotyped panic-related escape. We reasoned the dorsal premammillary nucleus (PMd) can induce context-specific escape because it projects to escape and spatial navigation nuclei. Indeed, activity in PMd-cck projections to thalamic spatial navigation circuits is necessary for context-specific escape induced by moderate threats but not panic-related stereotyped escape caused by perceived asphyxiation. Conversely, the PMd projection to the escape-inducing dorsal periaqueductal gray projection is necessary for all tested escapes. Thus, PMd-cck cells control versatile flight, engaging spatial navigation and escape circuits.
🔬 Techniques
🔭 Microscopes
✨ Fluorophores
🧪 Sample Preparation
🔬 Cell Lines
🏭 Microscope Brands
🧪 Reagent Suppliers
🎨 Filters
💻 Software Details
💻 Code & Software
💾 Data Repositories
🏛️ Research Organizations (ROR)
Affiliated research institutions:
📋 Methods
RESOURCE AVAILABILITY Lead Contact Further information and requests for resources and reagents should be directed to and will be fulfilled by the Lead Contact, Avishek Adhikari ( avi@psych.ucla.edu ).
Materials Availability
This study did not generate new unique reagents.
Data and code availability
The datasets generated and/or analyzed in the current study are available from the corresponding author upon reasonable request. All scripts for analyzing data are also available upon reasonable request.
EXPERIMENTAL MODEL AND SUBJECT DETAILS
All procedures conformed to guidelines established by the National Institutes of Health and have been approved by the University of California, Los Angeles Institutional Animal Care and Use Committee or by the University of Sao Paulo Animal Bioethics committee. Mice. Cck-IRES-Cre mice (Jackson Laboratory stock No. 012706), SF1-cre (Jackson Laboratory stock No. 012462) and wild type C57BL/6J mice (Jackson Laboratory stock No. 000664) were used for all experiments. Male and female mice between 2 and 6 months of age were used in all experiments. Mice were maintained on a 12-hour reverse light-dark cycle with food and water ad libitum. Sample sizes were chosen based on previous behavioral optogenetics studies on defensive behaviors, which typically use 6–15 mice per group. All mice were handled for a minimum of 5 days prior to any behavioral task. Rats. Male Long-Evans rats (250–400 grams) were obtained from Charles River Laboratories and were individually housed on a standard 12-hour light-dark cycle and given food and water ad libitum. Rats were only used as a predatory stimulus. Rats were handled for several weeks prior to being used and were screened for low aggression to avoid attacks on mice. No attacks on mice were observed in this experiment. METHOD DETAILS Viral Vectors. Optogenetics: The following adeno-associated viral vectors (AAV), used in the optogenetic experiments, were purchased from Addgene (Watertown, MA): AAV9.hSyn.eGFP.WPRE.bGH, AAV9.Syn.DIO.EGFP.WPRE.hGH, AAV9.hSyn.hChR2.(H134R)-eYFP.WPRE.hGH, AAV9.EF1a.DIO.hChR2(H134R)-eYFP.WPRE.hGH, AAV9-EF1a-DIO-eYFP and AAV9-FLEX-Arch-GFP. Chemogenetics: The following AAVs, used in the chemogenetic experiments, were purchased from Addgene: pAAV8-hSyn-DIO-hM4D(Gi)-mCherry, AAV8.Syn.DIO.HM3D(Gq)-mCherry, and AAV8.Syn.DIO.mCherry. Fiber Photometry: AAV9.Syn.GCaMP6s.WPRE.SV40 and AAV9.Syn.FLEX.GCaMP6s.WPRE.SV40, used in the fiber photometry experiments, were purchased from Addgene. Surgeries. Surgeries were performed as described previously ( Adhikari et al., 2015 ). Eight-week-old mice were anaesthetized with 1.5–3.0% isoflurane and placed in a stereotaxic apparatus (Kopf Instruments). A scalpel was used to open an incision along the midline to expose the skull. After performing a craniotomy, 40 nl of AAV9.hSyn.hChR2.(H134R)-eYFP.WPRE.hGH at a titer of 2*1012 particles/ml was injected per site (PMd or other hypothalamic and brainstem nuclei) using a 10 μl nanofil syringe (World Precision Instruments) at 0.08 μl/min. The syringe was coupled to a 33-gauge beveled needle, and the bevel was placed to face the anterior side of the animal. The syringe was slowly retracted 20 minutes after the start of the infusion. Mice received unilateral viral infusion and fiber optic cannula implantation. Infusion locations measured as anterior-posterior, medial-lateral and dorso-ventral coordinates from bregma were: anterior hypothalamus (−0.7, −0.4, −5.2), dorsomedial hypothalamus (−1.94, −0.5, −5.3), ventromedial hypothalamus (−1.5, −0.4, −5.5), lateral hypothalamus (−2.46, −1.1, −5.2) dorsolateral periaqueductal gray (dlPAG) (−4.75, −0.45, −1.9), posterior hypothalamus (−2.30, −0.3, −4.5), dorsal premammillary nucleus (PMd) (−2.46, −0.5, −5.35). For arch experiments and dual photometry assays the dlPAG coordinates were (−4.6, −1.05, −2.1 using a 15-degree angle). Fiber optic cannula (0.22 NA, 200 μm diameter; Doric Lenses) were implanted unilaterally 0.15 mm above the viral infusion sites. Only mice with opsin expression restricted to the intended targets were used for behavioral assays. For optogenetic experiments in PMd-cck mice, the same PMd coordinates were used to inject 0.16 uL of AAV9.EF1a.DIO.hChR2(H134R)-eYFP.WPRE.hGH or AAV9.EF1a.DIO.eYFP.WPRE.hGH. For chemogenetic experiments mice received 0.16 uL of pAAV8-hSyn-DIO-hM4D(Gi)-mCherry, AAV8.Syn.DIO.HM3D(Gq)-mCherry, or AAV8.Syn.DIO. mCherry in the PMd or dorsomedial hypothalamus coordinates. Similar AAV8-based vectors have been validated and used by numerous other researchers ( Hardaway et al., 2019 ; Jiang-Xie et al., 2019 ; Shen et al., 2019 ; Wang et al., 2019 ). For photometry experiments mice were injected with 0.16 uL of AAV9.Syn.GCaMP6s.WPRE.SV40 and AAV9.Syn.Flex.GCaMP6s.WPRE.SV40 in the dlPAG and PMd, respectively of cck-cre mice. Mice were implanted unilaterally with cannulae in the PMd and the dlPAG. A 400 μm diameter, 0.48 NA optical fiber (Neurophotometrics) was used for photometry experiments. Adhesive cement (C&B metabond; Parkell, Edgewood, NY, USA) and dental cement (Stoelting, Wood Dale, IL, USA) were used to securely attach the fiber optic cannula to the skull. Half the mice in each cage were randomly assigned to YFP/mcherry or ChR2 /Arch/hM4Di/hM3Dq groups. For miniaturized microscope experiments 40 nL of AAV9-DIO-GCaMP6s was injected in the PMd of cck-cre mice and a GRIN lens was implanted 200 uM above the infusion site. Three weeks following surgery animals were base-plated. The rats used in this study were obtained from a partner lab and never optogenetically stimulated during the described assays. The rats had fiber optic cannulae implants from prior unrelated experiments. For details of the surgery, see ( Malvaez et al. ). Briefly, rats were anesthetized with isoflurane and bilaterally infused with AAV5-CaMKIIa-hChR2(H134R)-eYFP or AAV8-CaMKIIa-eYFP. Viral infusion (0.30 μl) was performed at a rate of 6 μl/hr by an infusion needle at the lateral or medial orbitofrontal cortex. Optical fibers (200 μm core, numerical aperture 0.66; Prizmatix, Southfield, MI) positioned in ferrules (Kientec Systems Inc., Stuart, FL) were implanted 0.3 mm above the basolateral amygdala (AP −3.0 mm, ML ± 5.1, DV −7.7). In situ hybridization. Cck-IRES-Cre mice (Jackson Laboratory stock No. 012706) were euthanized with 5% isoflurane followed by cervical dislocation. Brains were harvested and snap-frozen in 2-methylbutane at −20°C and tissue was sectioned at 18 μm. The workflow was performed in accordance with the manufacturer’s protocol for the RNAScope® Multiplex Fluorescent Assay (Advanced Cell Diagnostics, Newark, CA). Riboprobes selective for sequences were labeled as follows: Cre (C1, Cat. No. 312281), nNOS with (437651-C2) and NeuN (Mm-Rbfox3-C3, Cat No. 313311-C3) or VGLUT2 (Mm-Slc17a6-C3, Cat No. 319171-C3). Images were obtained with a Leica DM5500 fluorescent microscope at 40x. Immunostaining for NeuN. Fixed brains were kept in 30% sucrose at 4oC overnight, and then sectioned on a cryostat (40 μm) slices. Sections were washed in PBS and incubated in a blocking solution (3% normal donkey serum and 0.3% triton-x in PBS) for 1 hour at room temperature. Sections were then incubated at 4oC for 12 hours with polyclonal anti-NeuN antibody made in rabbit (1/500 dilution) (CAT# NBP1-77686SS, Novusbio) in blocking solution. Following primary antibody incubation sections were washed in PBS 3 times for 10 minutes, and then incubated with anti-rabbit IgG (H+L) antibody (1/500 dilution) conjugated to Alexa Fluor 594 (red) (CAT# 8889S, cellsignal.com ) for 1 hour at room temperature. Sections were washed in PBS 3 times for 10 minutes, incubated with DAPI (1/50000 dilution in PBS), washed again in PBS and mounted in glass slides using PVA-DABCO (Sigma). Acute brain slice preparation and electrophysiological recordings. Acute brain slices preparation and electrophysiological recordings were performed using standard methods as previously described( Nagai et al., 2019 ). Briefly, Cck-Cre+ mice that had received AAV microinjections into PMd were deeply anesthetized with isoflurane and decapitated with sharp shears. The brains were placed and sliced in ice-cold modified artificial CSF (aCSF) containing the following (in mM): 194 sucrose, 30 NaCl, 4.5 KCl, 1 MgCl 2 , 26 NaHCO 3 , 1.2 NaH2PO 4 , and 10 D-glucose, saturated with 95% O 2 and 5% CO 2 . A vibratome (DSK-Zero1) was used to cut 300 μm brain sections. The slices were allowed to equilibrate for 30 minutes at 32–34°C in normal aCSF containing (in mM); 124 NaCl, 4.5 KCl, 2 CaCl 2 , 1 MgCl 2 , 26 NaHCO 3 , 1.2 NaH 2 PO 4 , and 10 D-glucose continuously bubbled with 95% O 2 and 5% CO 2 . Slices were then stored at 21–23°C in the same buffer until use. All slices were used within 2–6 hours of slicing. Slices were placed in the recording chamber and continuously perfused with 95% O 2 and 5% CO 2 bubbled normal aCSF. pCLAMP10.4 software and a Multi-Clamp 700B amplifier was used for electrophysiology (Molecular Devices). Whole-cell patch-clamp recordings were made from neurons in the PMd or dorsolateral PAG (dlPAG) using patch pipettes with a typical resistance of 4–5 MΩ. Neurons were selected based on reporter fluorescence, i.e. YFP for ChR2-YFP and mCherry for hM3Dq-mCherry or hM4Di-mCherry. The intracellular solution for recordings comprised the following (in mM) : 135 potassium gluconate, 5 KCl, 0.5 CaCl 2 , 5 HEPES, 5 EGTA, 2 Mg-ATP and 0.3 Na-GTP, pH 7.3 adjusted with KOH. The initial access resistance values were < 20 MΩ for all cells; if this changed by > 20% the cell was discarded. Light flashes (0.2 mW/mm2) from a blue LED light source (Sutter Instruments) were delivered via the microscope optics and a 40x water immersion objective lens and controlled remotely using TTL pulses from Clampex. Cell responses were recorded in whole-cell mode and recorded using an Axopatch 700B amplifier connected via a digitizer to a computer with pCLAMP10 software. To stimulate ChR2 expressed in PMd neurons or axons, 5 ms pulses were delivered at inter-pulse intervals of 200 ms, 50 ms or 25 ms for 5, 20 or 40 Hz optical stimulations, respectively. To assess PMd-dlPAG synaptic transmission, dlPAG neurons in the vicinity of ChR2-expressing PMd axons were patched. To isolate light-evoked EPSCs, neurons were voltage-clamped at −70 mV and pre-incubated with 10 μM bicuculline, an antagonist for GABA A receptors, for 5 minutes before recording. To block AMPA receptor-mediated EPSCs, 20 μM cyanquixaline (CNQX, 6-cyano-7-nitroquinoxaline-2,3-dione) was applied in the bath. The voltage-gated sodium channel blocker tetrodotoxin (TTX, 0.3 μM) was included in the bath to demonstrate action potential-dependent ChR2-mediated transmitter release. To examine direct (monosynaptic) release of glutamate by PMd axons to dlPAG neurons, EPSCs were measured in the presence of TTX and the voltage-gated K+ channel blocker 4-aminopyridine (4AP, 500 μM) for enhancing ChR2-mediated depolarization of terminals. 5 μM CNO was applied in the bath to stimulate Gq-DREADD hM3Dq or Gi-DREADD hM4Di expressed in PMd neurons. In some cases, 1 mg/ml biocytin (Tocris, 3349) was added to the intracellular solution to subsequently visualize patched neurons.
Show full methods section
RESOURCE AVAILABILITY Lead Contact Further information and requests for resources and reagents should be directed to and will be fulfilled by the Lead Contact, Avishek Adhikari ( avi@psych.ucla.edu ).
Materials Availability
This study did not generate new unique reagents.
Data and code availability
The datasets generated and/or analyzed in the current study are available from the corresponding author upon reasonable request. All scripts for analyzing data are also available upon reasonable request.
EXPERIMENTAL MODEL AND SUBJECT DETAILS
All procedures conformed to guidelines established by the National Institutes of Health and have been approved by the University of California, Los Angeles Institutional Animal Care and Use Committee or by the University of Sao Paulo Animal Bioethics committee. Mice. Cck-IRES-Cre mice (Jackson Laboratory stock No. 012706), SF1-cre (Jackson Laboratory stock No. 012462) and wild type C57BL/6J mice (Jackson Laboratory stock No. 000664) were used for all experiments. Male and female mice between 2 and 6 months of age were used in all experiments. Mice were maintained on a 12-hour reverse light-dark cycle with food and water ad libitum. Sample sizes were chosen based on previous behavioral optogenetics studies on defensive behaviors, which typically use 6–15 mice per group. All mice were handled for a minimum of 5 days prior to any behavioral task. Rats. Male Long-Evans rats (250–400 grams) were obtained from Charles River Laboratories and were individually housed on a standard 12-hour light-dark cycle and given food and water ad libitum. Rats were only used as a predatory stimulus. Rats were handled for several weeks prior to being used and were screened for low aggression to avoid attacks on mice. No attacks on mice were observed in this experiment. METHOD DETAILS Viral Vectors. Optogenetics: The following adeno-associated viral vectors (AAV), used in the optogenetic experiments, were purchased from Addgene (Watertown, MA): AAV9.hSyn.eGFP.WPRE.bGH, AAV9.Syn.DIO.EGFP.WPRE.hGH, AAV9.hSyn.hChR2.(H134R)-eYFP.WPRE.hGH, AAV9.EF1a.DIO.hChR2(H134R)-eYFP.WPRE.hGH, AAV9-EF1a-DIO-eYFP and AAV9-FLEX-Arch-GFP. Chemogenetics: The following AAVs, used in the chemogenetic experiments, were purchased from Addgene: pAAV8-hSyn-DIO-hM4D(Gi)-mCherry, AAV8.Syn.DIO.HM3D(Gq)-mCherry, and AAV8.Syn.DIO.mCherry. Fiber Photometry: AAV9.Syn.GCaMP6s.WPRE.SV40 and AAV9.Syn.FLEX.GCaMP6s.WPRE.SV40, used in the fiber photometry experiments, were purchased from Addgene. Surgeries. Surgeries were performed as described previously ( Adhikari et al., 2015 ). Eight-week-old mice were anaesthetized with 1.5–3.0% isoflurane and placed in a stereotaxic apparatus (Kopf Instruments). A scalpel was used to open an incision along the midline to expose the skull. After performing a craniotomy, 40 nl of AAV9.hSyn.hChR2.(H134R)-eYFP.WPRE.hGH at a titer of 2*1012 particles/ml was injected per site (PMd or other hypothalamic and brainstem nuclei) using a 10 μl nanofil syringe (World Precision Instruments) at 0.08 μl/min. The syringe was coupled to a 33-gauge beveled needle, and the bevel was placed to face the anterior side of the animal. The syringe was slowly retracted 20 minutes after the start of the infusion. Mice received unilateral viral infusion and fiber optic cannula implantation. Infusion locations measured as anterior-posterior, medial-lateral and dorso-ventral coordinates from bregma were: anterior hypothalamus (−0.7, −0.4, −5.2), dorsomedial hypothalamus (−1.94, −0.5, −5.3), ventromedial hypothalamus (−1.5, −0.4, −5.5), lateral hypothalamus (−2.46, −1.1, −5.2) dorsolateral periaqueductal gray (dlPAG) (−4.75, −0.45, −1.9), posterior hypothalamus (−2.30, −0.3, −4.5), dorsal premammillary nucleus (PMd) (−2.46, −0.5, −5.35). For arch experiments and dual photometry assays the dlPAG coordinates were (−4.6, −1.05, −2.1 using a 15-degree angle). Fiber optic cannula (0.22 NA, 200 μm diameter; Doric Lenses) were implanted unilaterally 0.15 mm above the viral infusion sites. Only mice with opsin expression restricted to the intended targets were used for behavioral assays. For optogenetic experiments in PMd-cck mice, the same PMd coordinates were used to inject 0.16 uL of AAV9.EF1a.DIO.hChR2(H134R)-eYFP.WPRE.hGH or AAV9.EF1a.DIO.eYFP.WPRE.hGH. For chemogenetic experiments mice received 0.16 uL of pAAV8-hSyn-DIO-hM4D(Gi)-mCherry, AAV8.Syn.DIO.HM3D(Gq)-mCherry, or AAV8.Syn.DIO. mCherry in the PMd or dorsomedial hypothalamus coordinates. Similar AAV8-based vectors have been validated and used by numerous other researchers ( Hardaway et al., 2019 ; Jiang-Xie et al., 2019 ; Shen et al., 2019 ; Wang et al., 2019 ). For photometry experiments mice were injected with 0.16 uL of AAV9.Syn.GCaMP6s.WPRE.SV40 and AAV9.Syn.Flex.GCaMP6s.WPRE.SV40 in the dlPAG and PMd, respectively of cck-cre mice. Mice were implanted unilaterally with cannulae in the PMd and the dlPAG. A 400 μm diameter, 0.48 NA optical fiber (Neurophotometrics) was used for photometry experiments. Adhesive cement (C&B metabond; Parkell, Edgewood, NY, USA) and dental cement (Stoelting, Wood Dale, IL, USA) were used to securely attach the fiber optic cannula to the skull. Half the mice in each cage were randomly assigned to YFP/mcherry or ChR2 /Arch/hM4Di/hM3Dq groups. For miniaturized microscope experiments 40 nL of AAV9-DIO-GCaMP6s was injected in the PMd of cck-cre mice and a GRIN lens was implanted 200 uM above the infusion site. Three weeks following surgery animals were base-plated. The rats used in this study were obtained from a partner lab and never optogenetically stimulated during the described assays. The rats had fiber optic cannulae implants from prior unrelated experiments. For details of the surgery, see ( Malvaez et al. ). Briefly, rats were anesthetized with isoflurane and bilaterally infused with AAV5-CaMKIIa-hChR2(H134R)-eYFP or AAV8-CaMKIIa-eYFP. Viral infusion (0.30 μl) was performed at a rate of 6 μl/hr by an infusion needle at the lateral or medial orbitofrontal cortex. Optical fibers (200 μm core, numerical aperture 0.66; Prizmatix, Southfield, MI) positioned in ferrules (Kientec Systems Inc., Stuart, FL) were implanted 0.3 mm above the basolateral amygdala (AP −3.0 mm, ML ± 5.1, DV −7.7). In situ hybridization. Cck-IRES-Cre mice (Jackson Laboratory stock No. 012706) were euthanized with 5% isoflurane followed by cervical dislocation. Brains were harvested and snap-frozen in 2-methylbutane at −20°C and tissue was sectioned at 18 μm. The workflow was performed in accordance with the manufacturer’s protocol for the RNAScope® Multiplex Fluorescent Assay (Advanced Cell Diagnostics, Newark, CA). Riboprobes selective for sequences were labeled as follows: Cre (C1, Cat. No. 312281), nNOS with (437651-C2) and NeuN (Mm-Rbfox3-C3, Cat No. 313311-C3) or VGLUT2 (Mm-Slc17a6-C3, Cat No. 319171-C3). Images were obtained with a Leica DM5500 fluorescent microscope at 40x. Immunostaining for NeuN. Fixed brains were kept in 30% sucrose at 4oC overnight, and then sectioned on a cryostat (40 μm) slices. Sections were washed in PBS and incubated in a blocking solution (3% normal donkey serum and 0.3% triton-x in PBS) for 1 hour at room temperature. Sections were then incubated at 4oC for 12 hours with polyclonal anti-NeuN antibody made in rabbit (1/500 dilution) (CAT# NBP1-77686SS, Novusbio) in blocking solution. Following primary antibody incubation sections were washed in PBS 3 times for 10 minutes, and then incubated with anti-rabbit IgG (H+L) antibody (1/500 dilution) conjugated to Alexa Fluor 594 (red) (CAT# 8889S, cellsignal.com ) for 1 hour at room temperature. Sections were washed in PBS 3 times for 10 minutes, incubated with DAPI (1/50000 dilution in PBS), washed again in PBS and mounted in glass slides using PVA-DABCO (Sigma). Acute brain slice preparation and electrophysiological recordings. Acute brain slices preparation and electrophysiological recordings were performed using standard methods as previously described( Nagai et al., 2019 ). Briefly, Cck-Cre+ mice that had received AAV microinjections into PMd were deeply anesthetized with isoflurane and decapitated with sharp shears. The brains were placed and sliced in ice-cold modified artificial CSF (aCSF) containing the following (in mM): 194 sucrose, 30 NaCl, 4.5 KCl, 1 MgCl 2 , 26 NaHCO 3 , 1.2 NaH2PO 4 , and 10 D-glucose, saturated with 95% O 2 and 5% CO 2 . A vibratome (DSK-Zero1) was used to cut 300 μm brain sections. The slices were allowed to equilibrate for 30 minutes at 32–34°C in normal aCSF containing (in mM); 124 NaCl, 4.5 KCl, 2 CaCl 2 , 1 MgCl 2 , 26 NaHCO 3 , 1.2 NaH 2 PO 4 , and 10 D-glucose continuously bubbled with 95% O 2 and 5% CO 2 . Slices were then stored at 21–23°C in the same buffer until use. All slices were used within 2–6 hours of slicing. Slices were placed in the recording chamber and continuously perfused with 95% O 2 and 5% CO 2 bubbled normal aCSF. pCLAMP10.4 software and a Multi-Clamp 700B amplifier was used for electrophysiology (Molecular Devices). Whole-cell patch-clamp recordings were made from neurons in the PMd or dorsolateral PAG (dlPAG) using patch pipettes with a typical resistance of 4–5 MΩ. Neurons were selected based on reporter fluorescence, i.e. YFP for ChR2-YFP and mCherry for hM3Dq-mCherry or hM4Di-mCherry. The intracellular solution for recordings comprised the following (in mM) : 135 potassium gluconate, 5 KCl, 0.5 CaCl 2 , 5 HEPES, 5 EGTA, 2 Mg-ATP and 0.3 Na-GTP, pH 7.3 adjusted with KOH. The initial access resistance values were < 20 MΩ for all cells; if this changed by > 20% the cell was discarded. Light flashes (0.2 mW/mm2) from a blue LED light source (Sutter Instruments) were delivered via the microscope optics and a 40x water immersion objective lens and controlled remotely using TTL pulses from Clampex. Cell responses were recorded in whole-cell mode and recorded using an Axopatch 700B amplifier connected via a digitizer to a computer with pCLAMP10 software. To stimulate ChR2 expressed in PMd neurons or axons, 5 ms pulses were delivered at inter-pulse intervals of 200 ms, 50 ms or 25 ms for 5, 20 or 40 Hz optical stimulations, respectively. To assess PMd-dlPAG synaptic transmission, dlPAG neurons in the vicinity of ChR2-expressing PMd axons were patched. To isolate light-evoked EPSCs, neurons were voltage-clamped at −70 mV and pre-incubated with 10 μM bicuculline, an antagonist for GABA A receptors, for 5 minutes before recording. To block AMPA receptor-mediated EPSCs, 20 μM cyanquixaline (CNQX, 6-cyano-7-nitroquinoxaline-2,3-dione) was applied in the bath. The voltage-gated sodium channel blocker tetrodotoxin (TTX, 0.3 μM) was included in the bath to demonstrate action potential-dependent ChR2-mediated transmitter release. To examine direct (monosynaptic) release of glutamate by PMd axons to dlPAG neurons, EPSCs were measured in the presence of TTX and the voltage-gated K+ channel blocker 4-aminopyridine (4AP, 500 μM) for enhancing ChR2-mediated depolarization of terminals. 5 μM CNO was applied in the bath to stimulate Gq-DREADD hM3Dq or Gi-DREADD hM4Di expressed in PMd neurons. In some cases, 1 mg/ml biocytin (Tocris, 3349) was added to the intracellular solution to subsequently visualize patched neurons.
Immunohistochemistry
(IHC) for acute sections. 300 μm fresh brain slices were placed into 10% buffered formalin overnight at 4°C and processed as follows for IHC. Sections were washed 3 times in 0.1 M PBS with 2% Triton-X 100 for five minutes each, and then incubated in a blocking solution containing 10% NGS in 0.1 M PBS with 1% Triton-X 100 for 1 hr at room temperature with gentle agitation. Sections were then incubated with streptavidin conjugated Alexa 647 (1:250) diluted in 0.1 M PBS with 0.4% Triton-X 100 for overnight at 4°C. The sections were rinsed 3 times in 0.1 M PBS for 10 minutes each before being mounted on microscope slides in fluoromount-G. Images were obtained with the confocal microscopy using a commercial confocal laser scanning microscope (FV1000, Olympus). Behavior video capture. All behavior videos were captured at 30 frames/sec in standard definition (640×480) using a Logitech HD C310 webcam. To capture fiber-photometry synchronized videos, both the calcium signal and behavior were recorded by the same computer using custom Matlab scripts that also collected timestamp values for each calcium sample/behavioral frame. These timestamps were used to precisely align neural activity and behavior. Chemogenetics. Mice used for chemogenetic experiments were exposed to each threat and control stimuli twice, once following treatment with saline and once following treatment with CNO (5 mg/kg, injected intraperitoneally) 40 minutes prior to the experiment. Only one control or threat-exposure assay was performed per day with each mouse. Rat exposure assay. We used a corridor measuring (35 × 20 × 22 cm). At the end of the corridor there is a vertical wall with a wire mesh (with 1 cm x 1 cm square spaces in the mesh). Mice can use the mesh as a ladder to climb the vertical wall (22 cm height) and access a burrow. Mice were acclimated to this environment for three days for 10 minutes. Mice freely explored and independently climbed up the grid ladder. By the end of ten-minute acclimation mice climbed the ladder on their own without being touched by the experimenter’s hand. The next day they were exposed either to a toy rat or a live rat for 20 minutes. The rat is restrained to the corner opposite to the mesh grid by a harness attached to a string that is taped to the wall. Mice could climb to avoid the rat and hide in the burrow. After reaching the burrow mice were given 1 minute of hiding time in the burrow. They were then gently placed back in the bottom floor of the context in the same level as the rat (or toy rat). The number of climbs performed during 20 minutes was recorded. This length of 20 minutes includes the 1-minute hiding periods in the burrow. Heated floor exposure assay. The assay was done on top of a metallic heating plate (14 × 14 cm) (Faithful Magnetic Stirrer model SH-3) that was heated at either 43°C or was at room temperature (20–25°C). A transparent box (14 × 14 × 24 cm) was placed on top of the heated plate. A cylindrical metal mesh was placed that could be used for the mouse to climb to avoid the heat. The mouse was acclimated to this environment for three days (20-minute exposure). The next day the mouse was placed in this environment in either heated or room temperature floor. Mice climb the cylinder to avoid the heat and then go back to the heated floor as they cannot support their weight while hanging on the cylinder for extended time periods. The number of climbs performed in 20 minutes was measured. We chose 43°C because it is a temperature that caused escape climbs but that is not sufficient to cause pain or skin damage. No pain-related reactions such as paw licking were observed in any of the mice. Carbon Dioxide exposure assay. Animals were placed in a similar transparent box as the heated floor assay. Mice were acclimated to the environment for three days (10 minutes exposure). The next day mice were exposed either to infusions of air or of 15% CO 2 . The concentration of CO 2 was measured and dynamically adjusted by the ProCO 2 120 controller (Biospherix, Parish, NY, USA) so that CO 2 levels are maintained at 15%. This concentration of CO 2 elicited escape jumps in all mice tested. The number of escape jumps in 10 minutes was recorded. Heated floor pain sensitivity assay. We used the same apparatus described for the Heated floor exposure assay above. For this assay the floor was heated at 55°C, which is sufficient to cause pain-related reactions in most mice (paw licking or jumping) within one minute. The latency to display a pain-related reaction was recorded. All mice showed pain responses within 30 seconds. Light Delivery for optogenetics. For PMd-cck ChR2 mice, blue light was generated by a 473 nm laser (Dragon Lasers, Changchun Jilin, China) at 4.5 mW unless otherwise indicated. Light power was decreased to 2 mW in the nose poke assay to avoid overt escape behaviors. For Figure S7 5 mW was used. For Figure S6G we used 0.5, 2 and 7 mW to test a wide variety of light powers to study dlPAG-induced escape in the upwards step box. Green light was generated by a 532 nm laser (Dragon Lasers), and bilaterally delivered to mice at 10 mW. A Master-8 pulse generator (A.M.P.I., Jerusalem, Israel) was used to drive the blue laser at 20 Hz. This stimulation pattern was used for all ChR2 experiments. The laser output was delivered to the animal via an optical fiber (200 μm core, 0.22 numerical aperture, Doric Lenses, Canada) coupled to the fiberoptic implanted on the animals through a zirconia sleeve. Escape from custom-built contexts. All measurements are written as length x width x height in cm. In the empty box assay mice were placed in an empty open field (46 × 46 × 36 cm). Mice were unable to escape from the empty open field as the walls are too high to be jumped over. In the rope climb assay a climbing rope was attached to the same open field used in the empty box assay, connecting the floor to the top of the wall. In the upwards climb assay the rope was removed and an escape path using plastic blocks was placed in the open field. For the rope climb and upwards climb assays the final step in the escape required jumping from the top of the open field (36 cm high) to the floor. For the downwards escape assay blocks were arranged in a staircase-type pattern, and required a jump to exit the last block and land on the floor. The last block was 20 cm higher than the floor. For all escapable assays, a successful escape was recorded only when the mouse was no longer present in the context at the end of 5 minutes. The animals had no habituation, familiarization or training in any of these assays prior to the experiments. For the inescapable empty box, blue light stimulation to PMd-cck mice expressing cre-dependent YFP or ChR2 was done in alternating 3 minute light ON and OFF epochs for a total of 9 minutes (total of 1 ON and 2 OFF epochs). In all other escape assays, blue light stimulation was done in alternating 30 seconds light ON and OFF epochs (total of five ON and five OFF epochs). Nose-poke assay. An Arduino board was programmed to trigger 20 Hz 5ms laser trains (473 nm, Dragon Lasers) continuously, unless PMd-cck mice expressing ChR2 nose-poked into a port. Pokes were detected by an infrared beam break sensor (Adafruit, cat# 2168, New York City. NY, USA) that is coupled to the Arduino board. When a beam break occurs due to a nose poke the Arduino board halts triggering laser pulses for 5 seconds. Nose poke times were outputted by the Arduino board to a desktop running Coolterm ( https://freeware.the-meiers.org/ ) to record arduino time point outputs. Place aversion test. Mice were placed in a two-chamber context (20 × 42 × 27 cm) for 10 minutes to freely explore the environment. Both chambers are identical. During the next 10 minutes blue light was delivered to the PMd of cck-cre mice expressing either ChR2 or YFP (20 Hz 5ms pulses, 4.5 mW) when they entered one of the chambers. The chamber preferred by the animal during baseline exploration was chosen as the stimulated chamber. Laser stimulation was only delivered during exploration of the simulation chamber. Following 10 minutes of rest in the home cage mice were reintroduced to the context for 10 minutes to measure if PMd stimulation conditioned aversion to the stimulated chamber. The amount of time mice explored both chambers was tracked across all three epochs (baseline, stimulation and post-stimulation epochs). Pupil size measurements. Pupil size was measured with the same set up and methods described previously ( Lovett-Barron et al., 2017 ). Briefly, a camera (AVT Manta, G-032B) coupled to a24 mm/F1.4 lens was used to image the eye under infrared illumination (Thorlabs M780F2). Video was acquired at 60 Hz using pymba, a Python wrapper for AVT camera control. Frame acquisition times and the behavioral task were synchronized with a National Instruments DAQ (NI PCIe-6323). Pupil size was measured from the video using custom-written Matlab scripts. Each trial lasted 30 seconds. Blue light was delivered to the PMd at 20 Hz, 5ms pulses for 10 seconds following a 10 second baseline recording. Another 10 seconds were recorded post-stimulation. Respiratory and heart rate measurements. Respiratory rate and heart rate were measured with pulse oximetry as described elsewhere ( Adhikari et al., 2015 ) (MouseOx Plus; Starr Life Sciences, Alllison Park, PA, USA). Data was collected on a computer with MouseOx Plus software. Mice were shaved in the area surrounding the neck and acclimated to moving with the collar sensor used to by the pulse oximeter for four days. Additionally, mice were handled for three days prior to experimenting. Respiratory rate was recorded as a moving average of 10 measurements recorded at 1 Hz. Heart rate was recorded as a moving average of 5 heart beats. Recordings were obtained in head-fixed mice under very light (0.2%) isoflurane anesthesia to avoid motion artifacts in the signal. Cat Exposure Test for fos expression. The experimental apparatus was made of clear Plexiglas and consisted of a 20 × 30 × 40 cm home cage connected to another 40 × 30 × 40 cm chamber (the food compartment) by a hallway that was 10 cm wide, 25 cm long, and 25 cm high. Between the home cage and the hallway, there was a sliding door that remained closed most of the time, except when the animals were enabled to explore the rest of the apparatus. For 10 days before the cat exposure, each animal was isolated and remained in the home cage. During the middle of the light phase, the home cage door was opened, and the animals were allowed to explore the rest of the apparatus and obtain food pellets stored in the food compartment (habituation). On the 11th day, a neutered 2-year-old male cat was placed and held in the food compartment by an experimenter as the mouse’s home cage door was opened, and the animals were exposed for 10 minutes to the cat. Animals exposed to the cat presented clear innate defensive responses: at the beginning of the test, they explored the apparatus, presenting clear risk assessment responses, and the animals immediately fled back to the home cage, where they largely stayed frozen for the remainder of the test. The control group was handled identically as the cat-exposed group, but on the 11th day, the food compartment was empty, and the mice were not exposed to the cat. No food pellets were offered during the test period. Ninety minutes after ending the behavioral testing, the animals were deeply anesthetized with sodium pentobarbital (Cristalia; Itapira, SP, Brazil; 40 mg/kg, i.p.), and the brains were processed for histology and Fos immunohistochemistry Rat Exposure Test for fos expression. The experimental protocol was very similar to the cat exposure test. In brief, instead of the cat, we used two male adult Long-Evans rats with their bedding in the food compartment. The mice also displayed innate defensive behaviors and they were perfused ninety minutes after ending the behavioral test. Since the behavioral apparatus and procedures were the same for the cat and rat exposure test, the control group (already described) was used as reference for both experimental groups. Hypercapnia Test for fos expression. For this test, after being habituated during 10 days in the hypercapnia box under room air conditions (0.04% CO 2 , 21% O 2 ), the mice were submitted to hypercapnia conditions (15% CO 2 , 21% O 2 ) for 10 minutes. The control group was just exposed to room air conditions. The animals were perfused ninety minutes after the test. Fos Immunohistochemistry and Histology. Animals were perfused and the brains later frozen and cut on a sliding microtome in the frontal plane. One series of sections was processed for immunohistochemistry with anti-Fos antiserum raised in rabbit (c-fos(Ab-5); EMD Millipore;#PC38) at a dilution of 1:20 000. The primary antiserum was detected using a variation of the avidin—biotin complex system. In brief, sections were incubated for 90 minutes at room temperature in a solution of biotinylated goat antirabbit IgG (Vector Laboratories,#BP-9100) and then placed in the mixed avidin–biotin horseradish peroxidase complex solution (ABC Elite Kit; Vector Laboratories,#PK-6105) for the same period. The peroxidase complex was visualized by a five-minute exposure to a chromogen solution containing 0.02% 3,30 diaminobenzidine tetrahydrochloride (DAB; Sigma) with 0.3% nickel–ammonium sulfate in 0.05 M Tris buffer (pH 7.6) followed by incubation for 20 minutes in chromogen solution with hydrogen peroxide (1:3000), which produced a blue-black product. The reaction was stopped by extensive washing in 0.02 M KPBS (pH 7.4). Sections were mounted on gelatin-coated slides and then dehydrated and coverslipped with DPX (Sigma). An adjacent series was always stained with thionin to serve as a reference series for cytoarchitectonic purposes. Quantification of Fos-Labeled Cells. The density of Fos immunoreactive neurons was evaluated by an observer without knowledge of the animal’s experimental group. Images were generated for selected regions using the 10x objective of a Nikon Eclipse 80i (Nikon Corporation, ChiyodaKu, Tokyo-To, Japan) microscope equipped with a Nikon digital camera DXM1200F (Nikon Corporation). To quantify the density of Fos labeling, we first delineated the borders of the selected regions in a given section as defined in adjoining Nissl stained sections. Fos-labeled cells were then counted therein. Only darkly labeled oval nuclei that fell within the borders of a region of interest were counted. The density of Fos labeling was determined by dividing the number of Fos-immunoreactive cells by the area of the region of interest. Both cell counting and area measurements were performed with the aid of a computer program (Image-Pro Plus, version 4.5.1; Media Cybernetics, Silver Spring, MD, USA). Cell densities were obtained on both sides of the brain and averaged for each mouse. The brain regions examined in the present investigation followed the Brain Maps: Structure of the Rat Brain. Miniscope video capture. All videos were recorded at 30 frames/sec using a Logitech HD C310 webcam and custom-built head-mounted UCLA miniscope ( Cai et al., 2016 ). Open-source UCLA Miniscope software and hardware ( http://miniscope.org/ ) were used to capture and synchronize neural and behavioral video ( Cai et al., 2016 ). Retrobead tracing. Retrobeads (LumaFluor) (30 nL) were injected in the dlPAG diluted 6 times using a 10 μl nanofil syringe (World Precision Instruments) at 40 nl/min. The syringe was coupled to a 33-gauge beveled needle, and the bevel was placed to face the anterior side of the animal. The syringe was slowly retracted 20 minutes after the start of the infusion. Fiber photometry. Photometry was performed as described in detail previously ( Kim et al., 2016 ). Briefly, we used a 405-nm LED and a 470-nm LED (Thorlabs, M405F1 and M470F1) for the Ca 2+ -dependent and Ca 2+ independent isosbestic control measurements. The two LEDs were band-pass filtered (Thorlabs, FB410–10 and FB470–10) and then combined with a 425-nm long-pass dichroic mirror (Thorlabs, DMLP425R) and coupled into the microscope using a 495-nm long-pass dichroic mirror (Semrock, FF495-Di02–25 ×36). Mice were connected with a branched patch cord (400 μm, Doric Lenses, Quebec, Canada) using a zirconia sleeve to the optical system. The signal was captured at 20 Hz (alternating 405-nm LED and 470-nm LED). To correct for signal artifacts of a non biological origin (i.e. photo-bleaching and movement artifacts), custom Matlab scripts leveraged the reference signal (405-nm), unaffected by calcium saturation, to isolate and remove these effects from the calcium signal (470-nm). Perfusion and histological verification. Mice were anesthetized with Fatal-Plus and transcardially perfused with phosphate buffered saline followed by a solution of 4% paraformaldehyde. Extracted brains were stored for 12 hs at 4°C in 4% paraformaldehyde. Brains were then placed in sucrose for a minimum of 24 hs. Brains were sectioned in the coronal plane in a cryostat, washed in phosphate buffered saline and mounted on glass slides using PVA-DABCO. Images were acquired using a Keyence BZ-X fluorescence microscope with a 10 or 20X air objective.
QUANTIFICATION AND STATISTICAL ANALYSIS
Behavioral quantification. To extract the pose of freely-behaving mice in the described assays, we implemented DeepLabCut ( Nath et al., 2019 ), an open-source convolutional neural network-based toolbox, to identify mouse nose, ear and tail base xy-coordinates in each recorded video frame. These coordinates were then used to calculate velocity and position at each timepoint, as well as classify behaviors such as climbs, jumps, escape runs and freezes in an automated manner using custom Matlab scripts. Specifically: Rat Assay: ‘Climbs’ were classified as epochs for which (1) the vertical speed of the mouse nose and tail base exceeded 2 cm/s, as this threshold correctly identified all empirically observed climbs, and (2) the start and end points of these epochs, defined by mouse nose coordinates, were respectively below and above an experimenter-defined climbing area bounding box. ‘Escape runs’ were defined as epochs for which (1) the mouse was not located in the upper burrow or ladder area and (2) the mouse speed away from the rat or toy rat exceeded 2 cm/s. As there was little room for acceleration between the rat and opposite wall, the speed threshold was set to this relatively low value. ‘Stretch-attend postures’ were defined as epochs for which (1) the distance between mouse nose and tail base exceeded a distance of approximately 1.2 mouse body lengths and (2) mouse tail base speed fell below 1 cm/s. Heated Plate and CO 2 : ‘Climbs’ were identified as epochs for which (1) the vertical speed of the mouse nose and tail base coordinates both exceeded 2 cm/s within an experimenter-defined cylindrical mesh bounding box, and fell below 10 cm/s to exclude higher velocity jumps, and (2) the start and end points of these epochs, defined by mouse nose and tail base coordinates, were respectively below and above the lower edge of this bounding box. CO 2 : ‘Jumps’ were identified as epochs for which (1) the vertical speed of the mouse nose and tail base exceeded 15 cm/s and (2) the start and end points of these epochs, defined by mouse nose and tail base coordinates, were respectively below and above an experimenter-defined bounding box of the enclosure floor. All assays: ‘Pauses’ were defined as periods for which mouse tail base speed fell below 1 cm/s for at least 0.33 s. ‘Freezes’ were defined as periods for which mouse nose and tail base speed fell below 0.25 cm/s for at least 0.33 s ( Schuette et al., 2020 ). All behaviors were manually checked by the experimenters for error. Miniscope postprocessing. The open-source UCLA miniscope analysis package ( https://github.com/daharoni/Miniscope_Analysis ) ( Aharoni and Hoogland, 2019 ) was used to motion correct miniscope videos. They were then temporally down sampled by a factor of four and spatially down sampled by a factor of two. The cell activity and footprints were extracted using the open-source package Constrained Nonnegative Matrix Factorization for microEndoscopic data (CNMF-E; https://github.com/zhoupc/CNMF_E ) ( Schuette et al., 2020 ; Zhou et al., 2018 ). Only cells whose variance was greater than or equal to 25% of the maximum variance among non-outliers were used in the analysis. Neural state identification. A Hidden Markov Model (HMM) was used to identify escape-related states from the neural data in an unsupervised manner (For the code, see ‘Expectation-Maximization for HMMs using real-values Gaussian observations’ at Zoubin Ghahramani’s code base: http://mlg.eng.cam.ac.uk/zoubin/software.html ). This unsupervised approach identifies ‘hidden states,’ or states that are strongly represented in the neural data, without any additional information about animal behavior. We implemented the model by specifying either two or six of these ‘hidden states.’ The state with the most corresponding escapes was labelled the ‘escape state.’ All sessions for each assay were concatenated, and accuracy was calculated as the percent of escape indices to co-occur with this escape state. To determine chance level, we built a bootstrapped distribution of accuracies (1000 iterations), randomly selecting indices (the same number as escape indices) and calculating the percent that co-occurred with the escape cluster by chance. Chance level was defined as the 95th percentile of the resulting distribution. To determine whether the HMM results agree with those of other unsupervised techniques, we also implemented k-means clustering to identify escape-related clusters in the neural data. We used the k -means algorithm ( k =2) to cluster the top principal components of the neural data (accounting for >=80% of the total variance). The escape cluster, escape prediction accuracy, and chance accuracy were calculated as described above for the HMM analysis. Behavior decoding using PMd neural data. Discrete classification of escape behavior was performed using multinomial logistic regression. Timepoints preceding and following escape by 5 seconds were labelled ‘escape,’ and a matched number of non-escape timepoints were randomly selected for training and validation. Each time point was treated as an individual data point. Training and validation were performed using 5-fold cross-validation, with a minimum of 5 seconds between training and validation sets. As equal numbers of escape and non-escape samples were used to build the training and validation sets, chance accuracy was 50%. Sessions with less than 5 escapes were excluded from the analysis. Escape cell classification. To classify PMd cells as escape-encoding (specifically, climbs in the rat and heated plate assay and jumps in 15% CO 2 ), we used a generalized linear model (GLM) to identify cells that showed increased calcium activity during escape behavior. We fit this model to each cell’s activity, with escape indices as the predictor variable and escape coefficient as the measure of fit. Escape onset times were then randomized 100 times and a bootstrap distribution built from the resulting GLM coefficients. A cell was considered an escape cell if its coefficient exceeded 95% of the bootstrap coefficient values. Calcium peak identification. For calcium data preceding and following escape by 10 seconds, peaks were identified as samples that were larger than their neighboring samples by a specified amount (Matlab function ‘findpeaks’ with ‘MinPeakProminence’ set to 0.4). Dual photometry correlation analysis. The nonparametric Spearman method was used to correlate the session length PMd/dlPAG and PMd/amv fiber photometry signals in threat and control assays. Statistics. Two-way repeated measures ANOVA was used, followed by Wilcoxon rank-sum post-hoc tests, unless otherwise stated. Two-tailed tests were used throughout with α=0.05. Variance equality was tested using the F-test. Asterisks in the Figure s indicate the p values for the post-hoc test. Standard error of the mean was plotted in each Figure as an estimate of variation. Multiple comparisons were adjusted with the false discovery rate method. See complete statistical data for all Figures on Supplementary Table S1 .
Materials Availability
This study did not generate new unique reagents.
EXPERIMENTAL MODEL AND SUBJECT DETAILS
All procedures conformed to guidelines established by the National Institutes of Health and have been approved by the University of California, Los Angeles Institutional Animal Care and Use Committee or by the University of Sao Paulo Animal Bioethics committee. Mice. Cck-IRES-Cre mice (Jackson Laboratory stock No. 012706), SF1-cre (Jackson Laboratory stock No. 012462) and wild type C57BL/6J mice (Jackson Laboratory stock No. 000664) were used for all experiments. Male and female mice between 2 and 6 months of age were used in all experiments. Mice were maintained on a 12-hour reverse light-dark cycle with food and water ad libitum. Sample sizes were chosen based on previous behavioral optogenetics studies on defensive behaviors, which typically use 6–15 mice per group. All mice were handled for a minimum of 5 days prior to any behavioral task. Rats. Male Long-Evans rats (250–400 grams) were obtained from Charles River Laboratories and were individually housed on a standard 12-hour light-dark cycle and given food and water ad libitum. Rats were only used as a predatory stimulus. Rats were handled for several weeks prior to being used and were screened for low aggression to avoid attacks on mice. No attacks on mice were observed in this experiment.
METHOD DETAILS Viral Vectors. Optogenetics: The following adeno-associated viral vectors (AAV), used in the optogenetic experiments, were purchased from Addgene (Watertown, MA): AAV9.hSyn.eGFP.WPRE.bGH, AAV9.Syn.DIO.EGFP.WPRE.hGH, AAV9.hSyn.hChR2.(H134R)-eYFP.WPRE.hGH, AAV9.EF1a.DIO.hChR2(H134R)-eYFP.WPRE.hGH, AAV9-EF1a-DIO-eYFP and AAV9-FLEX-Arch-GFP. Chemogenetics: The following AAVs, used in the chemogenetic experiments, were purchased from Addgene: pAAV8-hSyn-DIO-hM4D(Gi)-mCherry, AAV8.Syn.DIO.HM3D(Gq)-mCherry, and AAV8.Syn.DIO.mCherry. Fiber Photometry: AAV9.Syn.GCaMP6s.WPRE.SV40 and AAV9.Syn.FLEX.GCaMP6s.WPRE.SV40, used in the fiber photometry experiments, were purchased from Addgene. Surgeries. Surgeries were performed as described previously ( Adhikari et al., 2015 ). Eight-week-old mice were anaesthetized with 1.5–3.0% isoflurane and placed in a stereotaxic apparatus (Kopf Instruments). A scalpel was used to open an incision along the midline to expose the skull. After performing a craniotomy, 40 nl of AAV9.hSyn.hChR2.(H134R)-eYFP.WPRE.hGH at a titer of 2*1012 particles/ml was injected per site (PMd or other hypothalamic and brainstem nuclei) using a 10 μl nanofil syringe (World Precision Instruments) at 0.08 μl/min. The syringe was coupled to a 33-gauge beveled needle, and the bevel was placed to face the anterior side of the animal. The syringe was slowly retracted 20 minutes after the start of the infusion. Mice received unilateral viral infusion and fiber optic cannula implantation. Infusion locations measured as anterior-posterior, medial-lateral and dorso-ventral coordinates from bregma were: anterior hypothalamus (−0.7, −0.4, −5.2), dorsomedial hypothalamus (−1.94, −0.5, −5.3), ventromedial hypothalamus (−1.5, −0.4, −5.5), lateral hypothalamus (−2.46, −1.1, −5.2) dorsolateral periaqueductal gray (dlPAG) (−4.75, −0.45, −1.9), posterior hypothalamus (−2.30, −0.3, −4.5), dorsal premammillary nucleus (PMd) (−2.46, −0.5, −5.35). For arch experiments and dual photometry assays the dlPAG coordinates were (−4.6, −1.05, −2.1 using a 15-degree angle). Fiber optic cannula (0.22 NA, 200 μm diameter; Doric Lenses) were implanted unilaterally 0.15 mm above the viral infusion sites. Only mice with opsin expression restricted to the intended targets were used for behavioral assays. For optogenetic experiments in PMd-cck mice, the same PMd coordinates were used to inject 0.16 uL of AAV9.EF1a.DIO.hChR2(H134R)-eYFP.WPRE.hGH or AAV9.EF1a.DIO.eYFP.WPRE.hGH. For chemogenetic experiments mice received 0.16 uL of pAAV8-hSyn-DIO-hM4D(Gi)-mCherry, AAV8.Syn.DIO.HM3D(Gq)-mCherry, or AAV8.Syn.DIO. mCherry in the PMd or dorsomedial hypothalamus coordinates. Similar AAV8-based vectors have been validated and used by numerous other researchers ( Hardaway et al., 2019 ; Jiang-Xie et al., 2019 ; Shen et al., 2019 ; Wang et al., 2019 ). For photometry experiments mice were injected with 0.16 uL of AAV9.Syn.GCaMP6s.WPRE.SV40 and AAV9.Syn.Flex.GCaMP6s.WPRE.SV40 in the dlPAG and PMd, respectively of cck-cre mice. Mice were implanted unilaterally with cannulae in the PMd and the dlPAG. A 400 μm diameter, 0.48 NA optical fiber (Neurophotometrics) was used for photometry experiments. Adhesive cement (C&B metabond; Parkell, Edgewood, NY, USA) and dental cement (Stoelting, Wood Dale, IL, USA) were used to securely attach the fiber optic cannula to the skull. Half the mice in each cage were randomly assigned to YFP/mcherry or ChR2 /Arch/hM4Di/hM3Dq groups. For miniaturized microscope experiments 40 nL of AAV9-DIO-GCaMP6s was injected in the PMd of cck-cre mice and a GRIN lens was implanted 200 uM above the infusion site. Three weeks following surgery animals were base-plated. The rats used in this study were obtained from a partner lab and never optogenetically stimulated during the described assays. The rats had fiber optic cannulae implants from prior unrelated experiments. For details of the surgery, see ( Malvaez et al. ). Briefly, rats were anesthetized with isoflurane and bilaterally infused with AAV5-CaMKIIa-hChR2(H134R)-eYFP or AAV8-CaMKIIa-eYFP. Viral infusion (0.30 μl) was performed at a rate of 6 μl/hr by an infusion needle at the lateral or medial orbitofrontal cortex. Optical fibers (200 μm core, numerical aperture 0.66; Prizmatix, Southfield, MI) positioned in ferrules (Kientec Systems Inc., Stuart, FL) were implanted 0.3 mm above the basolateral amygdala (AP −3.0 mm, ML ± 5.1, DV −7.7). In situ hybridization. Cck-IRES-Cre mice (Jackson Laboratory stock No. 012706) were euthanized with 5% isoflurane followed by cervical dislocation. Brains were harvested and snap-frozen in 2-methylbutane at −20°C and tissue was sectioned at 18 μm. The workflow was performed in accordance with the manufacturer’s protocol for the RNAScope® Multiplex Fluorescent Assay (Advanced Cell Diagnostics, Newark, CA). Riboprobes selective for sequences were labeled as follows: Cre (C1, Cat. No. 312281), nNOS with (437651-C2) and NeuN (Mm-Rbfox3-C3, Cat No. 313311-C3) or VGLUT2 (Mm-Slc17a6-C3, Cat No. 319171-C3). Images were obtained with a Leica DM5500 fluorescent microscope at 40x. Immunostaining for NeuN. Fixed brains were kept in 30% sucrose at 4oC overnight, and then sectioned on a cryostat (40 μm) slices. Sections were washed in PBS and incubated in a blocking solution (3% normal donkey serum and 0.3% triton-x in PBS) for 1 hour at room temperature. Sections were then incubated at 4oC for 12 hours with polyclonal anti-NeuN antibody made in rabbit (1/500 dilution) (CAT# NBP1-77686SS, Novusbio) in blocking solution. Following primary antibody incubation sections were washed in PBS 3 times for 10 minutes, and then incubated with anti-rabbit IgG (H+L) antibody (1/500 dilution) conjugated to Alexa Fluor 594 (red) (CAT# 8889S, cellsignal.com ) for 1 hour at room temperature. Sections were washed in PBS 3 times for 10 minutes, incubated with DAPI (1/50000 dilution in PBS), washed again in PBS and mounted in glass slides using PVA-DABCO (Sigma). Acute brain slice preparation and electrophysiological recordings. Acute brain slices preparation and electrophysiological recordings were performed using standard methods as previously described( Nagai et al., 2019 ). Briefly, Cck-Cre+ mice that had received AAV microinjections into PMd were deeply anesthetized with isoflurane and decapitated with sharp shears. The brains were placed and sliced in ice-cold modified artificial CSF (aCSF) containing the following (in mM): 194 sucrose, 30 NaCl, 4.5 KCl, 1 MgCl 2 , 26 NaHCO 3 , 1.2 NaH2PO 4 , and 10 D-glucose, saturated with 95% O 2 and 5% CO 2 . A vibratome (DSK-Zero1) was used to cut 300 μm brain sections. The slices were allowed to equilibrate for 30 minutes at 32–34°C in normal aCSF containing (in mM); 124 NaCl, 4.5 KCl, 2 CaCl 2 , 1 MgCl 2 , 26 NaHCO 3 , 1.2 NaH 2 PO 4 , and 10 D-glucose continuously bubbled with 95% O 2 and 5% CO 2 . Slices were then stored at 21–23°C in the same buffer until use. All slices were used within 2–6 hours of slicing. Slices were placed in the recording chamber and continuously perfused with 95% O 2 and 5% CO 2 bubbled normal aCSF. pCLAMP10.4 software and a Multi-Clamp 700B amplifier was used for electrophysiology (Molecular Devices). Whole-cell patch-clamp recordings were made from neurons in the PMd or dorsolateral PAG (dlPAG) using patch pipettes with a typical resistance of 4–5 MΩ. Neurons were selected based on reporter fluorescence, i.e. YFP for ChR2-YFP and mCherry for hM3Dq-mCherry or hM4Di-mCherry. The intracellular solution for recordings comprised the following (in mM) : 135 potassium gluconate, 5 KCl, 0.5 CaCl 2 , 5 HEPES, 5 EGTA, 2 Mg-ATP and 0.3 Na-GTP, pH 7.3 adjusted with KOH. The initial access resistance values were < 20 MΩ for all cells; if this changed by > 20% the cell was discarded. Light flashes (0.2 mW/mm2) from a blue LED light source (Sutter Instruments) were delivered via the microscope optics and a 40x water immersion objective lens and controlled remotely using TTL pulses from Clampex. Cell responses were recorded in whole-cell mode and recorded using an Axopatch 700B amplifier connected via a digitizer to a computer with pCLAMP10 software. To stimulate ChR2 expressed in PMd neurons or axons, 5 ms pulses were delivered at inter-pulse intervals of 200 ms, 50 ms or 25 ms for 5, 20 or 40 Hz optical stimulations, respectively. To assess PMd-dlPAG synaptic transmission, dlPAG neurons in the vicinity of ChR2-expressing PMd axons were patched. To isolate light-evoked EPSCs, neurons were voltage-clamped at −70 mV and pre-incubated with 10 μM bicuculline, an antagonist for GABA A receptors, for 5 minutes before recording. To block AMPA receptor-mediated EPSCs, 20 μM cyanquixaline (CNQX, 6-cyano-7-nitroquinoxaline-2,3-dione) was applied in the bath. The voltage-gated sodium channel blocker tetrodotoxin (TTX, 0.3 μM) was included in the bath to demonstrate action potential-dependent ChR2-mediated transmitter release. To examine direct (monosynaptic) release of glutamate by PMd axons to dlPAG neurons, EPSCs were measured in the presence of TTX and the voltage-gated K+ channel blocker 4-aminopyridine (4AP, 500 μM) for enhancing ChR2-mediated depolarization of terminals. 5 μM CNO was applied in the bath to stimulate Gq-DREADD hM3Dq or Gi-DREADD hM4Di expressed in PMd neurons. In some cases, 1 mg/ml biocytin (Tocris, 3349) was added to the intracellular solution to subsequently visualize patched neurons.
Immunohistochemistry
(IHC) for acute sections. 300 μm fresh brain slices were placed into 10% buffered formalin overnight at 4°C and processed as follows for IHC. Sections were washed 3 times in 0.1 M PBS with 2% Triton-X 100 for five minutes each, and then incubated in a blocking solution containing 10% NGS in 0.1 M PBS with 1% Triton-X 100 for 1 hr at room temperature with gentle agitation. Sections were then incubated with streptavidin conjugated Alexa 647 (1:250) diluted in 0.1 M PBS with 0.4% Triton-X 100 for overnight at 4°C. The sections were rinsed 3 times in 0.1 M PBS for 10 minutes each before being mounted on microscope slides in fluoromount-G. Images were obtained with the confocal microscopy using a commercial confocal laser scanning microscope (FV1000, Olympus). Behavior video capture. All behavior videos were captured at 30 frames/sec in standard definition (640×480) using a Logitech HD C310 webcam. To capture fiber-photometry synchronized videos, both the calcium signal and behavior were recorded by the same computer using custom Matlab scripts that also collected timestamp values for each calcium sample/behavioral frame. These timestamps were used to precisely align neural activity and behavior. Chemogenetics. Mice used for chemogenetic experiments were exposed to each threat and control stimuli twice, once following treatment with saline and once following treatment with CNO (5 mg/kg, injected intraperitoneally) 40 minutes prior to the experiment. Only one control or threat-exposure assay was performed per day with each mouse. Rat exposure assay. We used a corridor measuring (35 × 20 × 22 cm). At the end of the corridor there is a vertical wall with a wire mesh (with 1 cm x 1 cm square spaces in the mesh). Mice can use the mesh as a ladder to climb the vertical wall (22 cm height) and access a burrow. Mice were acclimated to this environment for three days for 10 minutes. Mice freely explored and independently climbed up the grid ladder. By the end of ten-minute acclimation mice climbed the ladder on their own without being touched by the experimenter’s hand. The next day they were exposed either to a toy rat or a live rat for 20 minutes. The rat is restrained to the corner opposite to the mesh grid by a harness attached to a string that is taped to the wall. Mice could climb to avoid the rat and hide in the burrow. After reaching the burrow mice were given 1 minute of hiding time in the burrow. They were then gently placed back in the bottom floor of the context in the same level as the rat (or toy rat). The number of climbs performed during 20 minutes was recorded. This length of 20 minutes includes the 1-minute hiding periods in the burrow. Heated floor exposure assay. The assay was done on top of a metallic heating plate (14 × 14 cm) (Faithful Magnetic Stirrer model SH-3) that was heated at either 43°C or was at room temperature (20–25°C). A transparent box (14 × 14 × 24 cm) was placed on top of the heated plate. A cylindrical metal mesh was placed that could be used for the mouse to climb to avoid the heat. The mouse was acclimated to this environment for three days (20-minute exposure). The next day the mouse was placed in this environment in either heated or room temperature floor. Mice climb the cylinder to avoid the heat and then go back to the heated floor as they cannot support their weight while hanging on the cylinder for extended time periods. The number of climbs performed in 20 minutes was measured. We chose 43°C because it is a temperature that caused escape climbs but that is not sufficient to cause pain or skin damage. No pain-related reactions such as paw licking were observed in any of the mice. Carbon Dioxide exposure assay. Animals were placed in a similar transparent box as the heated floor assay. Mice were acclimated to the environment for three days (10 minutes exposure). The next day mice were exposed either to infusions of air or of 15% CO 2 . The concentration of CO 2 was measured and dynamically adjusted by the ProCO 2 120 controller (Biospherix, Parish, NY, USA) so that CO 2 levels are maintained at 15%. This concentration of CO 2 elicited escape jumps in all mice tested. The number of escape jumps in 10 minutes was recorded. Heated floor pain sensitivity assay. We used the same apparatus described for the Heated floor exposure assay above. For this assay the floor was heated at 55°C, which is sufficient to cause pain-related reactions in most mice (paw licking or jumping) within one minute. The latency to display a pain-related reaction was recorded. All mice showed pain responses within 30 seconds. Light Delivery for optogenetics. For PMd-cck ChR2 mice, blue light was generated by a 473 nm laser (Dragon Lasers, Changchun Jilin, China) at 4.5 mW unless otherwise indicated. Light power was decreased to 2 mW in the nose poke assay to avoid overt escape behaviors. For Figure S7 5 mW was used. For Figure S6G we used 0.5, 2 and 7 mW to test a wide variety of light powers to study dlPAG-induced escape in the upwards step box. Green light was generated by a 532 nm laser (Dragon Lasers), and bilaterally delivered to mice at 10 mW. A Master-8 pulse generator (A.M.P.I., Jerusalem, Israel) was used to drive the blue laser at 20 Hz. This stimulation pattern was used for all ChR2 experiments. The laser output was delivered to the animal via an optical fiber (200 μm core, 0.22 numerical aperture, Doric Lenses, Canada) coupled to the fiberoptic implanted on the animals through a zirconia sleeve. Escape from custom-built contexts. All measurements are written as length x width x height in cm. In the empty box assay mice were placed in an empty open field (46 × 46 × 36 cm). Mice were unable to escape from the empty open field as the walls are too high to be jumped over. In the rope climb assay a climbing rope was attached to the same open field used in the empty box assay, connecting the floor to the top of the wall. In the upwards climb assay the rope was removed and an escape path using plastic blocks was placed in the open field. For the rope climb and upwards climb assays the final step in the escape required jumping from the top of the open field (36 cm high) to the floor. For the downwards escape assay blocks were arranged in a staircase-type pattern, and required a jump to exit the last block and land on the floor. The last block was 20 cm higher than the floor. For all escapable assays, a successful escape was recorded only when the mouse was no longer present in the context at the end of 5 minutes. The animals had no habituation, familiarization or training in any of these assays prior to the experiments. For the inescapable empty box, blue light stimulation to PMd-cck mice expressing cre-dependent YFP or ChR2 was done in alternating 3 minute light ON and OFF epochs for a total of 9 minutes (total of 1 ON and 2 OFF epochs). In all other escape assays, blue light stimulation was done in alternating 30 seconds light ON and OFF epochs (total of five ON and five OFF epochs). Nose-poke assay. An Arduino board was programmed to trigger 20 Hz 5ms laser trains (473 nm, Dragon Lasers) continuously, unless PMd-cck mice expressing ChR2 nose-poked into a port. Pokes were detected by an infrared beam break sensor (Adafruit, cat# 2168, New York City. NY, USA) that is coupled to the Arduino board. When a beam break occurs due to a nose poke the Arduino board halts triggering laser pulses for 5 seconds. Nose poke times were outputted by the Arduino board to a desktop running Coolterm ( https://freeware.the-meiers.org/ ) to record arduino time point outputs. Place aversion test. Mice were placed in a two-chamber context (20 × 42 × 27 cm) for 10 minutes to freely explore the environment. Both chambers are identical. During the next 10 minutes blue light was delivered to the PMd of cck-cre mice expressing either ChR2 or YFP (20 Hz 5ms pulses, 4.5 mW) when they entered one of the chambers. The chamber preferred by the animal during baseline exploration was chosen as the stimulated chamber. Laser stimulation was only delivered during exploration of the simulation chamber. Following 10 minutes of rest in the home cage mice were reintroduced to the context for 10 minutes to measure if PMd stimulation conditioned aversion to the stimulated chamber. The amount of time mice explored both chambers was tracked across all three epochs (baseline, stimulation and post-stimulation epochs). Pupil size measurements. Pupil size was measured with the same set up and methods described previously ( Lovett-Barron et al., 2017 ). Briefly, a camera (AVT Manta, G-032B) coupled to a24 mm/F1.4 lens was used to image the eye under infrared illumination (Thorlabs M780F2). Video was acquired at 60 Hz using pymba, a Python wrapper for AVT camera control. Frame acquisition times and the behavioral task were synchronized with a National Instruments DAQ (NI PCIe-6323). Pupil size was measured from the video using custom-written Matlab scripts. Each trial lasted 30 seconds. Blue light was delivered to the PMd at 20 Hz, 5ms pulses for 10 seconds following a 10 second baseline recording. Another 10 seconds were recorded post-stimulation. Respiratory and heart rate measurements. Respiratory rate and heart rate were measured with pulse oximetry as described elsewhere ( Adhikari et al., 2015 ) (MouseOx Plus; Starr Life Sciences, Alllison Park, PA, USA). Data was collected on a computer with MouseOx Plus software. Mice were shaved in the area surrounding the neck and acclimated to moving with the collar sensor used to by the pulse oximeter for four days. Additionally, mice were handled for three days prior to experimenting. Respiratory rate was recorded as a moving average of 10 measurements recorded at 1 Hz. Heart rate was recorded as a moving average of 5 heart beats. Recordings were obtained in head-fixed mice under very light (0.2%) isoflurane anesthesia to avoid motion artifacts in the signal. Cat Exposure Test for fos expression. The experimental apparatus was made of clear Plexiglas and consisted of a 20 × 30 × 40 cm home cage connected to another 40 × 30 × 40 cm chamber (the food compartment) by a hallway that was 10 cm wide, 25 cm long, and 25 cm high. Between the home cage and the hallway, there was a sliding door that remained closed most of the time, except when the animals were enabled to explore the rest of the apparatus. For 10 days before the cat exposure, each animal was isolated and remained in the home cage. During the middle of the light phase, the home cage door was opened, and the animals were allowed to explore the rest of the apparatus and obtain food pellets stored in the food compartment (habituation). On the 11th day, a neutered 2-year-old male cat was placed and held in the food compartment by an experimenter as the mouse’s home cage door was opened, and the animals were exposed for 10 minutes to the cat. Animals exposed to the cat presented clear innate defensive responses: at the beginning of the test, they explored the apparatus, presenting clear risk assessment responses, and the animals immediately fled back to the home cage, where they largely stayed frozen for the remainder of the test. The control group was handled identically as the cat-exposed group, but on the 11th day, the food compartment was empty, and the mice were not exposed to the cat. No food pellets were offered during the test period. Ninety minutes after ending the behavioral testing, the animals were deeply anesthetized with sodium pentobarbital (Cristalia; Itapira, SP, Brazil; 40 mg/kg, i.p.), and the brains were processed for histology and Fos immunohistochemistry Rat Exposure Test for fos expression. The experimental protocol was very similar to the cat exposure test. In brief, instead of the cat, we used two male adult Long-Evans rats with their bedding in the food compartment. The mice also displayed innate defensive behaviors and they were perfused ninety minutes after ending the behavioral test. Since the behavioral apparatus and procedures were the same for the cat and rat exposure test, the control group (already described) was used as reference for both experimental groups. Hypercapnia Test for fos expression. For this test, after being habituated during 10 days in the hypercapnia box under room air conditions (0.04% CO 2 , 21% O 2 ), the mice were submitted to hypercapnia conditions (15% CO 2 , 21% O 2 ) for 10 minutes. The control group was just exposed to room air conditions. The animals were perfused ninety minutes after the test. Fos Immunohistochemistry and Histology. Animals were perfused and the brains later frozen and cut on a sliding microtome in the frontal plane. One series of sections was processed for immunohistochemistry with anti-Fos antiserum raised in rabbit (c-fos(Ab-5); EMD Millipore;#PC38) at a dilution of 1:20 000. The primary antiserum was detected using a variation of the avidin—biotin complex system. In brief, sections were incubated for 90 minutes at room temperature in a solution of biotinylated goat antirabbit IgG (Vector Laboratories,#BP-9100) and then placed in the mixed avidin–biotin horseradish peroxidase complex solution (ABC Elite Kit; Vector Laboratories,#PK-6105) for the same period. The peroxidase complex was visualized by a five-minute exposure to a chromogen solution containing 0.02% 3,30 diaminobenzidine tetrahydrochloride (DAB; Sigma) with 0.3% nickel–ammonium sulfate in 0.05 M Tris buffer (pH 7.6) followed by incubation for 20 minutes in chromogen solution with hydrogen peroxide (1:3000), which produced a blue-black product. The reaction was stopped by extensive washing in 0.02 M KPBS (pH 7.4). Sections were mounted on gelatin-coated slides and then dehydrated and coverslipped with DPX (Sigma). An adjacent series was always stained with thionin to serve as a reference series for cytoarchitectonic purposes. Quantification of Fos-Labeled Cells. The density of Fos immunoreactive neurons was evaluated by an observer without knowledge of the animal’s experimental group. Images were generated for selected regions using the 10x objective of a Nikon Eclipse 80i (Nikon Corporation, ChiyodaKu, Tokyo-To, Japan) microscope equipped with a Nikon digital camera DXM1200F (Nikon Corporation). To quantify the density of Fos labeling, we first delineated the borders of the selected regions in a given section as defined in adjoining Nissl stained sections. Fos-labeled cells were then counted therein. Only darkly labeled oval nuclei that fell within the borders of a region of interest were counted. The density of Fos labeling was determined by dividing the number of Fos-immunoreactive cells by the area of the region of interest. Both cell counting and area measurements were performed with the aid of a computer program (Image-Pro Plus, version 4.5.1; Media Cybernetics, Silver Spring, MD, USA). Cell densities were obtained on both sides of the brain and averaged for each mouse. The brain regions examined in the present investigation followed the Brain Maps: Structure of the Rat Brain. Miniscope video capture. All videos were recorded at 30 frames/sec using a Logitech HD C310 webcam and custom-built head-mounted UCLA miniscope ( Cai et al., 2016 ). Open-source UCLA Miniscope software and hardware ( http://miniscope.org/ ) were used to capture and synchronize neural and behavioral video ( Cai et al., 2016 ). Retrobead tracing. Retrobeads (LumaFluor) (30 nL) were injected in the dlPAG diluted 6 times using a 10 μl nanofil syringe (World Precision Instruments) at 40 nl/min. The syringe was coupled to a 33-gauge beveled needle, and the bevel was placed to face the anterior side of the animal. The syringe was slowly retracted 20 minutes after the start of the infusion. Fiber photometry. Photometry was performed as described in detail previously ( Kim et al., 2016 ). Briefly, we used a 405-nm LED and a 470-nm LED (Thorlabs, M405F1 and M470F1) for the Ca 2+ -dependent and Ca 2+ independent isosbestic control measurements. The two LEDs were band-pass filtered (Thorlabs, FB410–10 and FB470–10) and then combined with a 425-nm long-pass dichroic mirror (Thorlabs, DMLP425R) and coupled into the microscope using a 495-nm long-pass dichroic mirror (Semrock, FF495-Di02–25 ×36). Mice were connected with a branched patch cord (400 μm, Doric Lenses, Quebec, Canada) using a zirconia sleeve to the optical system. The signal was captured at 20 Hz (alternating 405-nm LED and 470-nm LED). To correct for signal artifacts of a non biological origin (i.e. photo-bleaching and movement artifacts), custom Matlab scripts leveraged the reference signal (405-nm), unaffected by calcium saturation, to isolate and remove these effects from the calcium signal (470-nm). Perfusion and histological verification. Mice were anesthetized with Fatal-Plus and transcardially perfused with phosphate buffered saline followed by a solution of 4% paraformaldehyde. Extracted brains were stored for 12 hs at 4°C in 4% paraformaldehyde. Brains were then placed in sucrose for a minimum of 24 hs. Brains were sectioned in the coronal plane in a cryostat, washed in phosphate buffered saline and mounted on glass slides using PVA-DABCO. Images were acquired using a Keyence BZ-X fluorescence microscope with a 10 or 20X air objective.
Supplementary Material 2 3 Video 1. Example trial of rat exposure assay, Related to Figure 1 . Mice were exposed to an awake rat. To escape, mice had to locate and climb a grid used as a ladder on the right-side wall to gain access to a burrow. After reaching the burrow, mice were given one minute of reward, resting in the burrow away from the rat. Following rest in the burrow, mice were gently pushed down to the floor for a new trial start. 4 Video 2. Optogenetic stimulation of PMd-cck cells induces escape from a wide variety of environments, Related to Figure 2 . A cck-cre mouse was injected with AAV9-Ef1a-DIO-ChR2-YFP in the PMd and a fiber optic cannula was implanted above the PMd. Blue light delivery caused context-specific escape strategies in a wide variety of novel environments. 5 Video 3.
Optogenetic activation of Dorsal premammillary
(PMd), ventromedial (VMH) and anterior hypothalamus (AH) during exploration of a novel complex environment, Related to Figure 2 . Wild type mice were injected with AAV9-syn-ChR2-YFP in the PMd, VMH or AH, and fiber optic cannulae were implanted above these structures. Blue light delivery induces PMd-ChR2 mice, but not VMH or AH-ChR2 mice to escape. Mice had no prior habituation or training in this environment. 6 Video 4, Related to Figure 2 . PMd stimulation causes escape plans that flexibly adapt to available escape routes. Mice were placed in a box with two available escape routes, using either a rope or a series of upwards climbing steps. In the first part of the video, both routes are available. Optogenetic stimulation of PMd cells in this situation causes mice to escape using either the rope or the step routes, according to each animal’s individual preferences. In the second part of the video, one of the escape routes is blocked by placing a transparent plastic on top of the escape route. In this situation, PMd optogenetic stimulation causes mice to quickly discover that one of the routes is blocked. Mice then escape through the unobstructed route, regardless of which route they preferred to use initially, showing that PMd stimulation induces flexible escape actions that quickly adapt to elicit successful flight through available escape routes. The experiment consisted of 30 seconds OFF, 30 seconds blue light ON (473 nm, 20 Hz, 5 ms pulses). This result was observed in n=4 mice. 7 Supplemental Table S1, Related to Figures 1 – 6 . Statistical information showing n, test type and p value for all statistical tests used.
📊 Figures
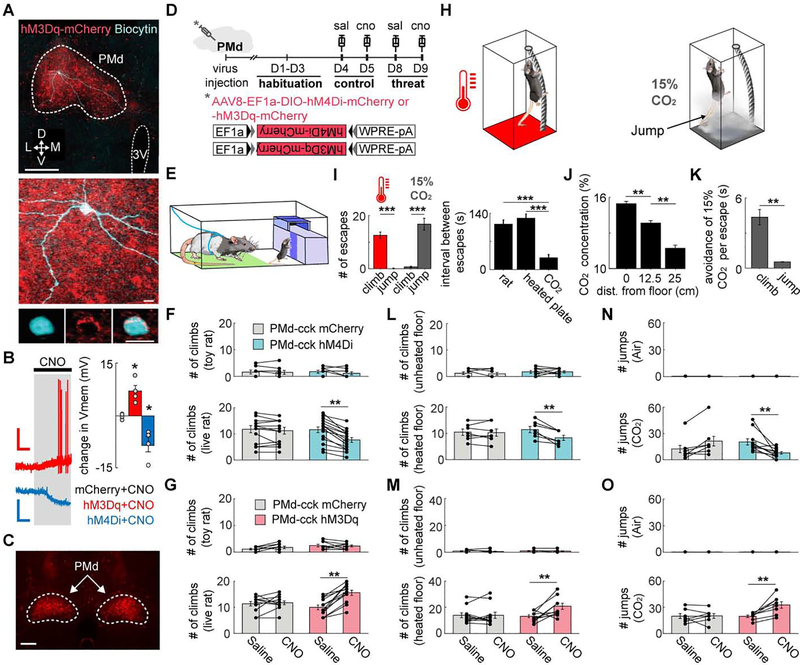
Figure 1.
PMd-cck cells are necessary and sufficient to control context-specific and panic-related stereotyped escape.
(A) Ex vivo slices with cholecystokinin (cck) positive dorsal premammillary nucleus (PMd) cells expressing hM3Dq or hM4Di. Image shows biocytin-filled PMd-cck neuron (blue) and hM3Dq (red). (top scale...
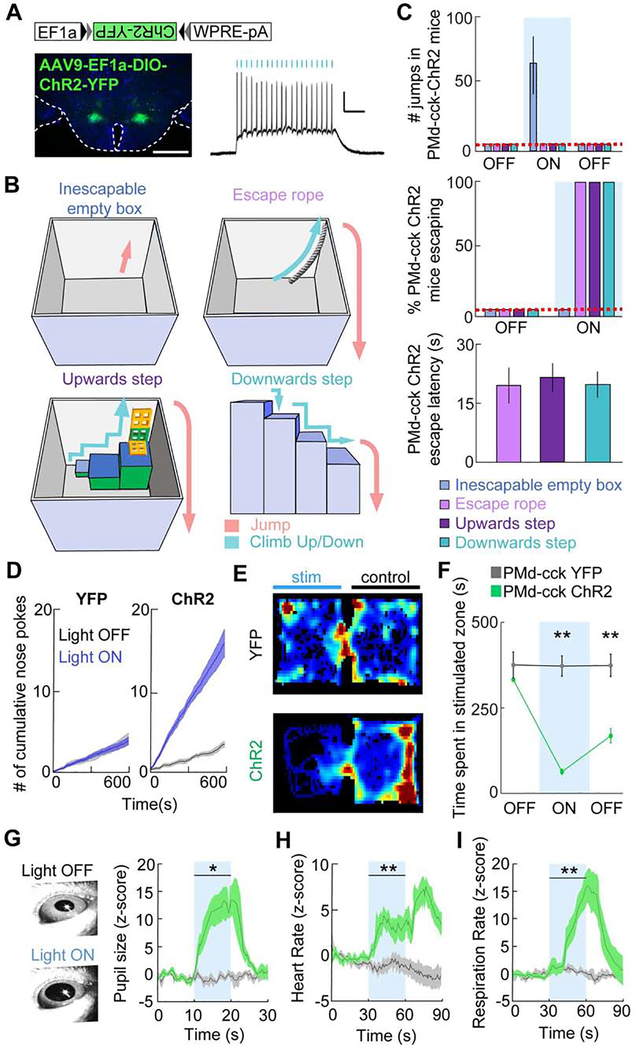
Figure 2.
Optogenetic activation of PMd-cck cells induces versatile context-specific escape from complex environments as well as autonomic activation and aversion.
(A) Left: Expression of ChR2-YFP in PMd-cck cells. Scale bar: 1 mm. Right: Ex vivo recording showing the response of a ChR2-expressing PMd cell to a 20 Hz, 5 ms, 473 nm light train. Scale bar: 2 mV, 0...
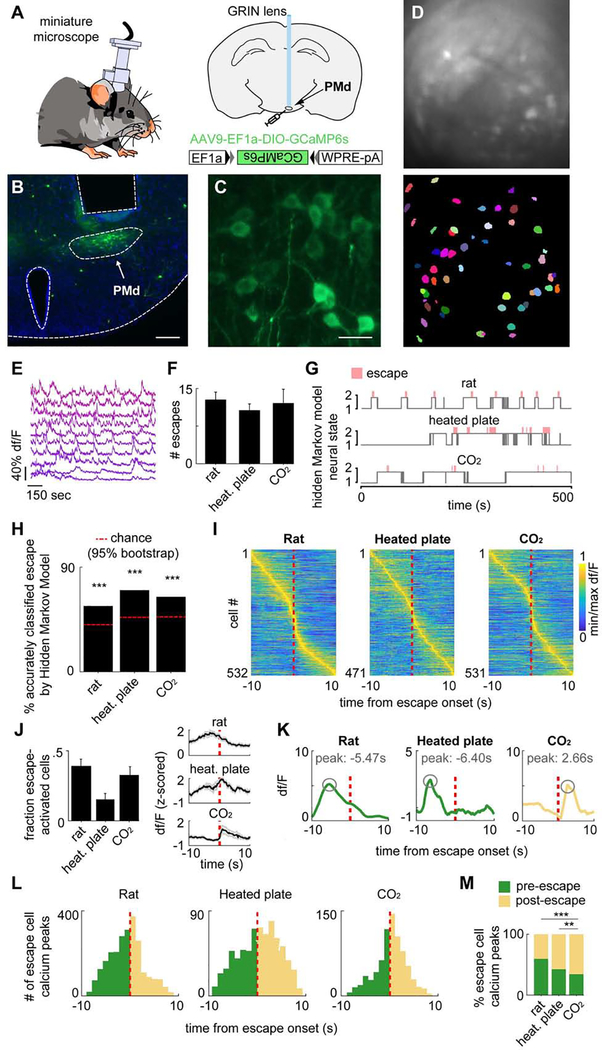
Figure 3.
Microendoscopic recordings of the PMd reveal escape-predicting states and higher activation prior to context-specific escapes.
(A) Diagram of calcium imaging setup and GRIN lens. (B) Histology of GRIN lens implantation and GCaMP6s expression in the dorsal premammillary nucleus of the hypothalamus (PMd). (scale bar: 200 u03bcm...
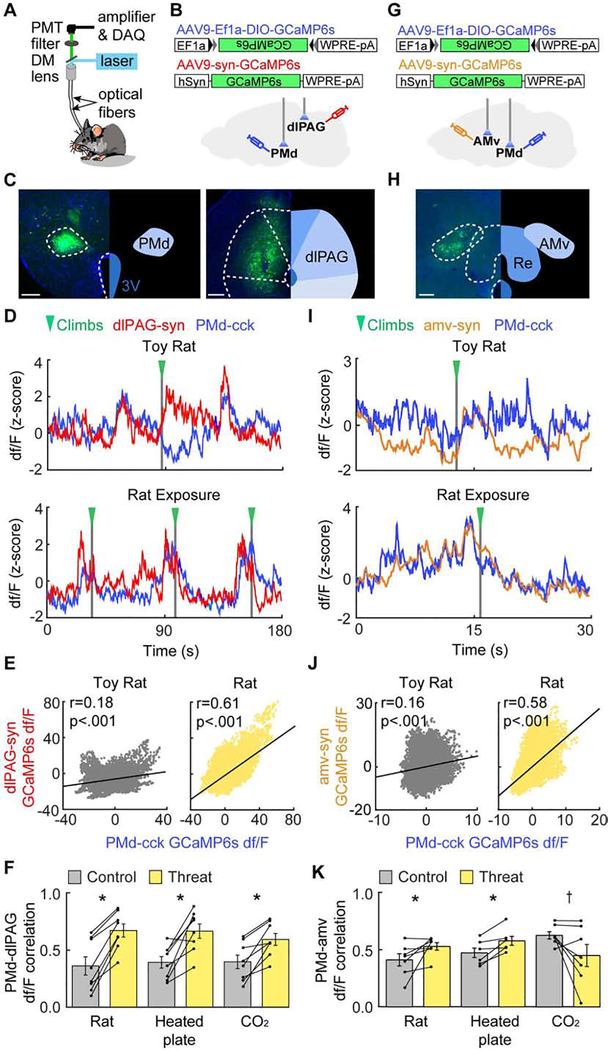
Figure 4.
The PMd-ccku2192dlPAG-syn circuit becomes more synchronized during threat assays, while the PMd-ccku2192amv-syn circuit becomes more synchronized only in assays requiring context-specific escape.
(A) Dual-site fiber photometry setup. (B) Strategy to express CGaMP6s in PMd-cck cells and dlPAG-synapsin cells. (C) Histology of GCaMP6s expression in the PMd (left) and the dlPAG. (right; PMd scale ...
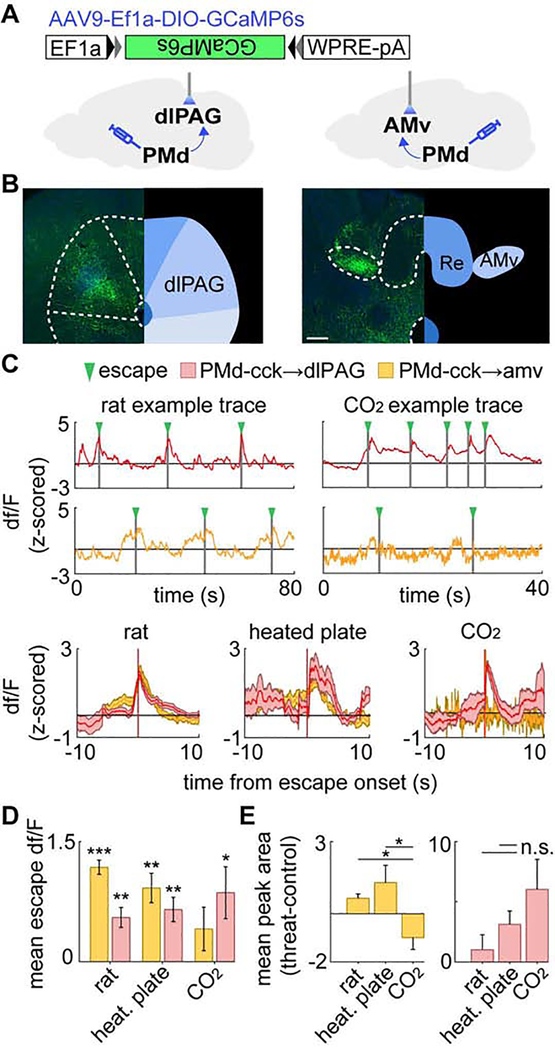
Figure 5.
PMd axon terminals in the amv are activated only during context-specific escape while terminals in dlPAG are activated during all escapes.
( A ) Recordings were obtained from GCaMP6s-expressing PMd-cck axons terminating in the dlPAG (left) or the amv (right). ( B ) PMd-cck GCaMP6s-expressing axons in the dlPAG (left) and amv (right). (sc...
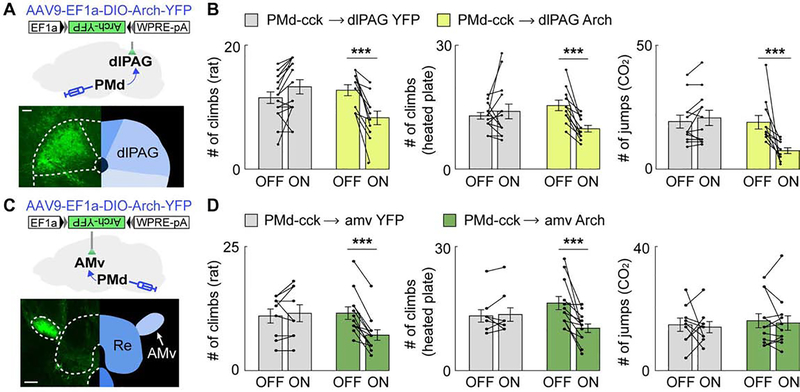
Figure 6.
Inhibition of the PMd-ccku2192dlPAG projection decreases escape in all threat assays while inhibition of the PMd-ccku2192amv-syn projection selectively decreases context-specific escape.
(A) Strategy to optogenetically inhibit arch-expressing PMd-cck axons terminating in the dlPAG (scale bar: 100u03bcm) (B) Optogenetic inhibition of the PMd-ccku2192dlPAG projection with green light (5...
Figure images are served from the NIH/NLM PubMed Central Open Access Subset or Europe PMC; copyright remains with the publishers and authors.
💬 Discussion
0 commentsNo comments yet. Be the first to start a discussion!
Leave a Comment