Abstract
AbstractCopper (Cu), an essential micronutrient, plays a fundamental role in inflammation and angiogenesis; however, its precise mechanism remains undefined. Here we uncover a novel role of Cu transport protein Antioxidant-1 (Atox1), which is originally appreciated as a Cu chaperone and recently discovered as a Cu-dependent transcription factor, in inflammatory neovascularization. Atox1 expression is upregulated in patients and mice with critical limb ischemia. Atox1-deficient mice show impaired limb perfusion recovery with reduced arteriogenesis, angiogenesis and recruitment of inflammatory cells. In vivo intravital microscopy, bone marrow reconstitution and Atox1 gene transfer in Atox1−/− mice show that Atox1 in endothelial cells (ECs) is essential for neovascularization and recruitment of inflammatory cells which release VEGF and TNFα. Mechanistically, Atox1-depleted ECs demonstrate that Cu chaperone function of Atox1 mediated through Cu transporter ATP7A is required for VEGF-induced angiogenesis via activation of Cu enzyme lysyl oxidase. Moreover, Atox1 functions as a Cu-dependent transcription factor for NADPH oxidase organizer p47phox, thereby increasing ROS-NFκB-VCAM-1/ICAM-1 expression and monocyte adhesion in ECs inflamed with TNFα in an ATP7A-independent manner. These findings demonstrate a novel linkage between Atox1 and NADPH oxidase involved in inflammatory neovascularization and suggest Atox1 as a potential therapeutic target for treatment of ischemic disease.
🔬 Techniques
🔭 Microscopes
💻 Software
✨ Fluorophores
🧪 Sample Preparation
🔬 Cell Lines
🏭 Microscope Brands
🧪 Reagent Suppliers
💻 Software Details
🏛️ Research Organizations (ROR)
Affiliated research institutions:
📋 Methods
Animals Atox1 −/− mice (backcrossed eight times to C57Bl/6J (Jackson laboratory) were obtained from Mutant Mouse Regional Resource Centers. Atox1 −/− mice were originally reported to have various phenotypes from perinatal death (45% of pups) to the phenotype which could survive more than one month 16 . In our laboratory, they were further backcrossed to C57Bl/6J mice more than ten times, and thus C57Bl/6J mice were used as control. “Survivor” mice were intercrossed with more than 10 times and Atox1 −/− mice used in the present study survived more than six months (90%). For the experiments, Atox1 −/− mice were weaned at 4 weeks of age and maintained on regular chow for 2 to 3 months. Diet and water were provided ad libitum . All studies were carried out in accordance with the guidelines approved by the Animal Care and Use Committee of the University of Illinois-Chicago Mouse hindlimb ischemia model Mouse hindlimb ischemia was induced as described previously 29 55 . Briefly, following anesthesia (87 mg/kg ketamine, 13 mg/kg xylazine), the left femoral artery was exposed under a dissection microscope. The proximal portion of the femoral artery and the distal portion of the saphenous artery were ligated. All branches between these 2 sites were ligated or cauterized, and arteriotomy was performed. We measured ischemic (left)/nonischemic (right) limb blood flow ratio using a laser Doppler blood flow (LDBF) analyzer (PeriScan PIM 3 System; Perimed) as we described 29 55 . Mice were anesthetized and placed on a heating plate at 37 °C for 10 minutes to minimize temperature variation. Before and after surgery, LDBF analysis was performed in the plantar sole. Blood flow was displayed as changes in the laser frequency, represented by different color pixels, and mean LDBF values were expressed as the ratio of ischemic to nonischemic LDBF. Tissue was extracted in radioimmunoprecipitation assay lysis buffer supplemented with protease inhibitor. The lysates were clarified by ultracentrifugation (13200 rpm, 10 minutes) at 4 °C and protein were measured by bicinchoninic acid assay. For adenovirus experiment, recombinant purified adenovirus (Ad.Atox1-WT, Ad. LacZ (control), 1 × 10 9 pfu) was injected into the adductor and gastrocnemius muscles in Atox1 KO mice at one day prior to hindlimb ischemia. Bone marrow (BM) transplantation BM transplantation was performed as we previously described 29 . BM cells were isolated by density gradient separation. Recipient mice were lethally irradiated with 9.5 Gy and received an intravenous injection of 3 million donor BMCs 24 hours after irradiation. To determine the transplantation efficiency, transplantation was performed between CD45.1 mice (Jackson Laboratories) and either Atox1 −/− or WT mice and peripheral white blood cells were stained with anti-CD45.1 (BD) and anti-CD45.2 (BD). Hindlimb ischemia was induced 6 to 8 weeks after bone marrow transplantation.
Show full methods section
Animals Atox1 −/− mice (backcrossed eight times to C57Bl/6J (Jackson laboratory) were obtained from Mutant Mouse Regional Resource Centers. Atox1 −/− mice were originally reported to have various phenotypes from perinatal death (45% of pups) to the phenotype which could survive more than one month 16 . In our laboratory, they were further backcrossed to C57Bl/6J mice more than ten times, and thus C57Bl/6J mice were used as control. “Survivor” mice were intercrossed with more than 10 times and Atox1 −/− mice used in the present study survived more than six months (90%). For the experiments, Atox1 −/− mice were weaned at 4 weeks of age and maintained on regular chow for 2 to 3 months. Diet and water were provided ad libitum . All studies were carried out in accordance with the guidelines approved by the Animal Care and Use Committee of the University of Illinois-Chicago Mouse hindlimb ischemia model Mouse hindlimb ischemia was induced as described previously 29 55 . Briefly, following anesthesia (87 mg/kg ketamine, 13 mg/kg xylazine), the left femoral artery was exposed under a dissection microscope. The proximal portion of the femoral artery and the distal portion of the saphenous artery were ligated. All branches between these 2 sites were ligated or cauterized, and arteriotomy was performed. We measured ischemic (left)/nonischemic (right) limb blood flow ratio using a laser Doppler blood flow (LDBF) analyzer (PeriScan PIM 3 System; Perimed) as we described 29 55 . Mice were anesthetized and placed on a heating plate at 37 °C for 10 minutes to minimize temperature variation. Before and after surgery, LDBF analysis was performed in the plantar sole. Blood flow was displayed as changes in the laser frequency, represented by different color pixels, and mean LDBF values were expressed as the ratio of ischemic to nonischemic LDBF. Tissue was extracted in radioimmunoprecipitation assay lysis buffer supplemented with protease inhibitor. The lysates were clarified by ultracentrifugation (13200 rpm, 10 minutes) at 4 °C and protein were measured by bicinchoninic acid assay. For adenovirus experiment, recombinant purified adenovirus (Ad.Atox1-WT, Ad. LacZ (control), 1 × 10 9 pfu) was injected into the adductor and gastrocnemius muscles in Atox1 KO mice at one day prior to hindlimb ischemia. Bone marrow (BM) transplantation BM transplantation was performed as we previously described 29 . BM cells were isolated by density gradient separation. Recipient mice were lethally irradiated with 9.5 Gy and received an intravenous injection of 3 million donor BMCs 24 hours after irradiation. To determine the transplantation efficiency, transplantation was performed between CD45.1 mice (Jackson Laboratories) and either Atox1 −/− or WT mice and peripheral white blood cells were stained with anti-CD45.1 (BD) and anti-CD45.2 (BD). Hindlimb ischemia was induced 6 to 8 weeks after bone marrow transplantation.
Histology and immunohistochemistry
Mice were sacrificed at 3–14 days after surgery, and muscles of the lower limbs or upper limbs were harvested, methanol fixed, and paraffin embedded. Frozen sections were prepared by overnight 4% PFA incubation followed by sucrose dehydration and OCT embedding. Capillary density in the ischemic muscles was determined in methanol fixed 5 μm thick sections that were stained with anti-mouse CD31 antibody (BD Biosciences) followed by biotinylated anti-mouse IgG antibody (Vector Laboratories). Arterioles were stained with anti-αSMA antibody (Sigma). Adhesion molecule expression was stained by goat anti-VCAM-1 (Santa Cruz). Monocytes/macrophages were labeled with anti-Mac3 and neutrophils with anti-Gr1 antibody followed by biotinylated anti-rat IgG (Vector Laboratories). Rabbit polyclonal anti-Atox1 17 and rat anti-CD45 (BD Biosciences) staining was performed in frozen sections. For immunohistochemistry, we used R.T.U. Vectorstain Elite (Vector Laboratories) followed by DAB (Vector Laboratories). Images were captured by Axio scope microscope or confocal microscopy and processed by AxioVision 4.8 or Zeiss LSM510 software, respectively. To quantify proliferating cells, mice were injected intraperitoneally with the thymidine analog 5-bromo-2′-deoxyuridine (BrdU; 40 mg/kg body weight, 500 μl, SigmaAldrich) at 12 hours and 1 hour before sacrifice asdescribed previously 52 . Mice were euthanized and perfused through the left ventricle with saline, and hindlimb muscles were embedded in OCT compound and snap-frozen in liquid nitrogen. Sections were incubated with a rat anti-BrdU antibody (Abcam) to detect proliferating cells. For nuclear staining, BrdU-labeled tissue sections were counterstained with 4′, 6-diamidino-2-phenylindole (DAPI). Volumetric Micro-CT Mice were euthanized and vasculature was flushed with 0.9% normal saline containing, papaverine (4 mg/L), and adenosine (1 g/L) for 3 minutes. After vasodilation, 2% paraformaldehyde was perfused for 5 minutes at 100 mm Hg pressure to fix the vasculature and wash with saline. Contrast agent containing bismuth (0.5 mL) (Generously provided by Dr. Michael Simons, Section of Cardiovascular Medicine, Yale School of Medicine, New Haven, CT) 41 in 5% gelatin was injected over a period of 2 minutes with a syringe pump. The mice were then immediately chilled on ice and immersion-fixed in 2% paraformaldehyde overnight. The hindlimb vasculature was imaged with a high-resolution micro-computed tomography (micro-CT) imaging system (Scanco μCT 50, Bassersdorf, Switzerland) in MicroCT/Histology Core, Rush University, Chicago, IL, USA. The samples were scanned at 70 kV voltage and 114 μA current, with a500ms integration time and 16 μm resolution. A region of interest was reconstructed using 1355 z-sections (~21.68 mm) of the hindlimb. During postprocessing of the image, a 530 gray-scale value was set as a threshold to eliminate bone with minimal sacrifice of vessel visualization. Quantification was performed by using Scanco software. Intravital microscopy analysis WT (C57BL/6J) or Atox1 −/− mice were prepared for intravital microscopy as described previously 25 26 . Mice were pre-anesthetized by intraperitoneal injection of ketamine (87 mg/kg, Bedford Laboratories, Bedford, OH) and xylazine (13 mg/kg, Akorn Inc., Decatur, IL). A tracheal tube was inserted and the mouse was placed on a thermo-controlled blanket (37 °C). To maintain anesthesia, the ketamine and xylazine solution, 50 μl, was administered every 30 minute through a cannulus placed in the jugular vein. Mice were kept on a 37 °C thermo-controlled rodent blanket (Thermal Care, Niles, IL) throughout the experiment. For TNFα stimulation, mice were treated with intrascrotal injection of murine TNFα (0.5 μg in 250 μl saline) for 3 hr before exteriorization of the cremaster muscle. After the scrotum was incised, the cremaster muscle was exteriorized onto an intravital microscopy tray. The cremaster preparation was superfused with thermo-controlled (37 °C) and aerated (5% CO 2 , 95% N 2 ) bicarbonate buffered saline throughout the experiment. Three hours after TNFα injection, the cremaster muscle was exposed as described previously 25 26 . Mouse neutrophils were monitored in an area of 0.02 mm 2 over 5 min in the inflamed cremaster muscle venules by infusion of an Alexa Fluor 647-labeled anti-Gr-1 antibody (0.04 μg/g body weight, BioLegend). Five to seven different venules were monitored in a mouse. Rolling and adhesion of neutrophils in post-capillary venules was recorded using an Olympus BX61W microscope with a 60x objective. Digital images were acquired using a high-speed digital camera (Hamamatsu C9300) through an intensifier (Video Scope International, Dulles, VA). Fluorescence images were analyzed using Slidebook v5.0 (Intelligent Imaging Innovations, Denvor, CO). Fluorescence images were captured at exposure times of 100 millisec and bright field images were captured with exposure times of 20 millisec. Wall shear rate (Wsr) in the mouse cremaster muscle venule averaged 500–700 s −1 and was calculated from the following equation as described previously 25 . Wsr = 2.13 × [(8 × 0.625 × Vcl)/Dv)], where Vcl is the center line velocity in mm/sec, Dv is the venule diameter in mm, and Wsr is in s −1 . Vcl and Dv were calculated from measurements derived from infusion of FluoSpheres yellow-green fluorescent microspheres (0.2 μm, Molecular Probes) into the cremaster venule and analyzed using the SlideBook software. Wall shear stress (Wst) within the mouse cremaster venule was calculated using the following equation: Wst = Wsr × viscosity, where Wsr is in s −1 and viscosity is in poise [P]. A value of 0.035 [P] was used for the viscosity of blood. O 2 • − Detection in Mice Dihydroethidium (DHE) (Invitrogen, Grand Island, NY) was prepared as a 1 mg/ml solution in 1% Dimethyl sulfoxide (DMSO) and administered at 10 mg per kg of body weight by intravenous injection as described previously 29 55 . Mice were killed and immediately perfusion-fixed with 4% paraformaldehyde 1 hour after DHE injections. Frozen sections of ischemic muscles were prepared and observed by confocal microscope (Zeiss, Thornwood, NY) with excitation at 510–550 nm and emission >585 dsx7Anm to detect oxidized ethidium. In vivo measurement of luciferase gene expression by bioluminescence HLL and Atox1 −/− HLL mice were anesthetized, and the hair was removed over the back side of mice before imaging as described previously 56 . Luciferin (150 mg/kg/mouse in 200μl of isotonic saline) was administered by i.p. injection. After 12–16 min, mice were imaged with using Xenogen IVIS spectrum (Caliper Life Sciences, Hopkinton, MA, USA). For the duration of photon counting, mice were placed inside a light-tight box. Light emission from the mouse was detected as photon counts using the intensified charge-coupled device camera and expressed as photon counts. Images were obtained before and following hind-limb ischemic surgery. Luciferase activity was measured in ischemic tissue samples by adding 100 μl of freshly reconstituted luciferase assay buffer to 20μl of the homogenated ischemic tissue that was homogenized using reporter lysis buffer (Promega). Luciferase activity was expressed as relative light units normalized for protein content.
Sponge implant model
To prepare sponge for implantation 22 , polyvinyl alcohol sponge (sponge CF120, 5mm diameter ×2.75 mm thick, Merocel) was hydrated using saline overnight and sterilized hydrated sponges by autoclaving for 25 min at 121 °C. Sterilized sponges were implanted into WT and Atox1 KO mice in the presence of VEGF. Implants were excised at 3 weeks following implantation for histological analysis because inflammatory angiogenesis peaks during this period as showed previously 22 . The sponge was harvested, fixed with paraformaldehyde and embedded in paraffin. The paraffin section (5 μM) was used for immunostaining and histology.
Isolation of coronary vascular endothelial cells Mouse coronary endothelial cells
(MCECs) were isolated as previously described 57 . Initially, beads coated with sheep anti-rat IgG were incubated with purified rat anti-mouse CD31 monoclonal antibody (1μg/ml) at 4 °C overnight and then washed with PBS containing 0.1% BSA and 2 mM EDTA. Next day, dissected heart tissues were minced and incubated with M199 containing 1 mg/ml collagenase II for 1 h at 37 °C with mild agitation every 15 min. The digested material was filtered through sterile 40μm nylon mesh and washed in 2% fetal calf serum in M199. Cell suspensions were incubated with previously prepared antibody/beads complex for 30 min at 4 °C and beads/endothelial cells complex were isolated using magnet, washed and plated with medium containing endothelial growth factors.
Quantitative real-time PCR Total
RNA of gastrocnemius and HUVECs was isolated by using phenol/chloroform and isolated using Tri Reagent (Molecular Research Center Inc.). Reverse transcription was carried out using high capacity cDNA reverse transcription kit (Applied biosystems) using 2 ug of total RNA. Quantitative PCR was performed with the ABI Prism 7000, the SYBR Green PCR kit (Qiagen) and the QuantiTect Primer Assay (Qiagen) for specific genes. Samples were all run in triplicates to reduce variability. Expression of genes was normalized and expressed as fold-changes relative to GAPDH.
Cell culture and reagents Human umbilical vein endothelial cells
(HUVECs) were grown on 0.1% gelatin coating in EndoGRO basal medium (Millipore) containing 5% fetal bovine serum (FBS) as previously described 30 . Passage number did not exceed P7.
Human epithelial kidney cells
(HEK293) were used in promoter activity experiments. HEK293 were grown in 10% FBS DMEM media. Human TNFα (R&D Systems) was used in all in vitro experiments at 10ng/ml. Protein knockdown by siRNA (Ambion) in HUVECs was done by Oligofectamine (Invitrogen) for 3h and followed by 48h growth.
Transfection of HEK293 by plasmid
DNA was accomplished through Polyfect (Qiagen) according to manufacturer protocol. Transfection was allowed for 18h prior to treatment with harvest or TNFα treatment. THP-1 monocytes were grown in RPMI media containing 10% FBS.
Monocyte Adhesion Assay
HUVECs were grown in 24-well glass bottom plates and treated for 18h with TNFα. THP-1 cells were labeled with Cell Tracker Green CMFDA (Invitrogen) and were added to the EC monolayer. Cultures were incubated in a CO 2 incubator for 1h. Nonadherent cells were removed from the plate by gentle washing with PBS, and the number of adherent cells was determined by confocal microscopy. Cells were counted in five random 20× fields per well. H 2 O 2 Measurement H 2 O 2 production was detected by incubating the cells with 20 μM 5-(and-6)-chloromethyl-2′,7′-dichlorodihydrofluorescein diacetate, acetyl ester (CM-H 2 DCFDA, Invitrogen) in the presence or absence of PEG-catalase for 6 min at 37 °C and observed by confocal microscopy using same exposure condition in each experiment. Relative DCF-DA fluorescence intensity was recorded and analyzed using LSM software as we reported previously 30 .
Immunofluorescence analysis
HUVECs on glass coverslips were rinsed quickly in ice-cold PBS, fixed in freshly prepared 4% paraformaldehyde in PBS for 10 min at room temperature, permeabilized in 0.05% Triton X-100 in PBS for 5 min, and rinsed sequentially in PBS, 50 μmol/L NH 4 Cl and PBS for 10 min each. After incubation for 1 h in blocking buffer (PBS+3%BSA), cells were incubated with Atox1 antibody for 18 h at 4 °C, rinsed in PBS/BSA, and then incubated in Alexa Fluor 488-conjugated goat anti-rabbit IgG for 1 h at room temperature and cells rinsed with PBS. Cells on coverslips were mounted onto glass slides using Vectashield (Vector Laboratories) and observed using confocal microscopy.
Immunoblotting
HUVECs were stimulated with TNFα for 18h and cells were lysed in lysis buffer, pH 7.4 (in mM) 50 HEPES, 5 EDTA, 120 NaCl), 1% Triton X-100, protease inhibitors (10 μg/ml aprotinin, 1 mmol/L phenylmethylsulfonyl fluoride, 10 μg/ml leupeptin) and phosphatase inhibitors (mmol/L) 50 sodium fluoride, 1 sodium orthovanadate, 10 sodium pyrophosphate). Cell lysates were used for immunoblotting, as described previously 30 . Goat anti-ICAM-1 (Santa Cruz), goat anti-VCAM-1 (Santa Cruz), and Mouse anti-actin (Santa Cruz) were incubated on nitrocellulose membranes containing protein. For protein expression in ischemic muscle, mice were perfused with cold phosphate buffer saline. Muscle samples were harvested and frozen in liquid nitrogen. Muscle samples were crushed and lysed with RIPA lysis buffer (5 mM Tris-HCl (pH 7.6), 150 mM NaCl, 1% NP-40, 1%sodium deoxycholate, 0.1% SDS) with protease inhibitor followed by brief sonication as described previously 40 . Equal amount of protein was separated by SDS-PAGE. Following primary antibodies were used: anti-Atox1 (home-made), anti-p47phox (Santa Cruz), or anti-VEGF antibody (Abcam). Protein expression was visualized by ECL (Amersham). Band density was quantified by ImageJ.
Capillary network formation assay
HUVECs transfected with control siRNA or Atox1 siRNA were seeded on top of the thick growth factor-reduced Matrigel-coated wells (BD Biosciences) and incubated for 6 h at 37 °C. Images were taken with a Nikon digital camera, and eight random fields per well were analyzed. Plasmids, Deletions, and Site-Directed Mutagenesis The luciferase reporter vectors (pGL3-p47phox −1217/+52, −224/+52, −86/+52, and −36/+52) were generated as previously described 51 .
Site mutagenesis
(GAAAGA to TCCCTA) and deletion of the p47phox −1217/+52 construct (−110 to −105 region) was done using Quick-change II XL (Agilent Technologies). The Atox1 mutants for promoter activity studies (Flag-Atox1-WT, Flag-Atox1-K56, 60E, Flag-Atox1-C12, 15S) were generated as previously described 17 . Purified adenovirus expressing Atox1 (Ad-Atox1) or LacZ (Ad-LacZ) (control) were used for in vivo injection.
Transient Transfection and Reporter Assay
HEK293 cells transfected with pGL3-p47phox constructs along with pRL-Null (Promega) according to the manufacturer’s protocol. One day after transfection, luciferase activity was assayed using a luminometer and normalized to Renilla luciferase activity produced by the co-transfected control plasmid pRL-Null. Samples were run in triplicate to reduce variability. Chromatin Immunoprecipitation (ChIP) Assay HUVECs grown to confluence were treated with TNFα. ChIP assays were performed by following the EpiTect ChIP One-Day Kit protocol (SA Bioscience). Cells were treated with formaldehyde (final concentration of 1%) for 15 min at 37 °C to cross-link proteins to DNA before harvesting. Then cells were rinsed twice with ice-cold PBS containing protease inhibitor, scraped into conical tubes, and pelleted for 4 min at 2000 rpm at 4 °C. Cells were resuspended in 150μl of lysis buffer (1% SDS, 10mM EDTA, 50mM Tris, pH 8.1, containing protease inhibitor) and incubated for 10 min on ice. Resuspended cells were sonicated 10 times for 10s each on ice and a second round of 5 times for 5s each. After centrifugation, the supernatant was diluted 1:10 with dilution buffer (0.01% SDS, 1.1% Triton X-100, 1.2mM EDTA, 16.7 mM Tris-HCl, pH 8.1, 167 mM NaCl). The cell lysate was precleared by incubation at 4 °C for 1 h with 45μl of salmon sperm DNA/protein A-agarose beads. The cleared lysates were incubated with anti-p65/RelA (Santa Cruz), monoclonal Atox1 antibody ( Z31112 ) as described above, histone (Santa Cruz), or normal mouse IgG overnight. The following primers were used to amplify ICAM-1: Forward 5′-TGTTCCCAGGTGAGTCGGGGTG-3′ and reverse 5′-TCGTGGAGGTATGCAGGGTCTGG-3′. VCAM-1: Forward 5′-AAATCAATTCACATGGCATA-3′ and reverse 5′- AAGGGTCTTGTTGCAGAGG-3′. -110 region of p47phox: Forward 5′-GCGACGGGAAGGACAAGTGTAAA-3′ and reverse 5′-GCTGCGCCTTAAATGCACTGGAAA-3′.
LOX activity assay
LOX activity in cultured medium and ischemic tissue lysate was measured by a high-sensitivity fluorescence assay as previously described 35 . Protein samples was incubated in the presence and absence of 500 μmol/L BAPN at 37 °C for 30 min with final reaction mixture supplied by Amplite Fluorimetric Lysyl Oxidase Assay kit (AAT Bioquest) to the manufacturer’s instruction. The reaction was stopped on ice, and differences in fluorescence intensity (540-nm excitation wavelength and 590-nm emission wavelength) between samples with and without BAPN were determined. Specific activity was determined by the ratio of activity to relative amount of protein. Monoclonal Atox1 antibody production Mouse monoclonal Atox1 antibody (Z3112) was developed by using baculovirus particles displaying the surface glycoprotein gp64-fusion protein as the immunizing agent. Briefly, the Atox1 cDNA was ligated into the gp64 gene to create a fusion protein that is expressed in the viral surface, as previously described 58 . Positive clones were selected using recombinant Atox1 protein or cells overexpressing Atox1 by adenovirus 17 32 .
Statistical analysis
All the experiments were repeated at least three times, and all values were expressed as mean ± SE. Blood flow recovery in the ischemic hindlimb was compared between the two groups by two-way repeated measures ANOVA, followed by Bonferroni post hoc analysis. Comparison between groups was analyzed by unpaired Student 2-tailed t test (2 groups) or ANOVA for experiments with more than two subgroups followed by Bonferroni post hoc analysis. For clinical studies, the distributions of the data were scrutinised for normality using the Shapiro-Wilk test. Parametric and non-parametric pairwise comparisons were analysed with the Student’s t -test and Mann-Witney U test, respectively. Differences in proportions were tested using the z -test. All tests performed were 2-sided with a p < 0.05 considered statistically significant. Statistical tests were performed using Prism v6 (GraphPad Software, San Diego, CA).
Supplementary Material Supplementary Information Supplementary Video 1 Supplementary Video 2 Supplementary Video 3 Supplementary Video 4
📊 Figures
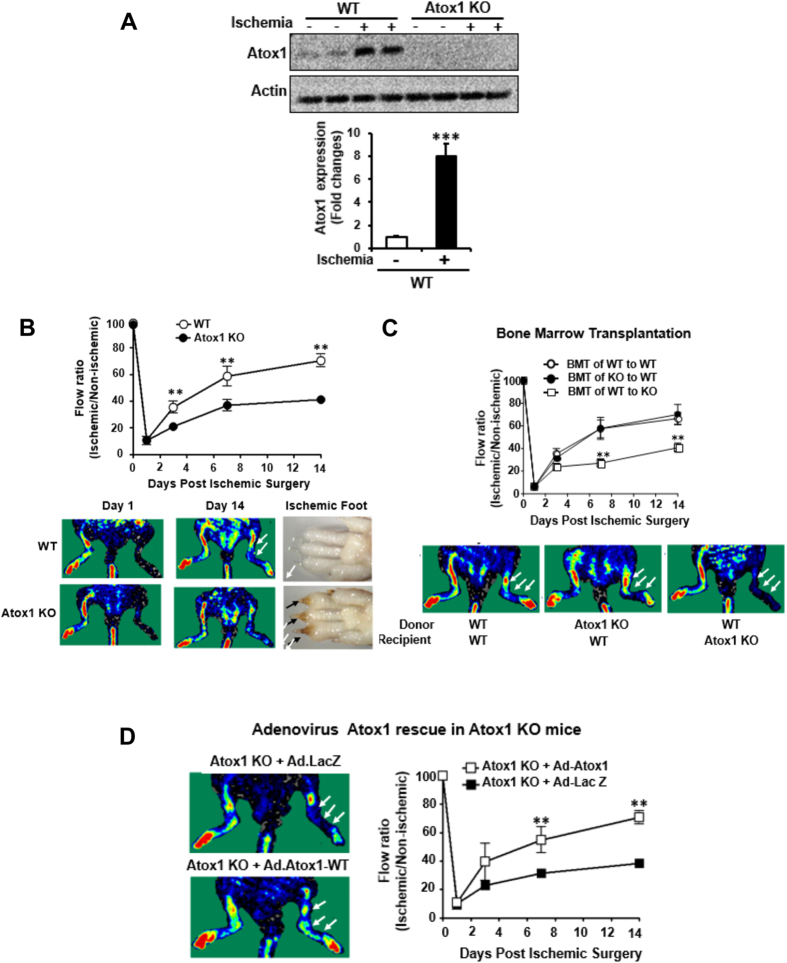
Figure 1
Atox1 in tissue resident cells, but not BM cells, is required for ischemia-induced neovascularization.
( A ) Atox1 protein expression in ischemic and non-ischemic muscles from wild type (WT) and Atox1 knockout (KO) mice at day 7 post-surgery. Actin is loading control (nu2009=u20095). ( B ) Blood flow r...
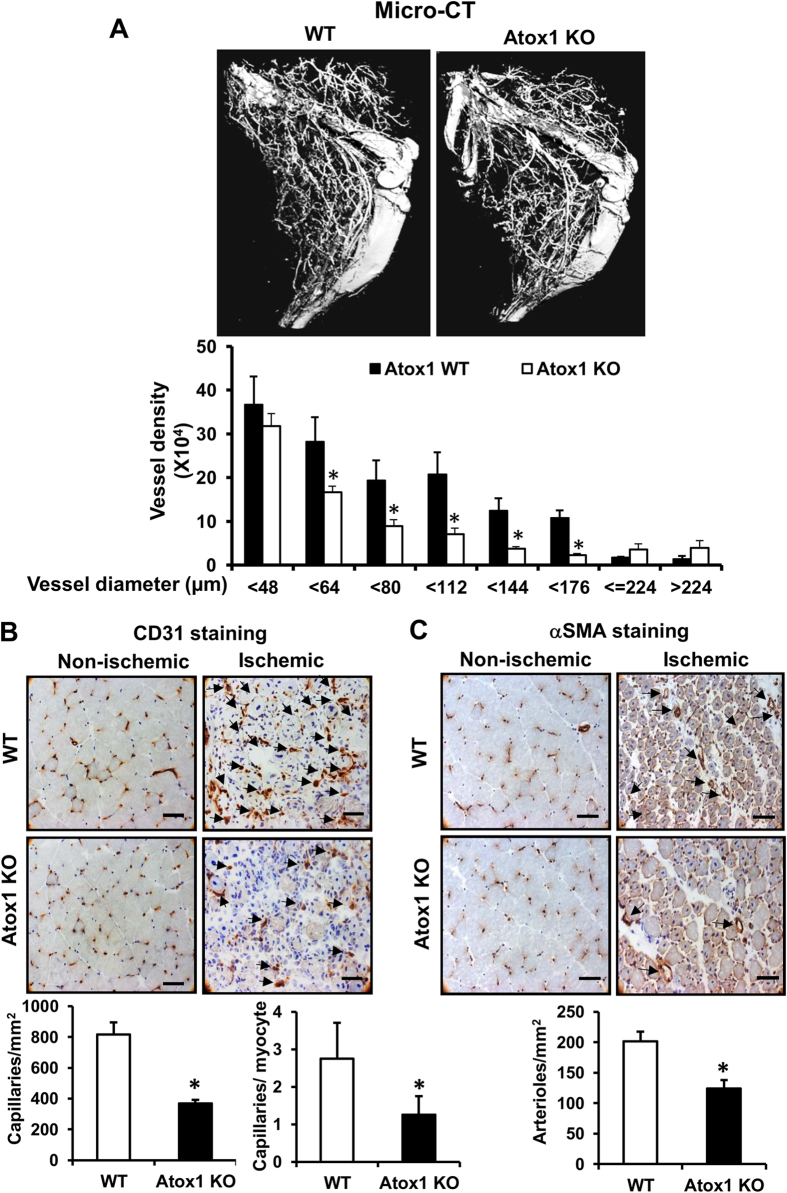
Figure 2
Atox1 is required for ischemia-induced arteriogenesis and angiogenesis.
( A ) Representative micro-computed tomography (micro-CT) angiograms (16u2009u03bcm resolution; arteriogenesis) of ischemic legs in WT and Atox1 KO mice at day 7 post-surgery. Bottom panel shows quant...
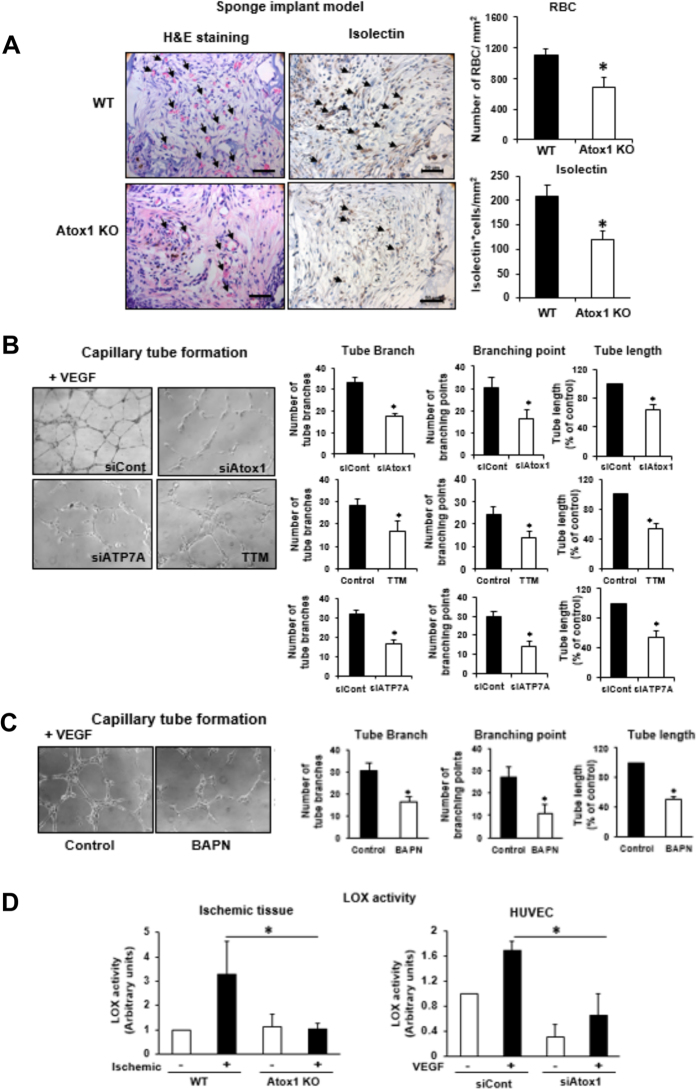
Figure 3
Atox1 promotes angiogenesis via activating Cu enzyme lysyl oxidase in ECs in an ATP7A-dependent manner.
( A ) Sponge implant assay was performed by implanting polyvinyl alcohol sponge containing VEGF subcutaneously into WT and Atox1 KO mice. Representative images for H&E staining and isolectin immunosta...
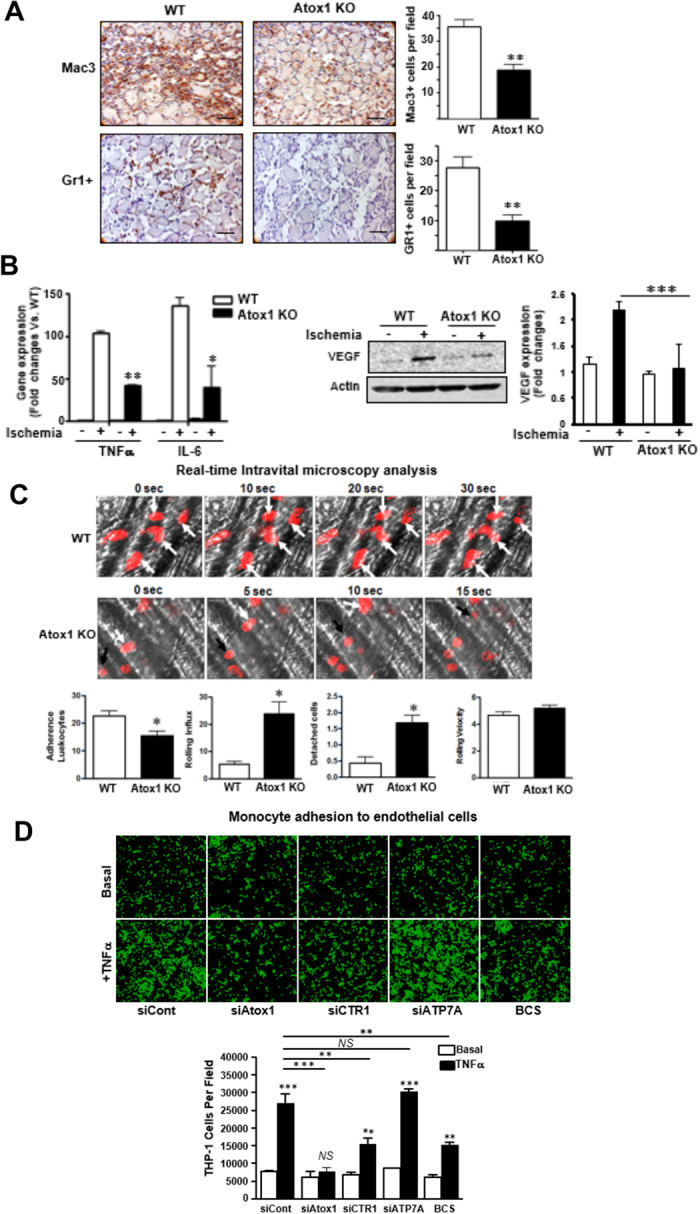
Figure 4
Atox1 is required for inflammatory cell recruitment to the ischemic tissues or inflamed ECs.
( A ) Representative images (left) and quantification (right) for Mac3 (for macrophage) and Gr1 (for neutrophils) staining in ischemic muscles in WT and Atox1 KO mice at day 3 (nu2009=u20094). ( B,C )...
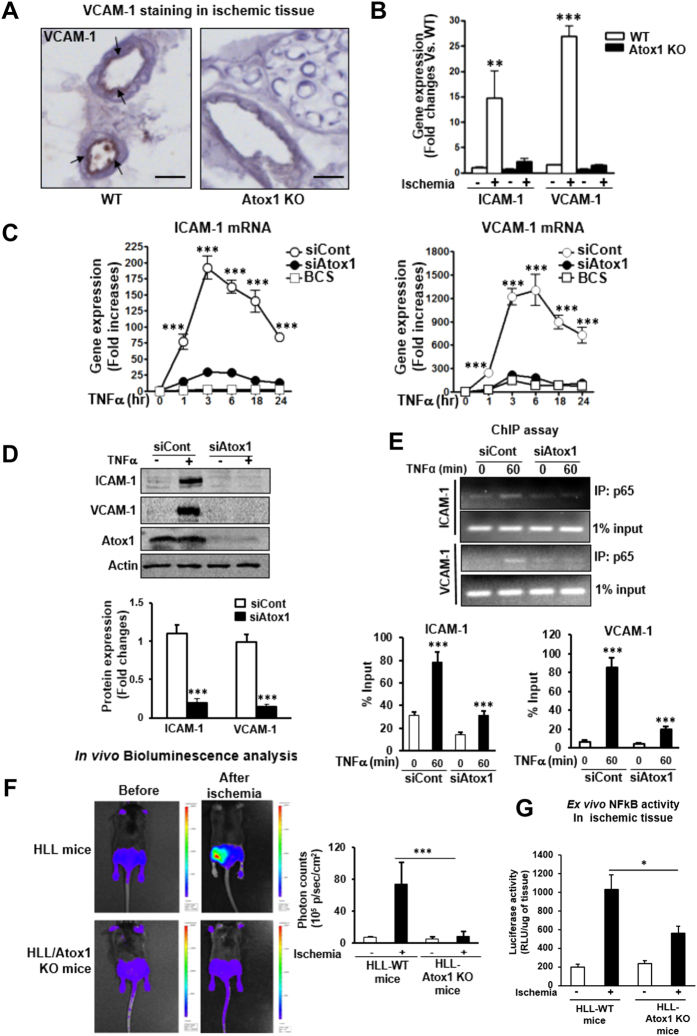
Figure 5
Atox1 is required for adhesion molecules expression in a Cu-dependent manner via activating NFu03baB in inflamed ECs.
( A ) Representative images for VCAM-1 staining in ischemic adductor muscles in WT and Atox1 KO mice at day 1 (nu2009=u20094). Scale barsu2009=u2009100u03bcm. ( B ) Expression of ICAM-1 and VCAM-1 mRN...
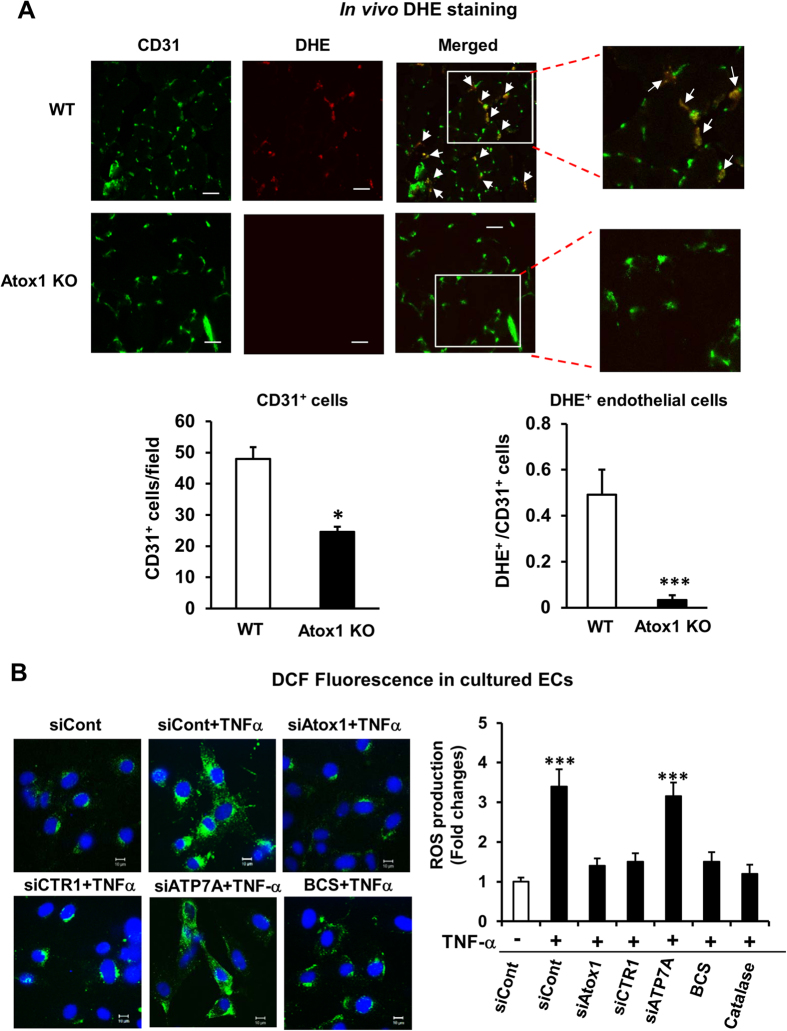
Figure 6
Atox1 is involved in endothelial ROS production in ischemic tissues and ECs stimulated by TNFu03b1 in a Cu-dependent and ATP7A-independent manner.
( A ) O 2 u2022- detection probe, dihydroethidium (DHE) was injected into mice at 30u2009min before sacrifice at day 7, and tissues were stained with CD31. Representative pictures for CD31 staining, D...
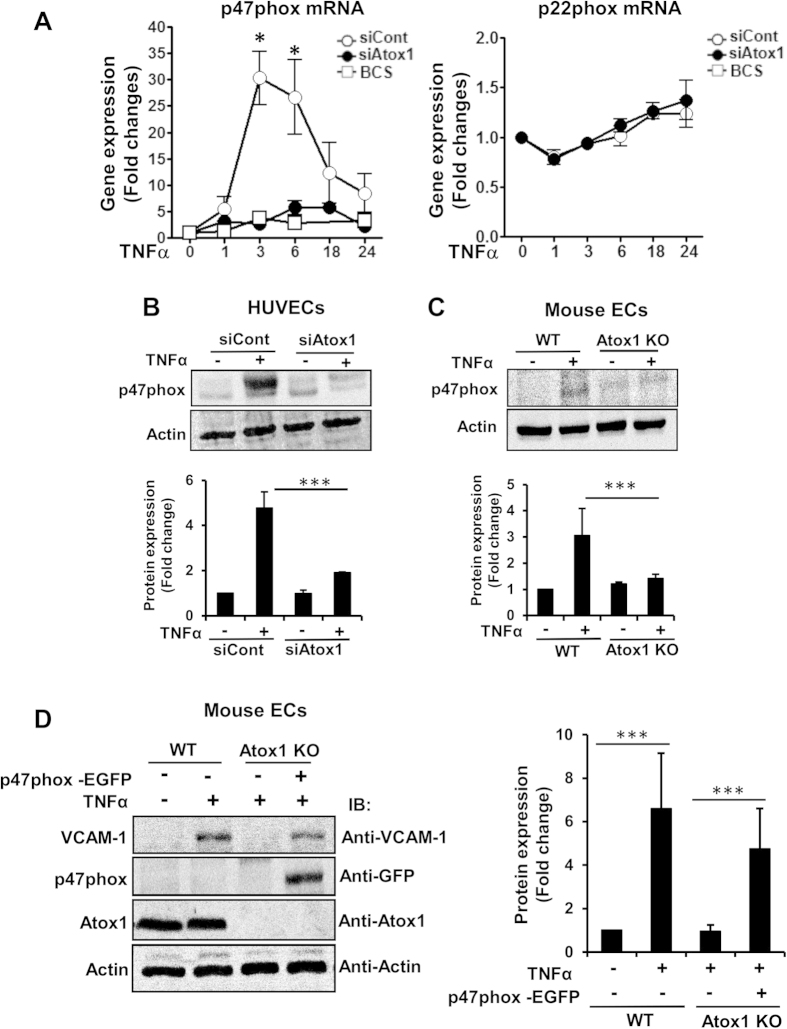
Figure 7
Atox1-mediated p47phox transcription is required for adhesion molecule expression in a Cu-dependent manner in ECs.
( A ) HUVECs transfected with Atox1 or control siRNAs, or treated with BCS (200uM for 48u2009hours) were stimulated with TNFu03b1 (10ng/ml), and p47phox and p22phox mRNAs were measured (nu2009=u20094)...
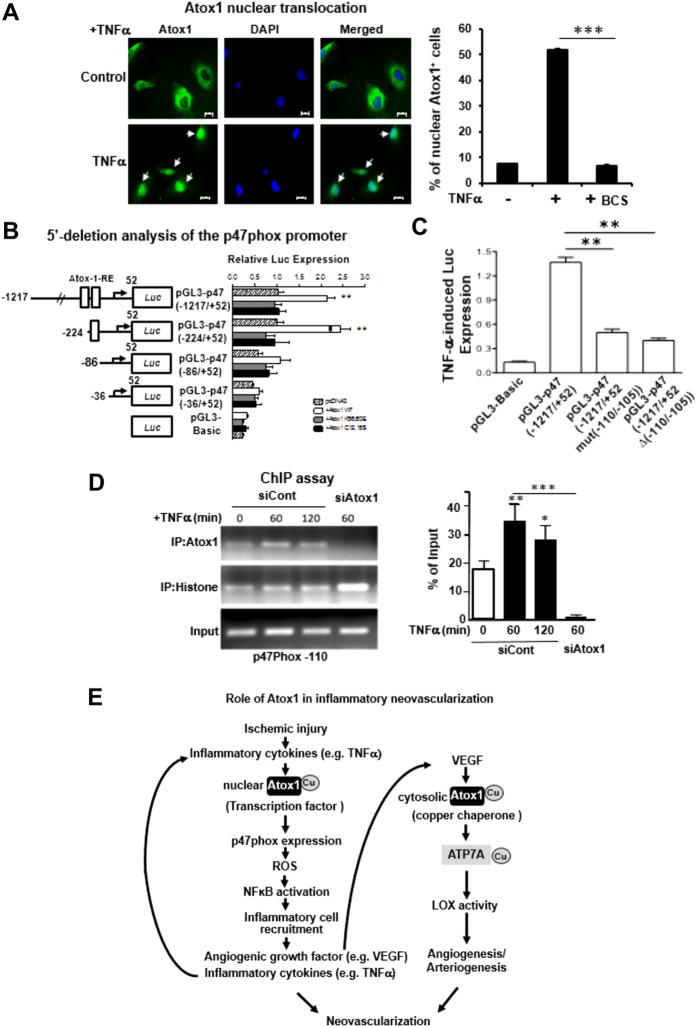
Figure 8
Atox1 promotes p47phox transcription by binding to its promoter in ECs activated by TNFu03b1 in a Cu-dependent manner.
( A ) Immunofluorescence staining of Atox1. HUVECs stimulated with TNFu03b1 (10u2009ng/ml) pretreated with or without Cu chelator BCS were immunostained for Atox1 or nuclear marker DAPI. Percentage of...
Figure images are served from the NIH/NLM PubMed Central Open Access Subset or Europe PMC; copyright remains with the publishers and authors.
💬 Discussion
0 commentsNo comments yet. Be the first to start a discussion!
Leave a Comment