Abstract
In recent years, quantification of absolute protein numbers in cellular structures using fluorescence microscopy has become a reality. Two popular methods are available to a broad range of researchers with minimal equipment and analysis requirements: stepwise photobleaching to count discrete changes in intensity from a small number of fluorescent fusion proteins, and comparing the fluorescence intensity of a protein to a known in vivo or in vitro standard. This review summarizes the advantages and disadvantages of each method, and gives recent examples of each that answer important questions in their respective fields. We also highlight new counting methods that could become widely available in the future.
🔬 Techniques
🧬 Organisms
💻 Software
✨ Fluorophores
🧪 Sample Preparation
🔬 Cell Lines
💻 Software Details
🏛️ Research Organizations (ROR)
Affiliated research institutions:
📊 Figures
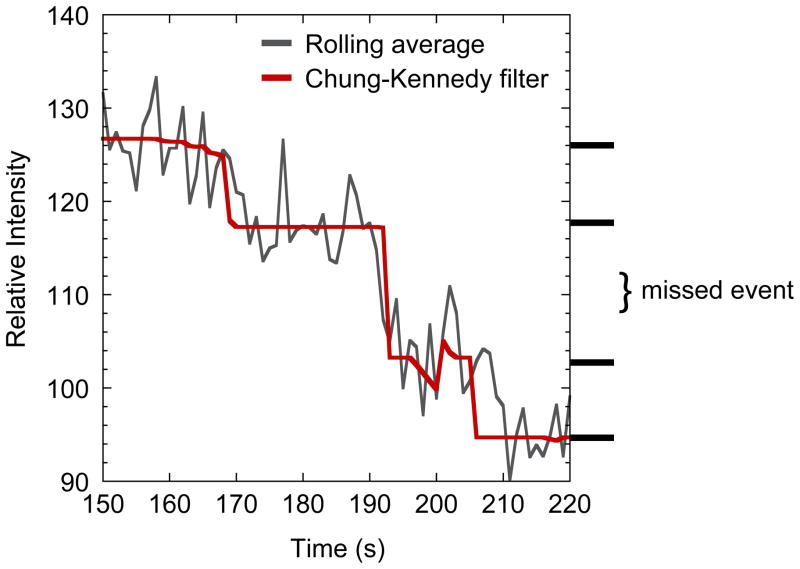
Figure 1
Missed bleaching events. A blown up image of a photobleaching curve with two bleaching events too close to be counted separately. The dark gray trace is a rolling average of every three data points fr...
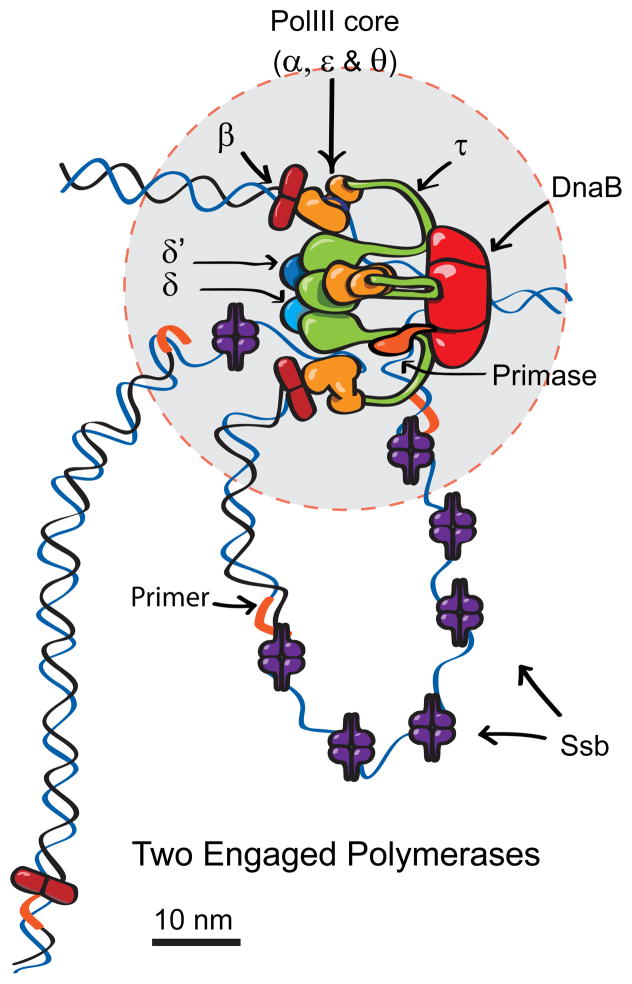
Figure 2
A revised model of the bacterial DNA polymerase based on stoichiometry data obtained using stepwise photobleaching. Three Pol III polymerase cores (orange) exist in each replisome, two of which are us...
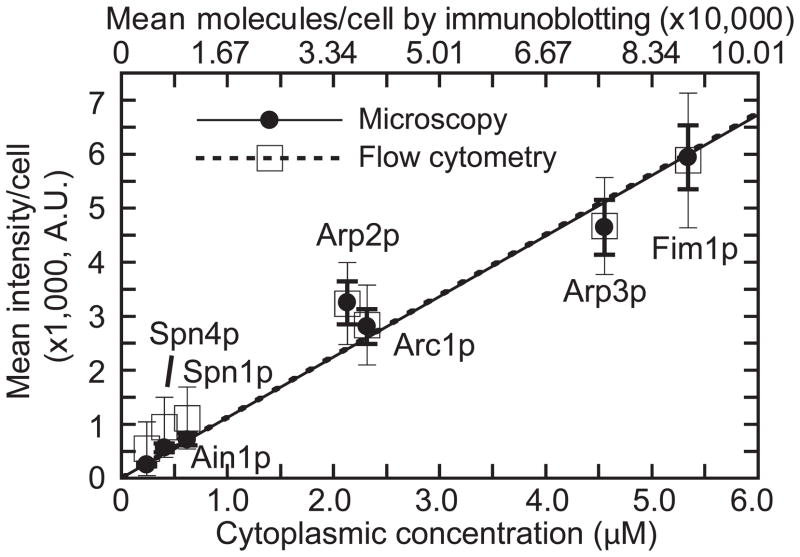
Figure 3
Standard curve for counting protein molecules. Mean numbers of mYFP-tagged protein molecules per cell and cellular concentrations, both from immunoblotting, correlate linearly with cell-size corrected...
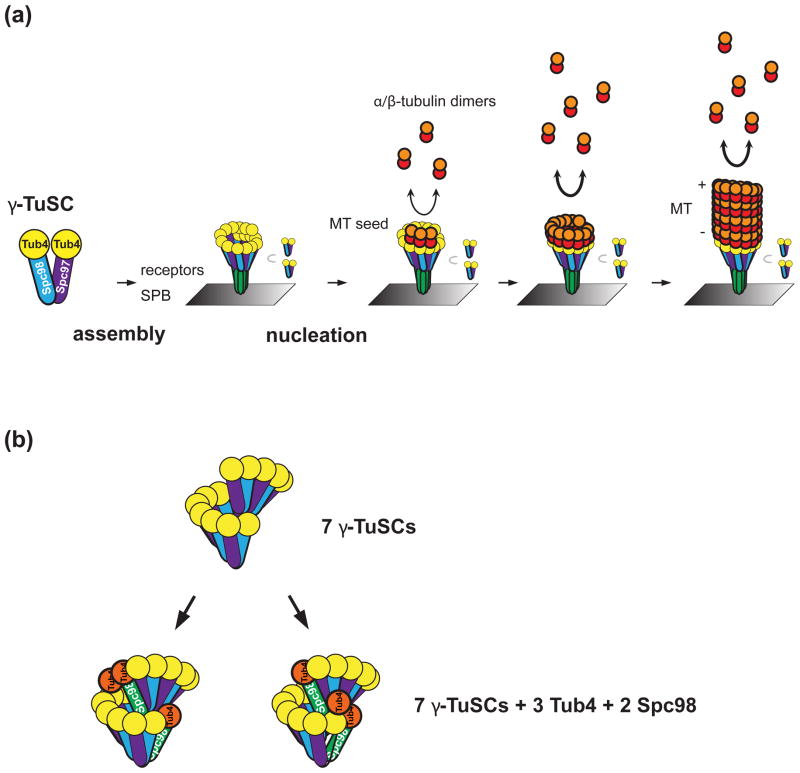
Figure 4
A revised model of the u03b3-tubulin ring in S. cerevisiae based on the ratio of u03b3-tubulin to fluorescent standards. Previously it was expected that 13 u03b3-tubulins should form a ring that serve...
Figure images are served from the NIH/NLM PubMed Central Open Access Subset or Europe PMC; copyright remains with the publishers and authors.
💬 Discussion
0 commentsNo comments yet. Be the first to start a discussion!
Leave a Comment