Abstract
Clustered regularly interspaced short palindromic repeats (CRISPR) guide RNA scaffolds have been adapted to carry multiple binding sites for fluorescent proteins to enhance brightness for live cell imaging of genomic loci. However, many of these modifications result in guide RNA instability and thus produce lower genome-labeling efficiency than anticipated. Here we introduce CRISPR-Sirius, based on octet arrays of aptamers conferring both enhanced guide RNA stability and brightness, and provide initial biological applications of this platform.
🔬 Techniques
💻 Software
✨ Fluorophores
🧪 Sample Preparation
🔬 Cell Lines
🏭 Microscope Brands
🧪 Reagent Suppliers
📷 Detectors
🎨 Filters
💻 Software Details
🏛️ Research Organizations (ROR)
Affiliated research institutions:
📋 Methods
Mining chromosome-specific repeats for the human genome Human reference genome (assembly GRC h37/hg19) ( genome.ucsc.edu ) was analyzed to find target regions and design gRNAs. Bioinformatics tool Tandem Repeat Finder 21 was used to identify tandem repeats with repeats period length smaller or equal to 2000 bp in the human genome. Bioinformatics tool Jellyfish 22 was used to identify tandem repeats with repeat length longer than 2000 bp in human genome. Jellyfish was used to search for the 15-mers in the identified repeat regions. All the tandem repeat regions with more than 5 non-overlapping copies of one 15-mer were selected. The non-overlapping repetitive 15-mers with CRISPR PAM sequences ending with NGG or starting with CCN were examined for their specificity. The 15-mers that had more than 20% of copies within in other 50 kb regions were discarded. The 15-mers containing “TTTT” or ending with “TNGG” were filtered out due to the potential pre-termination on sgRNA expression under the U6 promoter 4 . The distribution of unique repeats in human genome was shown in Supplementary Fig. 1 and chromosome 19-specific unique repeats identified by the above-mentioned bioinformatics pipeline was shown in Supplementary Fig. 9 . The copy numbers shown in the figures were defined as the maximal non-overlapping target sites from a single sgRNA in the region.
Design
CRISPR sgRNA-Sirius scaffolds To design a stable RNA scaffold accommodating multiple RNA aptamers and compatible for insertion into sgRNA, the aptamers were linked by tandem three way junctions 23 . For CRISPR Sirius-8XMS2, we randomized the linker of three way junctions between each MS2 stem loop and made the synonymous mutations of 8XMS2 24 in the scaffold. To design the variants, we used the consensus sequences as shown below: where Y was replaced with C or U, the D was replaced with A, G or U, the S with C or G, R with G or A, and N with any nucleotide. The Sirius-8XMS2 scaffold was designed to avoid a repeating 8-mer in the sequences and to optimize RNA secondary structures. The detailed design of Sirius-8XMS2 is shown in Supplementary Fig. 4 . The RNA sequence was iteratively evolved by increasing the thresholds (X) for candidate sub-optimal structures. mFold 25 was used to fold the RNA sequence and compute minimum free energy (MFE) and suboptimal free energy (SFE). Initially, all mutable residues were replaced in the base-paring manner shown in the Supplementary Fig. 4 while preserving the A-U or C-G pairs. If the generated sequence contained any repetitive 8-mer, all the mutable residues were mutated again. The sequences were then folded with the initial sub-optimally percentage X=5%. If there was unique structure within the SFE structure, the sequence was fixed and stored. The process was then continued to increase the sub-optimally threshold (X) by 1.0 and the sequence was folded again. Unstable regions were identified if any other structure was predicted within the SFE. Those regions were then marked for further mutation and the process continued until the sub-optimally percentage exceeds 10% or the number of iterations exceeded a given threshold (1000). For CRISPR Sirius-8XPP7, we adapted the three-way junction linkers from CRISPR Sirius-8XMS2 and used the PP7 aptamer mutants that had the least reduction on the PCP binding 26 , resulting in the CRISPR Sirius-8XPP7. The CRISPR Sirius-4X(MS2-PP7) was generated by alternative MS2 and PP7 in the RNA aptamer octet.
Show full methods section
Mining chromosome-specific repeats for the human genome Human reference genome (assembly GRC h37/hg19) ( genome.ucsc.edu ) was analyzed to find target regions and design gRNAs. Bioinformatics tool Tandem Repeat Finder 21 was used to identify tandem repeats with repeats period length smaller or equal to 2000 bp in the human genome. Bioinformatics tool Jellyfish 22 was used to identify tandem repeats with repeat length longer than 2000 bp in human genome. Jellyfish was used to search for the 15-mers in the identified repeat regions. All the tandem repeat regions with more than 5 non-overlapping copies of one 15-mer were selected. The non-overlapping repetitive 15-mers with CRISPR PAM sequences ending with NGG or starting with CCN were examined for their specificity. The 15-mers that had more than 20% of copies within in other 50 kb regions were discarded. The 15-mers containing “TTTT” or ending with “TNGG” were filtered out due to the potential pre-termination on sgRNA expression under the U6 promoter 4 . The distribution of unique repeats in human genome was shown in Supplementary Fig. 1 and chromosome 19-specific unique repeats identified by the above-mentioned bioinformatics pipeline was shown in Supplementary Fig. 9 . The copy numbers shown in the figures were defined as the maximal non-overlapping target sites from a single sgRNA in the region.
Design
CRISPR sgRNA-Sirius scaffolds To design a stable RNA scaffold accommodating multiple RNA aptamers and compatible for insertion into sgRNA, the aptamers were linked by tandem three way junctions 23 . For CRISPR Sirius-8XMS2, we randomized the linker of three way junctions between each MS2 stem loop and made the synonymous mutations of 8XMS2 24 in the scaffold. To design the variants, we used the consensus sequences as shown below: where Y was replaced with C or U, the D was replaced with A, G or U, the S with C or G, R with G or A, and N with any nucleotide. The Sirius-8XMS2 scaffold was designed to avoid a repeating 8-mer in the sequences and to optimize RNA secondary structures. The detailed design of Sirius-8XMS2 is shown in Supplementary Fig. 4 . The RNA sequence was iteratively evolved by increasing the thresholds (X) for candidate sub-optimal structures. mFold 25 was used to fold the RNA sequence and compute minimum free energy (MFE) and suboptimal free energy (SFE). Initially, all mutable residues were replaced in the base-paring manner shown in the Supplementary Fig. 4 while preserving the A-U or C-G pairs. If the generated sequence contained any repetitive 8-mer, all the mutable residues were mutated again. The sequences were then folded with the initial sub-optimally percentage X=5%. If there was unique structure within the SFE structure, the sequence was fixed and stored. The process was then continued to increase the sub-optimally threshold (X) by 1.0 and the sequence was folded again. Unstable regions were identified if any other structure was predicted within the SFE. Those regions were then marked for further mutation and the process continued until the sub-optimally percentage exceeds 10% or the number of iterations exceeded a given threshold (1000). For CRISPR Sirius-8XPP7, we adapted the three-way junction linkers from CRISPR Sirius-8XMS2 and used the PP7 aptamer mutants that had the least reduction on the PCP binding 26 , resulting in the CRISPR Sirius-8XPP7. The CRISPR Sirius-4X(MS2-PP7) was generated by alternative MS2 and PP7 in the RNA aptamer octet.
Identification of copy number variation of U2OS cells
The mapped pair-end whole genome sequencing reads for the osteosarcoma cell line (U2OS) 27 were downloaded. The bam file was sorted by reference coordinates using samtools 28 . Control-FREEC 29 was used to find the copy number alternations from the sorted bam file. Control-FREEC can detect copy number alternations and allelic imbalance from sequencing data without requiring control data. The window size for Control-FREEC was set to 50,000 bps. Different ploidy numbers were used: 2,3,4, and 5. The ploidy number 3 was able to explain the most observed copy number alternations (0.847636) and it was selected subsequently. Plasmid construction The expression vector for dCas9 (nuclease-dead) from S. pyogenes was that originally constructed from pHAGE-TO-DEST 5 into which mCherry, GFP or P2A-HSA (Heat Stable Antigen) was inserted at the C-terminus resulting in pHAGE-TO-dCas9-mCherrry, pHAGE-TO-dCas9-GFP and pHAGE-TO-dCas9-P2A-HSA respectively. PCP-GFP 7 expressed from pHAGE-EFS-PCP-GFPnls was previously described and HaloTag 14 were subcloned to replace the GFP in the pHAGE-EFS-MCP-GFPnls plasmid. The expression vector for guide RNAs was based on the pLKO.1 lentiviral expression system, Hygromycin, TetR-P2A-BFP or PUR-P2A-BFP was inserted right after the PGK promoter to generate pLH-sgRNA, pTetR-P2A-BFPnls-sgRNA or pPUR-P2A-BFPnls-sgRNA respectively. A series of modified sgRNA cassettes under the control of human or mouse U6 promoters used in this study are listed in Supplementary Table 1 . The sgRNA-3’−14XMS2 and sg16XMS2 were subcloned from sg14x(MS2) MUC4.1 13 . The one-step generation of paired guide RNAs was performed by simultaneously subcloning into the cassettes hU6-sgRNA-Sirius-8XMS2 and mU6-sgRNA-Sirius-8XPP7 into pPUR-P2A-BFPnls vector, resulting the dual-guide RNA expression vector pPUR-P2A-BFPnls- hU6-sgRNA-Sirius-8XPP7-mU6-sgRNA-Sirius-8XMS2, containing the CcdB gene between two Bbs I sites in each cassette with different cohesive sites. The details of the cloning strategy were shown in Supplementary Fig. 11 . The dCas9 and sgRNA-Sirius expression vector reported here will be deposited at Addgene.
Cell culture and transfection Human osteosarcoma
U2OS cells were cultured on 35 mm glass bottom dishes (MatTek) at 37°C in Dulbecco-modified Eagle’s Minimum Essential Medium (DMEM; Life Technologies) containing high glucose and supplemented with 10% (vol/vol) fetal bovine serum. For transfection, typically 20 ng each of PCP-GFP and MCP-HaloTag, 200 ng of dCas9 plasmid DNA and 1 μg of plasmid DNA for desired guide RNAs were co-transfected using Lipofectamine 2000 (Life Technologies) and the cells were incubated for another 24–72 hours before imaging.
Quantitative real-time PCR
Cells were transfected as described in previous sections. Briefly, 200 ng of dCas9 plasmid DNA, 50 ng of MCP-Halo and 1 μg of total guide RNA plasmid DNA were cotransfected using Lipofectamine 3000 (Thermo Fisher Scientific), and the cells were incubated for another 48–72 h before harvest. RNA was extracted with an RNeasy Plus Mini Kit (QIAGEN) and then subjected to RT-PCR using the following primers and probe (Integrated DNA Technologies) for C19–1-Sirus-8XMS2–guide RNA: Forward primer: 5′-GGCAGTAGCAAGTTTAAATAAG−3′ ; complementary to nt 315–336 of the RNA; Probe: 5′-TTCAAGTTGATAACGGACTAGC−3′ ; complementary to nt 337–358 of the RNA; Reverse primer: 5′-GACTCGGTGCCACTTT−3′ ; complementary to 374–359 nt of the RNA. The target sequence is located at nt 40–100 of C19–1-3’−14XMS2-guide RNA. Identical reagents and concentration were used to detect C19–1-3’−14XMS2-guide RNA except five nt of the forward primer at 5’ end was replaced to optimize the annealing temperature. The forward primer for C19–1-3’−14XMS2-guide RNA was 5′-CAGCATAGCAAGTTTAAATAAG−3′ ; complementary to nt 35–56 of the RNA. For BFP RNA from the same plasmid carrying guide RNA: Forward primer: 5′-CGCCAAGACCACATATAGATCC−3′ ; complementary to nt 531–552 of the RNA; Probe: 5′-ACCCGCTAAGAACCTCAAGATGCC−3′ ; complementary to nt 558–581 of the RNA; Reverse primer: 5′-TGGCCTCCTTGATTCTTTCC−3′ ; complementary to 628–609 nt of the RNA. The DNA Primetime qPCR kit (Hs.PT.39a.22214847, Integrated DNA Technologies) were used for quantification of β-actin mRNA. BFP RNA produced from the same plasmid of guide RNA ( Supplementary Table 1 ) was used as the calibration standard for transfected plasmid DNA. All data were normalized for the cell number using β-actin mRNA as the internal reference.
Lentivirus production and transduction
HEK293T cells were maintained in Iscove’s Modified Dulbecco’s Medium (IMDM; Fisher Scientific) containing high glucose and supplemented with 1% GlutaMAX (Life Technologies), 10% fetal bovine serum (Hycolne FBS, Thermo Scientific) and 1% each penicillin and streptomycin (Life Technologies). 24 hours before transfection, approximately 5×10 5 cells were seeded in 6-well plates. For each well, 0.5 μg of pCMV-dR8.2 dvpr (Addgene), 0.3 μg of pCMV-VSV-G (Addgene), each constructed to carry HIV LTRs, and 1.5 μg of plasmid containing the gene of interest were co-transfected by using TransIT transfection reagent (Mirus) according to manufacturer’s instructions. After 48 hours, the virus was collected by filtration through a 0.45 μm polyvinylidene fluoride filter (Pall Laboratory). The virus was immediately used or stored at −80 °C. For lentiviral transduction, U2OS cells maintained as described above were transduced by Spinfection in 6-well plates with lentiviral supernatant for 2 days and ~2×10 5 cells were combined with 1 ml lentiviral supernatant and centrifuged for 30 minutes at 1200 x g .
Flow cytometry and stable cell selection
Cells expressing the desired fluorescent Cas9 and/or guide RNA were selected using a FACSAria cell sorter (BD Bioscience) equipped with 405, 488, 561 and 640 nm excitation lasers, and the emission signals were detected by using filters at 450/50 nm (wavelength/bandwidth) for the Brilliant Violet 421-conjugated anti-mouse CD24 antibody (BioLegend) staining of the HSA, 530/30 nm for PCP-GFP and 582/15 nm for MCP-HaloTag stained with HaloTag-JF549. For the sorting of dCas9 signals, 1 μl of the Brilliant Violet 421-conjugated anti-mouse CD24 antibody was added in a 100 μl cell solution for 30 minutes before FACS. For sorting of MCP-HaloTag, HaloTag-JF549 was added to the cells at 2 nM 18–24 hours before sorting. Single cells were sorted into single wells of 96-well plates containing 1% GlutaMAX, 20 % fetal bovine serum and 1% penicillin and streptomycin in chilled DMEM medium. Positive clones of U2OS dCas9-HSA/PCP-GFP/MCP-HaloTag were selected from 96-well plates 10 days later. To generate stable cell lines in which the IDR2/IDR3 locus pair was labeled, the U2OS dCas9-HSA/PCP-GFP/MCP-HaloTag cell line was transduced for 48 hours by lentivirus for PUR-P2A-BFP-hU6-IDR2-sgRNA-Sirius-8XMS2-mU6-IDR3-sgRNA-Sirius-8XPP7 for 48 hours. Cells were then selected with 1μg/ml puromycin for 3–5 days before sorting for BFP, using filters at 405 nm excitation and 450/50 nm emission. The resulting cell lines was simply named U2OS IDR2/IDR3 . The stable cell lines with other locus pairs were generated by the same procedures.
Fluorescence microscopy A Leica
DMIRB microscope was equipped with an EMCCD camera (Andor iXon-897), mounted with a 2x magnification adapter and 100x oil objective lens (NA 1.4), and resulting in a total 200x magnification equal to a pixel size of 80 nm in the images was used. The microscope stage incubation chamber was maintained at 37 °C in HEPES-buffered DMEM with 10% FBS. GFP was excited with an excitation filter at 470/28 nm (Semrock) and its emission was collected using an emission filter at 512/23 nm (Semrock). HaloTag-JF549 was excited at 556/20 nm (Semrock) and its emission was collected in a 630/91 nm channel. Imaging data were acquired by MetaMorph acquisition software (Molecular Devices). Image size was adjusted to show individual nuclei and intensity thresholds were set on the basis of the ratios between nuclear focal signals to background nucleoplasmic fluorescence. To detect loci numbers, maximum intensity projection of Z-series images was performed. To quantify the spatial distance or track the dynamics, only pairs of loci lying in the same foci plane were analyzed.
Imaging processing
The images were analyzed by the Fiji ( http://fiji.dc/Fiji ) and Mathematica (Wolfram) software. Images from the green and red channels were registered by using 0.1 μm coverglass-absorbed TetraSpeck fluorescent microsphere (Invitrogen) as a standard sample. Intensity quantification in Supplementary Fig. 7d was performed as following I R = I S − I B I N − I B where I R is the intensity ratio between the labeled FBN3 loci (I S ) and nucleoplasm (I N ). The background fluorescence intensity (I B ) from a dark region in the same image were subtracted. In live cell tracking, the specific genomic loci signals were identified and tracked by using the TrackMate plugin 30 . The 2D Gaussian fittings for precise measurement of spatial distance of locus pairs in Fig. 2c were performed by Mathematica and graphs were generated by OriginPro (OriginLab) or Excel.
Statistical analysis
All box plots and bar graphs were generated using the OriginPro or Excel. The line within the box plot represents the mean, the outer edges of the box are the 10th and 90th percentiles and the whiskers extend to the minimum and maximum values. In the bar graphs, all data are shown as the mean ± s.d. and individual data points were overlaid on the graphs. The exact n values used to calculate statistics are described in the associated figure legends. All the images and videos shown in the figures were repeated at least 3 times independently with similar results.
Supplementary Material 1 2 3 4 5 6 7 8 9
📊 Figures
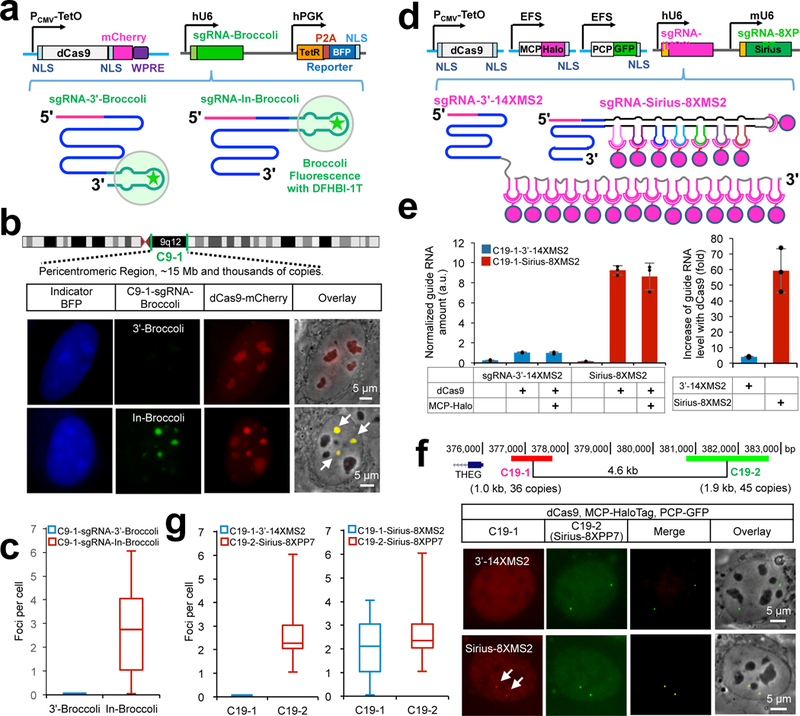
Figure 1.
Development of CRISPR-Sirius, a bright and multicolor DNA imaging system.
( a ) Diagram of the CRISPR sgRNA-Broccoli system and the details of this system are described in the Supplementary Fig. 2a . ( b ) Visualization of C9u20131 (an pericentromeric region on chromosome 9...
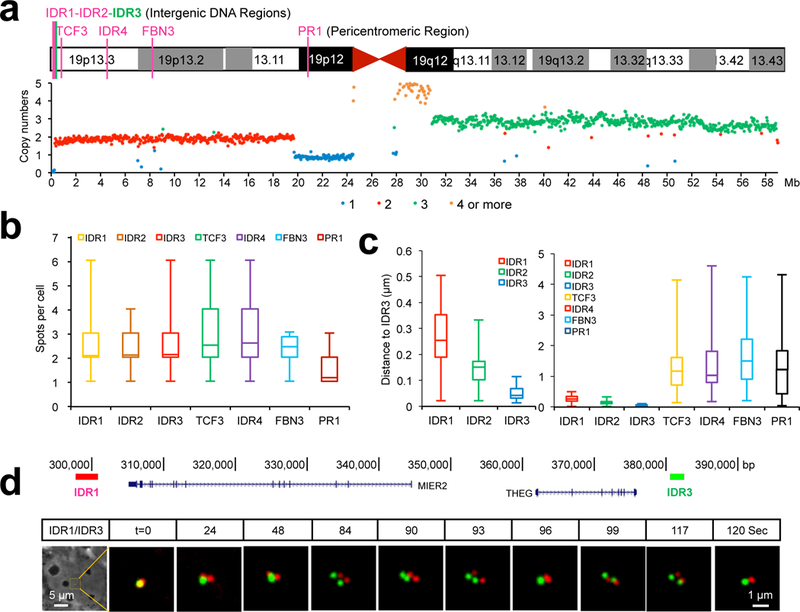
Figure 2.
Imaging locus pairs from kilobases to megabases by CRISPR-Sirius.
( a ) Schematic of seven unique loci on human chromosome 19 used in this study consisting of 4 intergenic DNA regions (IDRs), 2 intronic regions (TCF3 and FBN3) and 1 pericentromeric region (PR1). Sho...
Figure images are served from the NIH/NLM PubMed Central Open Access Subset or Europe PMC; copyright remains with the publishers and authors.
💬 Discussion
0 commentsNo comments yet. Be the first to start a discussion!
Leave a Comment