Abstract
Although viruses are extremely diverse in shape and size, evolution has led to a limited number of viral classes or lineages, which is probably linked to the assembly constraints of a viable capsid. Viral assembly mechanisms are restricted to two general pathways, (i) co-assembly of capsid proteins and single-stranded nucleic acids and (ii) a sequential mechanism in which scaffolding-mediated capsid precursor assembly is followed by genome packaging. Cryo-electron microscopy (cryo-EM) and cryo-electron tomography (cryo-ET), which are revolutionizing structural biology, are central to determining the high-resolution structures of many viral assemblies as well as those of assembly intermediates. This wealth of cryo-EM data has also led to the development and redesign of virus-based platforms for biomedical and biotechnological applications. In this Review, we will discuss recent viral assembly analyses by cryo-EM and cryo-ET showing how natural assembly mechanisms are used to encapsulate heterologous cargos including chemicals, enzymes, and/or nucleic acids for a variety of nanotechnological applications.
🔬 Techniques
🔭 Microscopes
🧬 Organisms
💻 Software
🏭 Microscope Brands
🧪 Reagent Suppliers
📷 Detectors
💻 Software Details
💾 Data Repositories
🏛️ Research Organizations (ROR)
Affiliated research institutions:
📋 Methods
HBV sample preparation The Hepatitis B subtype adyw core protein assembly domain and the Cp150 mutant, in which three native cysteine are mutated to alanine and an additional C-terminal cysteine appended, were expressed in E. coli and purified by size exclusion as previously described ( Zlotnick et al., 2007 ). Cp149 and Cp150 capsids were prepared for preliminary Cryo-EM from purified dimer by initiating assembly at 10 μM dimer concentration in 300 mM NaCl, 50 mM HEPES, pH 7.5 and allowing the reaction to proceed overnight. Residual un-assembled dimer was removed by purifying the fresh capsids via size exclusion. Purified capsids were then incubated with HAP-TAMRA at a molar excess overnight. For cryo-EM, capsids were then concentrated to >10 mg/ml.
Synthesis of HAP-TAMRA
Synthesis of HAP13 ( Bourne et al., 2008 ) and HAP-TAMRA are described in the patent literature ( Zlotnick et al., 2014 ). Analysis of the product by HPLC at the 280 nm and 555 nm wavelengths showed a product with ~99% purity; ESI-TOF MS: calculated for C 51 H 50 ClFN 8 O 7 , m/ z 940.35; M + + H, m/ z 941.36; Found, m/ z 941.3; calculated for M + + Na, m/ z 963.4; Found, m/ z 963.3.
Negative stain electron microscopy
Samples from Figure 2a,b represent Cp149 assembly reactions at 50 mM HEPES, 300 mM NaCl, and 10 μM dimer. The reaction in Figure 2b was initiated in the presence of 40 μM HAP-TAMRA. Both samples were adsorbed to the surface of EMS carbon film 300 mesh coper grids, washed with water, and stained with 2% uranyl acetate. Samples were imaged with a JEOL 3200-FS electron microscope operated at 300kV.
Show full methods section
HBV sample preparation The Hepatitis B subtype adyw core protein assembly domain and the Cp150 mutant, in which three native cysteine are mutated to alanine and an additional C-terminal cysteine appended, were expressed in E. coli and purified by size exclusion as previously described ( Zlotnick et al., 2007 ). Cp149 and Cp150 capsids were prepared for preliminary Cryo-EM from purified dimer by initiating assembly at 10 μM dimer concentration in 300 mM NaCl, 50 mM HEPES, pH 7.5 and allowing the reaction to proceed overnight. Residual un-assembled dimer was removed by purifying the fresh capsids via size exclusion. Purified capsids were then incubated with HAP-TAMRA at a molar excess overnight. For cryo-EM, capsids were then concentrated to >10 mg/ml.
Synthesis of HAP-TAMRA
Synthesis of HAP13 ( Bourne et al., 2008 ) and HAP-TAMRA are described in the patent literature ( Zlotnick et al., 2014 ). Analysis of the product by HPLC at the 280 nm and 555 nm wavelengths showed a product with ~99% purity; ESI-TOF MS: calculated for C 51 H 50 ClFN 8 O 7 , m/ z 940.35; M + + H, m/ z 941.36; Found, m/ z 941.3; calculated for M + + Na, m/ z 963.4; Found, m/ z 963.3.
Negative stain electron microscopy
Samples from Figure 2a,b represent Cp149 assembly reactions at 50 mM HEPES, 300 mM NaCl, and 10 μM dimer. The reaction in Figure 2b was initiated in the presence of 40 μM HAP-TAMRA. Both samples were adsorbed to the surface of EMS carbon film 300 mesh coper grids, washed with water, and stained with 2% uranyl acetate. Samples were imaged with a JEOL 3200-FS electron microscope operated at 300kV.
Cryo-electron microscopy and image processing
Samples for Cryo-EM were applied to a glow-discharged Quantifoil holey-carbon grids (R2/2). The grids were blotted with filter paper for 4 s before automated plunging into liquid ethane using an FEI vitrobot. The Cp149+HAP TAMRA data from Figure 11 and Figure 4 panel a were imaged using a JEOL 3200-FS electron microscope operated at 300kV with an in-column energy filter. Images were recorded at a nominal magnification of 80,000X, with a pixel size of 1.5 Å, maintaining less than 35e - Å 2 dose, recorded on a Gatan Ultrascan 4000 4k × 4 k CCD detector. The 2D class averages shown in Figure 4 panels b, c, and d were collected on the same JEOL 3200-FS microscope, but with a Direct Electron DE-12 detector, with an image sampling rate of 1.01 Å/pixel. For the high-resolution 3D structure determination, first presented in Figure 5 , samples were imaged on a FEI Titan Krios operated at 300 kV at a nominal magnification of 22,500. Images were recorded on a Gatan K2 Summit detector operating in ‘super-resolution’ mode, resulting in a pixel size of 0.65 Å with a dose of ~33 e - Å 2 . Each exposure was 8 s long, and was collected as 35 individual frames. The data collection process was semi-automated using the Leginon system.( Suloway et al., 2005 ) The final maps are deposited in the EMDB database as 7295 for the T = 3 map and 7294 for the T = 4 map ( Table 1 ). Cryo-EM classification and reconstruction was implemented using standard protocols of the EMAN2, Motioncorr2, and Relion software programs ( Kimanius et al., 2016 ; Zheng et al., 2016 ; Tang et al., 2007 ). Upon convergence of the 3D structures, each map was sharpened by applying a negative B-factor which was obtained using the Guinier fitting procedure implemented in Relion ( Rosenthal and Henderson, 2003 ). To assess the local variability in the quality of the structure a local resolution analysis was employed, also implemented in Relion. The local resolution procedure determined local FSC with a sampling window of 10 Å, using the same negative B-factor obtained at the end of refinement. Model determination The crystal structures of both apo capsid (1qgt)( Wynne et al., 1999b ) and HAP18 bound capsid (5d7y)( Venkatakrishnan et al., 2016 ) were used as starting points for flexible model refinement imposing icosahedral non-crystallographic symmetry constraints, and using the PHENIX and eLBOW software programs ( Afonine et al., 2012 ; Moriarty et al., 2009 ; Emsley et al., 2010 ). The model validation statistics we report were obtained from the final output of the Phenix real space refinement tool. To refine the pixel size of the map, we fit the model of the asymmetric unit into density and measured cross-correlation across pixel sizes. The optimal pixel size was determined to be 1.285 Å, compared to 1.30 Å as determined by the microscope calibration. The final maps and models reflect this change. Structural comparisons and figure creation were carried out in UCSF Chimera. The final structure coordinates are deposited in the protein data bank as 6BVN for the T = 3 structure and 6BVF for the T = 4 structure.
Detection of binding in solution
The final buffer conditions for all binding assays were 300 mM NaCl, 20 mM Tris, 1% DMSO, and pH 7.5 with varying protein and HAP-TAMRA. Size exclusion chromatography assays were performed using a superose 6 30/10 column plumbed into a Shimadzu HPLC equipped with a diode array detector. The HAP-TAMRA absorbance eluting in the capsid fractions was attributed to the capsid bound population. All HAP-TAMRA absorbance eluting later was attributed to free ligand. It is important to note that because the HAP-TAMRA probe is synthesized as a racemic mixture, and because only a single enantiomer is known to bind the HAP pocket, we expected to see at least half of the input HAP-TAMRA eluting as free ligand. When plotting the increase in 520 nm signal in the capsid fraction ( Figure 2d ), the A520 at 7.5 ml was used, corresponding to the pre-established center of the capsid elution volume. Absorbance and fluorescence was measured in a 96-well plate using a 200 µl sample volume by a Biotek Synergy H1 plate reader. Measurements based on fluorescence used an excitation wavelength of 520 nm and monitored emission at 580 nm. For plotting the change in 520/555 nm absorbance ratio, we used the maximum value of the capsid peak at each wavelength. Kinetic assays based on absorbance were sampled in 1 min intervals, where each data point is the value of 520 nm absorbance. To account for the varying presence of excess free probe in the titration time course ( Figure 3b ), the signal is presented as Δ520 nm absorbance compared to a probe-only reference. We defined this as ΔA520 = A520 raw - A520 inert – A520 binding(t=0) where A520 inert accounts for the absorbance of dye that does not participate in binding (because it was either the inactive enantiomer or present in superstoichiometric quantities), and A520 binding(t=0) is the initial absorbance of the fraction of HAP-TAMRA that will participate in binding. This analysis assumes linear binding until saturation, based on the results in Figure 2d , but could underestimate the signal if binding were weaker.
Additional files 10.7554/eLife.31473.017 Transparent reporting form Major datasets The following datasets were generated: Christopher John Schlicksup Joseph Che-Yen Wang Adam Zlotnick 2017 Cryo-EM Structure of Hepatitis B virus T=4 capsid in complex with the fluorescent allosteric modulator HAP-TAMRA http://www.rcsb.org/pdb/search/structidSearch.do?structureId=6BVF Publicly available at the RCSB Protein Data Bank (accession no. 6BVF) Christopher John Schlicksup Joseph Che-Yen Wang Adam Zlotnick 2017 Cryo-EM Structure of Hepatitis B virus T=3 capsid in complex with the fluorescent allosteric modulator HAP-TAMRA http://www.rcsb.org/pdb/search/structidSearch.do?structureId=6BVN Publicly available at the RCSB Protein Data Bank (accession no. 6BVN) Christopher John Schlicksup Joseph Che-Yen Wang Adam Zlotnick 2017 Cryo-EM Structure of Hepatitis B virus T=4 capsid in complex with the fluorescent allosteric modulator HAP-TAMRA http://www.ebi.ac.uk/pdbe/entry/emdb/EMD-7294 Publicly available at the Electron Microscopy Data Bank (accession no. EMD-7294) Christopher John Schlicksup Joseph Che-Yen Wang Adam Zlotnick 2017 Cryo-EM Structure of Hepatitis B virus T=3 capsid in complex with the fluorescent allosteric modulator HAP-TAMRA http://www.ebi.ac.uk/pdbe/entry/emdb/EMD-7295 Publicly available at the Electron Microscopy Data Bank (accession no. EMD-7295)
📊 Figures
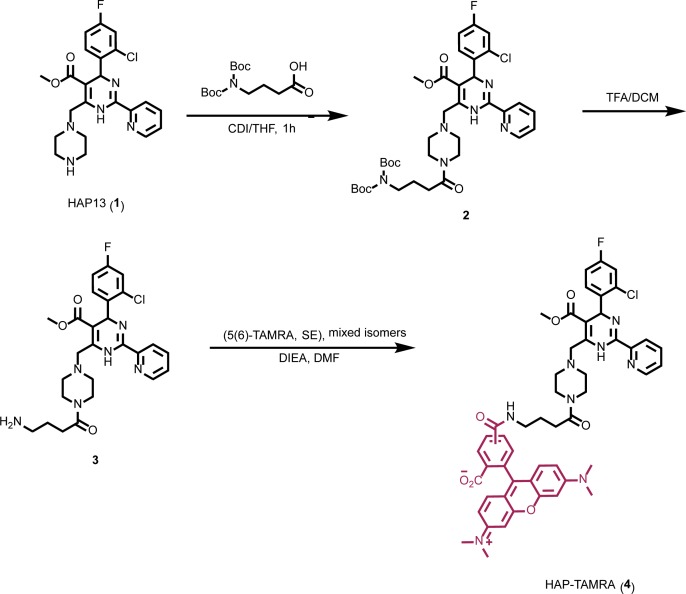
Figure 1.
Synthesis of HAP-TAMRA.
HAP-TAMRA is a derivative of HAP13 ( Bourne et al., 2008 ) with a tetramethylrodamine (TAMRA) moiety.
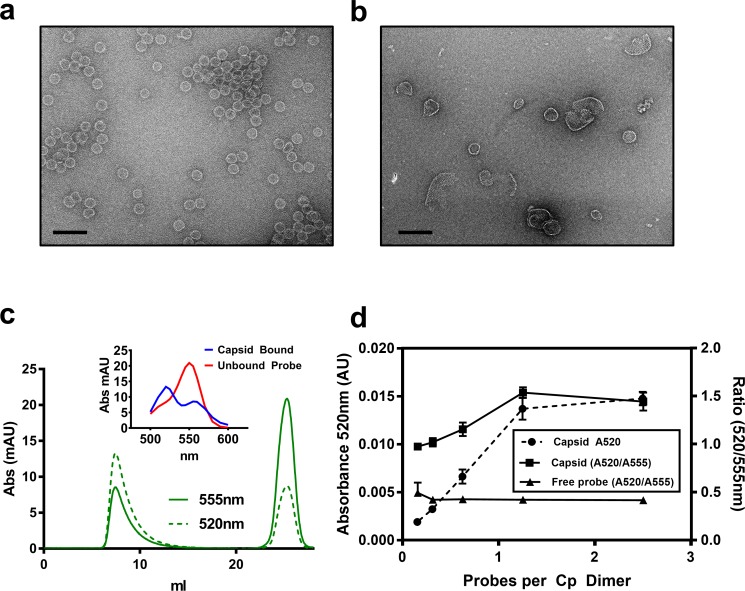
Figure 2.
HAP-TAMRA drives core protein assembly.
( a ) A negative stain micrograph of a typical assembly reaction using purified core protein. ( b ) Like other HAPs, stoichiometric excess of HAP-TAMRA drives assembly of non-capsid polymers of core p...
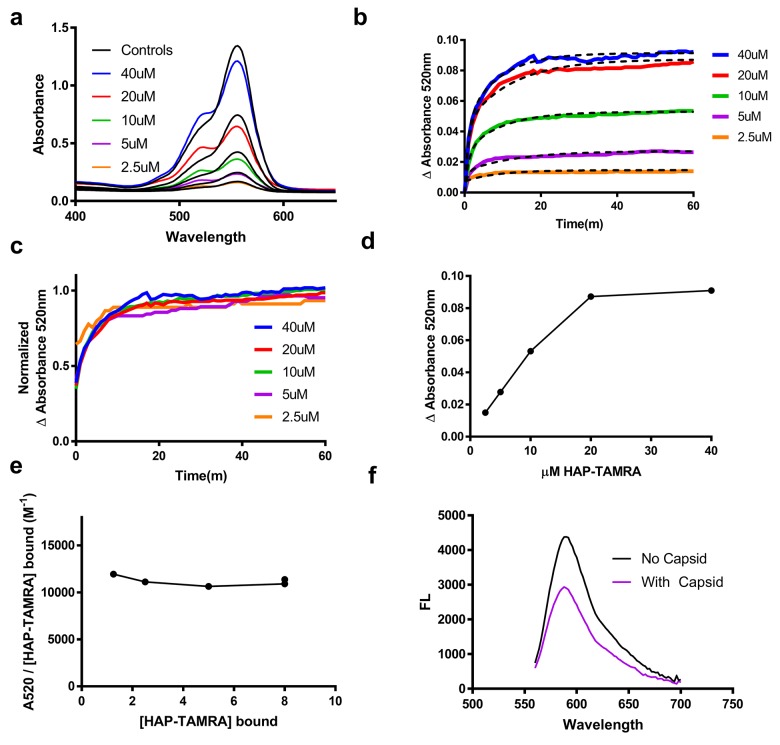
Figure 3.
HAP-TAMRA absorbance and fluorescence change in response to binding capsid.
( a ) HAP-TAMRA in solution for a matched pair of samples with 8 u00b5M capsid (colored lines) and without (black lines). In the presence of capsid, the absorbance spectrum shifts towards one that res...
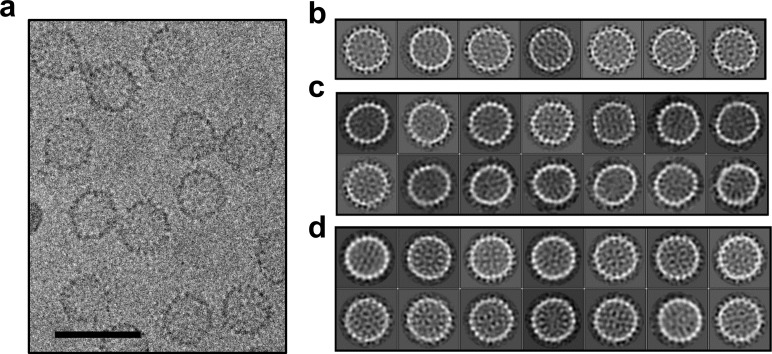
Figure 4.
Cryo-microscopy shows that HAP-TAMRA distorts capsids.
( a ) A cryo-micrograph shows a section of a field of Cp149 capsids treated with HAP-TAMRA. Particles appear asymmetric and have marked angles. None have the spherical cross-section typical of Cp149 c...
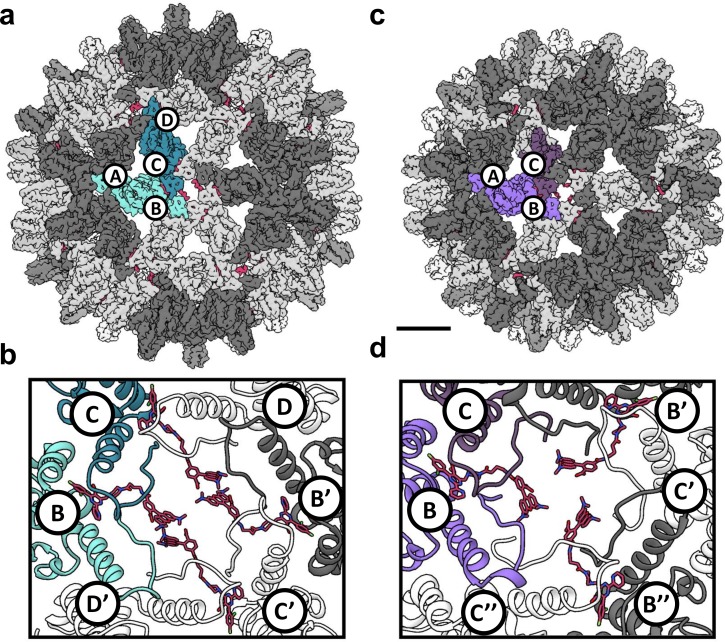
Figure 5.
Reconstruction of T = 4 and T = 3 particles.
( a ) A T = 4 capsid. A single asymmetric unit is composed of two dimers, and by convention the component subunit chains are labeled with letters A,B and C,D. The two subunits that form the AB dimer (...
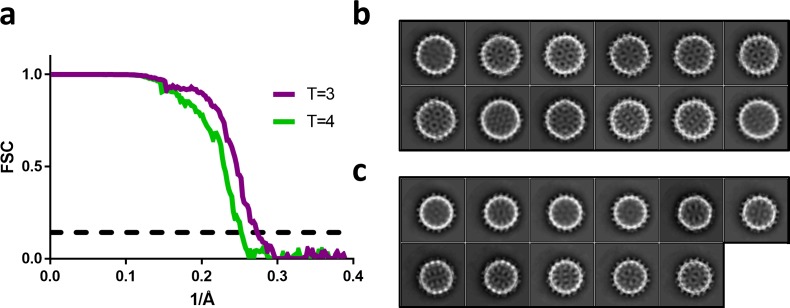
Figure 6.
Fourier shell correlation and 2D class averages of T = 4 and T = 3 particles.
( a ) Fourier shell correlation for the T = 4 and T = 3 reconstruction in green and purple, respectively. The dashed line indicates a correlation of 0.143. ( b ) The most populated 2D class averages f...
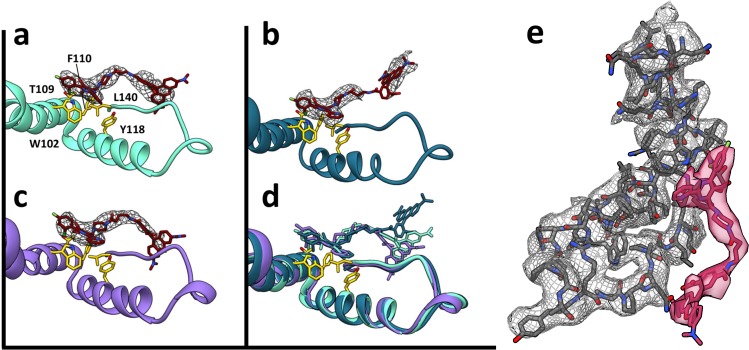
Figure 7.
HAP-TAMRA has a very similar structure in three different quasi-equivalent environments.
The HAP site consists of a pocket in one subunit that is capped by a neighboring subunit. The pockets of the T = 4 B and C subunits (panels a and b) and the T = 3 B subunit ( c ) each has unambiguous ...
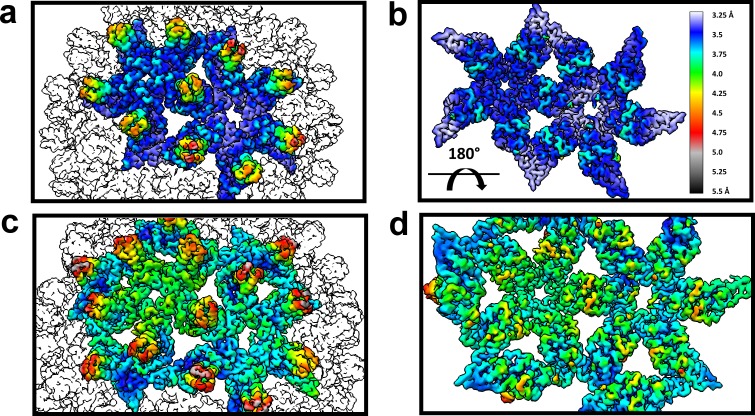
Figure 8.
The dimer-dimer interactions, including the HAP-pocket, are structurally conserved.
T = 3 ( a,b ) and T = 4 ( c,d ) capsids are color coded by resolution. Spike tips are the lowest resolution features at 4.5u20135 u00c5 resolution. The interdimer interfaces near the HAP pockets and h...
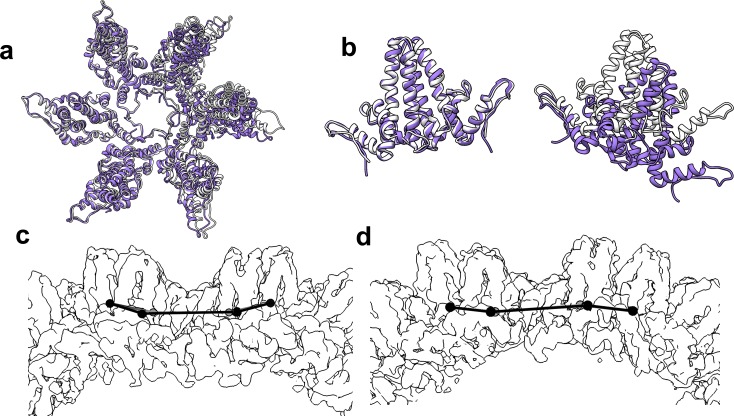
Figure 9.
The flexibility of interdimer geometry is demonstrated by comparison of T = 3 and T = 4 quasi-sixfold vertices.
Dimeru2013dimer interaction varies in response to quasi-equivalent interaction, T number, and the presence of CpAM. The difference in the geometry of interaction can be difficult to see. ( a ) Quasi-s...
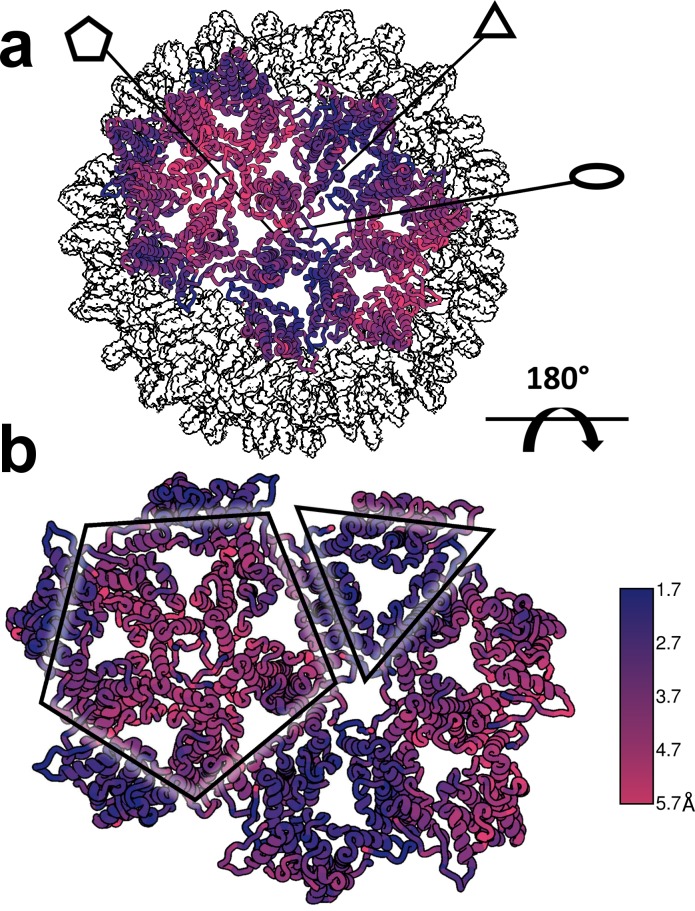
Figure 10.
Structural defects induced by HAP-TAMRA are concentrated at icosahedral fivefold.
( a, b ) Differences between the HAP-TAMRA capsid and an apo capsid (1QGT) were calculated by overlaying the two capsids based on a common center. Residues are color coded based on the displacement of...
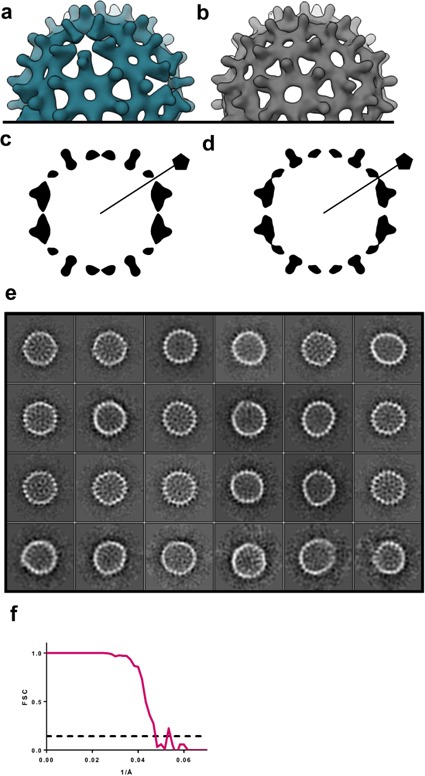
Figure 11.
A low resolution reconstruction of Cp149+HAP TAMRA shows that defects are concentrated at fivefold vertices.
( a ) T = 4 reconstructions Cp149+HAP TAMRA show an absence of density on the fivefold. This suggests structural heterogeneity. Consistent with this, the reconstruction only achieved 22 u00c5 resoluti...
Video 1.
A tour of a T=4 capsid ( Video 1 ).
Intact surface-shaded capsids, contoured at 3.6 sigma, are shown with the AB dimers surrounding fivefold vertices shaded in dark grey, quasi-sixfold are alternating dark and light gray. HAP-TAMRA is r...
Video 2.
A tour of a T=3 capsid ( Video 2 )
As with the T=4u00a0move,u00a0intact surface-shaded capsids, contoured at 3.6u00a0sigma.u00a0The AB dimers surrounding fivefold vertices shaded in dark grey, quasi-sixfoldu00a0are alternating dark and...
Figure images are served from the NIH/NLM PubMed Central Open Access Subset or Europe PMC; copyright remains with the publishers and authors.
💬 Discussion
0 commentsNo comments yet. Be the first to start a discussion!
Leave a Comment