Abstract
Abstract Systemic AA amyloidosis is a worldwide occurring protein misfolding disease of humans and animals. It arises from the formation of amyloid fibrils from the acute phase protein serum amyloid A. Here, we report the purification and electron cryo-microscopy analysis of amyloid fibrils from a mouse and a human patient with systemic AA amyloidosis. The obtained resolutions are 3.0 Å and 2.7 Å for the murine and human fibril, respectively. The two fibrils differ in fundamental properties, such as presence of right-hand or left-hand twisted cross-β sheets and overall fold of the fibril proteins. Yet, both proteins adopt highly similar β-arch conformations within the N-terminal ~21 residues. Our data demonstrate the importance of the fibril protein N-terminus for the stability of the analyzed amyloid fibril morphologies and suggest strategies of combating this disease by interfering with specific fibril polymorphs.
🔬 Techniques
🔭 Microscopes
🧬 Organisms
💻 Software
🧪 Sample Preparation
🏭 Microscope Brands
🧪 Reagent Suppliers
💻 Software Details
💾 Data Repositories
🏛️ Research Organizations (ROR)
Affiliated research institutions:
📋 Methods
Source of the murine AA amyloid fibrils Fibrils were purified from AA amyloidotic mice. Female 6- to 8-week-old NMRI mice (Charles River Laboratories) received on day 0 a single 0.1 mL injection of a 0.1 mg/mL protein solution containing murine AA amyloid fibrils into the lateral tail vein. Immediately afterwards, the animals received a subcutaneous injection of 0.2 mL freshly prepared 1 % (w/v) solution of AgNO 3 in distilled water. The AgNO 3 injection was repeated using 0.1 mL after 7 and 14 days. Animals were euthanized with CO 2 on day 16 and spleens were removed subsequently. AA fibrils from amyloid-laden mouse spleen were extracted based on a preexisting protocol 10 . In brief, 100 mg of tissue material were washed five times with 1 mL Tris calcium buffer (20 mM Tris, 138 mM NaCl, 2 mM CaCl 2 , 0.1% (w/v) NaN 3 , pH 8.0). Samples were centrifuged at 3100 × g for 1 min at 4 °C. The pellet was resuspended in 1 mL of 5 mg/mL Clostridium histolyticum collagenase (Sigma) in Tris calcium buffer. After incubation overnight at 37 °C (horizontal shaking at 750 rpm) the tissue material was centrifuged at 3100 × g for 30 min at 4 °C. The pellet was resuspended in 1 mL Tris ethylenediaminetetraacetic acid (EDTA) buffer (20 mM Tris, 140 mM NaCl, 10 mM EDTA, 0.1% (w/v) NaN 3 , pH 8.0) and homogenized. The homogenate was centrifuged for 5 min at 3100 × g at 4 °C. This step was repeated two times. Afterwards, the tissue pellet was homogenized in 200 µL ice cold water. The homogenate was centrifuged for 5 min at 3100 × g at 4 °C and the fibril containing supernatant was stored. This step was repeated four times. All animal experiments were approved by the Regierungspräsidium Tübingen. Source of the human AA amyloid fibrils A 48-year-old woman was diagnosed with chronic pulmonary obstructive disease characterized by recurrent bronchial infections. Eight years later she was diagnosed with progressively erosive seropositive rheumatoid arthritis. Amyloid was detected in a rectum biopsy. At the age of 69 the proteinuria and loss of renal function had progressed and a kidney biopsy showed AA amyloid by Congo red birefringence and immunohistochemistry. After a pneumonia the clinical situation deteriorated rapidly and she died. Informed consent was obtained from the family for autopsy and analysis of the amyloid deposits. The autopsy showed renal vein thrombosis and extensive AA amyloidosis in the arteries of all organs. Thyroid, adrenal glands, spleen, and kidneys showed prominent deposition of amyloid (in all glomeruli and in the vascular walls). AA fibrils from the diseased kidney were extracted as described above. The analysis of the fibrils was performed by ethical approval of the ethical committee from Ulm University.
Show full methods section
Source of the murine AA amyloid fibrils Fibrils were purified from AA amyloidotic mice. Female 6- to 8-week-old NMRI mice (Charles River Laboratories) received on day 0 a single 0.1 mL injection of a 0.1 mg/mL protein solution containing murine AA amyloid fibrils into the lateral tail vein. Immediately afterwards, the animals received a subcutaneous injection of 0.2 mL freshly prepared 1 % (w/v) solution of AgNO 3 in distilled water. The AgNO 3 injection was repeated using 0.1 mL after 7 and 14 days. Animals were euthanized with CO 2 on day 16 and spleens were removed subsequently. AA fibrils from amyloid-laden mouse spleen were extracted based on a preexisting protocol 10 . In brief, 100 mg of tissue material were washed five times with 1 mL Tris calcium buffer (20 mM Tris, 138 mM NaCl, 2 mM CaCl 2 , 0.1% (w/v) NaN 3 , pH 8.0). Samples were centrifuged at 3100 × g for 1 min at 4 °C. The pellet was resuspended in 1 mL of 5 mg/mL Clostridium histolyticum collagenase (Sigma) in Tris calcium buffer. After incubation overnight at 37 °C (horizontal shaking at 750 rpm) the tissue material was centrifuged at 3100 × g for 30 min at 4 °C. The pellet was resuspended in 1 mL Tris ethylenediaminetetraacetic acid (EDTA) buffer (20 mM Tris, 140 mM NaCl, 10 mM EDTA, 0.1% (w/v) NaN 3 , pH 8.0) and homogenized. The homogenate was centrifuged for 5 min at 3100 × g at 4 °C. This step was repeated two times. Afterwards, the tissue pellet was homogenized in 200 µL ice cold water. The homogenate was centrifuged for 5 min at 3100 × g at 4 °C and the fibril containing supernatant was stored. This step was repeated four times. All animal experiments were approved by the Regierungspräsidium Tübingen. Source of the human AA amyloid fibrils A 48-year-old woman was diagnosed with chronic pulmonary obstructive disease characterized by recurrent bronchial infections. Eight years later she was diagnosed with progressively erosive seropositive rheumatoid arthritis. Amyloid was detected in a rectum biopsy. At the age of 69 the proteinuria and loss of renal function had progressed and a kidney biopsy showed AA amyloid by Congo red birefringence and immunohistochemistry. After a pneumonia the clinical situation deteriorated rapidly and she died. Informed consent was obtained from the family for autopsy and analysis of the amyloid deposits. The autopsy showed renal vein thrombosis and extensive AA amyloidosis in the arteries of all organs. Thyroid, adrenal glands, spleen, and kidneys showed prominent deposition of amyloid (in all glomeruli and in the vascular walls). AA fibrils from the diseased kidney were extracted as described above. The analysis of the fibrils was performed by ethical approval of the ethical committee from Ulm University.
Denaturing gel electrophoresis
A solution of fibrils was mixed at 3:1 ratio with 4X lithium dodecyl sulfate sample buffer (Thermo Fisher Scientific) and heated at 95 °C for 10 min. Proteins were separated on a NuPAGE 4–12 % Bis-Tris gradient gel (Thermo Fisher Scientific) using NuPAGE MES LDS running buffer (Thermo Fisher Scientific). The gel was stained for 1 h with a solution of 2.5 g/L Coomassie brilliant blue R250 in 20% (v/v) ethanol and 10% (v/v) acetic acid. The gel was destained in 30% (v/v) ethanol and 10% (v/v) acetic acid.
Mass spectrometry
A sample of murine AA amyloid fibrils was dried by using a Vacuum Concentrator 5301 (Eppendorf) and resuspended in an equivalent volume of 6 M guanidine hydrochloride in 10 mM Tris buffer pH 8. The sample was desalted using a ZipTip (Merck Millipore). Matrix-assisted laser desorption/ionization MS spectra were recorded using an Ultraflex-II MALDI TOF/TOF mass spectrometer (Bruker) operated with Flex Control 3.0 software and externally calibrated with a protein calibration mixture (Bruker). One microliter of 2,5-dihydroxybenzoic acid solution (7 mg solved in 100 μL methanol, Bruker) was mixed with 1 μL protein solution. One microlitre of this mixture was deposited onto a stainless steel target. Based on our set up a maximum error of 2 Da was assumed. A sample of human AA amyloid fibrils was denatured in 6 M guanidine hydrochloride, 20 mM NaPO 4 , pH 6.5 and incubated overnight at room temperature under constant agitation at 200 rpm using a circular shaker (IKA MTS2/4 digital). Afterwards, the sample was applied onto a Source 15RPC reverse-phase 3 mL column, equilibrated in 0.1% (v/v) trifluoracetic acid in water. Proteins were eluted by a linear gradient from 0 to 100% of 86% (v/v) acetonitrile, 0.1% (v/v) trifluoracetic acid solution over 35 column volumes. For electrospray, the samples were separated on a nanoAcquity UPLC, being trapped on an Waters Acquity M-Class BEH C4 300 µm × 50 mm column (5 µm particle size and 300 Å pore size), and analyzed on an Acquity M-Class BEH C4 100 µm × 100 mm analytical column (1.7 µm particle size and 300 Å pore size), at 600 nl/min over a gradient of 3% acetonitrile/0.1% formic acid to 95% acetonitrile/0.1% formic acid (v/v). The intact protein species were analyzed on a Waters Synapt G2 HDMS in time of flight MS positive mode scanning an MS range of 2000–10,000 m/z over a four second cycle. Based on our set up a maximum error of 2 Da was assumed. Negative-stain TEM Negative-stain TEM specimens were prepared by loading 5 µL of the sample (0.2 mg/mL) onto a formvar and carbon coated 200 mesh copper grid (Plano). After incubation of the sample for 1 min at room temperature, the excess solvent was removed with filter paper. The grid was washed three times with water and stained three times with 2% (w/v) uranyl acetate solution. Grids were examined in a JEM-1400 transmission electron microscope (JEOL) that was operated at 120 kV. Platinum shadowing Formvar and carbon coated 200 mesh copper grids (Plano) were glow-discharged using a PELCO easiGlow glow discharge cleaning system (TED PELLA). A 5 µl droplet of the AA amyloid fibril sample (0.2 mg/mL) were placed onto a grid and incubated for 30 s at room temperature. Excessive solution was removed with filter paper (Whatman). Grids were washed three times with water and dried at room temperature for 30 min. Platinum was evaporated at an angle of 30° using a Balzers TKR 010 to form a 1 nm thick layer on the sample. Grids were examined in a JEM-1400 transmission electron microscope (JEOL), operated at 120 kV.
Morphological analysis
Morphological counts were obtained by visual inspection of negative-stain TEM and cryo-TEM images. Measurements of fibril width and crossover distance of 100 human and mouse fibrils each, were carried out with Fiji 38 using cryo-TEM images. Errors represent standard deviations. Cryo-EM A 4 µL (murine AA fibrils) or 3.5 µL (human AA fibrils) aliquot (0.2 mg/mL) was applied to glow-discharged holey carbon coated grids (200 mesh C-flat 2/1 for murine AA fibrils, and 400 mesh C-flat 1.2/1.3 for human AA fibrils), blotted with filter paper and plunge-frozen in liquid ethane using a Vitrobot Mark 3 (Thermo Fisher Scientific). Grids were screened using a JEM-2100 transmission electron microscope (Jeol) at 200 kV. Images were acquired using a K2-Summit detector (Gatan) in counting mode (super-resolution, murine AA fibrils) on a Titan Krios transmission electron microscope (Thermo Fisher Scientific) at 300 kV. Data acquisition parameters are listed in Supplementary Table 2 .
Helical reconstruction
Super-resolution movie frames were corrected for gain reference using IMOD 39 . Motion correction, dose-weighting and binning by a factor of 2 was done using MOTIONCOR2 40 . The contrast transfer function was estimated from the motion-corrected images using Gctf 41 . Helical reconstruction was performed using RELION 2.1 42 . Fibrils were selected manually from the aligned micrographs. Segments were extracted using a box size of ~280 Å and an inter-box distance of ~10% of the box length. Reference-free 2D classification with a regularization value of T = 2 was used to select class averages showing the helical repeat along the fibril axis. Initial 3D models for both fibrils were generated de novo from a small subset (200 particles per class) of the selected class averages using the Stochastic Gradient Descent algorithm implementation in RELION. The initial models were low-pass filtered to 20 Å and used for 3D auto-refinement to create primary fibril models with an initial twist of −1.15° (mouse fibril) or 1.54° (human fibril) and 4.8 Å (mouse fibril) or 4.7 Å (human fibril) helical rise, as evident from the cross-over distances and the layer line profiles of the 2D classes. The resulting reconstructions showed clearly separated β-sheets ( x - y plane) and partially resolved β-strands along the fibril axis. The generated primary models indicated the presence of two identical protein stacks, which are related by a pseudo-2 1 screw symmetry for both reconstructions (4.8/2 Å rise and (360°−1.15°)/2 twist for the murine fibril; 4.7/2 Å rise and (360° + 1.54°)/2 twist for the human fibril). Imposing this symmetry during reconstruction, in addition with T = 20, yielded a clear β-strand separation and side-chain densities. Three-dimensional classification with local optimization of helical twist and rise was used to further select particles in the murine dataset for a final high-resolution auto-refinement. The best 3D classes (3 out of 6) of the murine fibril were selected manually and reconstructed with local optimization of helical parameters using auto-refinement. For the human fibril dataset all particles were used for the final auto-refinement, without previous multi-class 3D classification. All 3D classification and auto-refine processes were carried out using a central part of 10% or 30% of the intermediate asymmetrical reconstruction 42 . The final reconstructions were post-processed with a soft-edge mask and an estimated map sharpening B -factor of −48 Å 2 (murine fibril) and −84 Å 2 (human fibril). The resolution was estimated from the Fourier shell correlation (FSC) at 0.143 between two independently refined half-maps.
Model building and refinement
Both maps of murine and human fibril were sharpened by applying a B-factor of −50 Å 2 using bfactor.exe (included with the FREALIGN distribution 43 ). An initial poly-alanine model was built de novo by using Coot 44 , 45 . Known geometries of β-arches and arcades were considered for model building 46 , 47 . Once the backbone geometries were refined, side-chains were added. The clear densities for side-chains allowed us to unambiguously trace the orientation and register of the polypeptide chain. A protein stack consisting of six subunits was assembled and refined with PHENIX 48 using phenix.real_space_refine 49 (phenix-1.13–2998). Non-crystallographic symmetry (NCS) restraints and constraints were imposed on all chains using a high-resolution cutoff of 3.2 Å for the murine model and 2.7 Å for the human model. Initially, manually defined tight cross β-sheet restraints were imposed and were relaxed at the later stages of refinement. Steric clashes, Ramachandran and rotamer outliers were detected during refinement using Molprobity 50 and iteratively corrected manually in Coot and refined in PHENIX. The protein stack was then fitted into the density of the opposing protein stack. The final dodecamer was first refined using rigid body refinement where each protein stack was defined as one rigid body and finally using global minimization and atomic displacement parameter (ADP) refinement with secondary structure and NCS restraints until convergence. B-factor (ADP) refinement yielded a final B-factor of 79.7 Å 2 for the murine fibril model and 17.43 Å 2 for the human fibril model 44 . Detailed refinement statistics are shown in Supplementary Table 3 . The final models were evaluated using Molprobity. For the murine model, no Ramachandran outliers were detected and 97.01% of the residues were in the favored region of the Ramachandran plot. Residues in the allowed region were residues Ala44 and Gly49, which are found in kink regions of the fibril protein. 98.08% of the residues of the human fibril model were in the favored region of the Ramachandran plot and no outliers were found. An EMRinger score 51 of 6.10 and 6.38, calculated for the murine and human dodecamer, respectively, highlights excellent model-to-map fit at high resolution and high accuracy of backbone conformation and rotamers. β-strands in the final model were analyzed using DSSP 52 or STRIDE 53 and defined manually. Image representation Image representations of reconstructed densities and refined models were created with UCSF Chimera 54 . The following structures from the PDB were reproduced in the figures: hSAA1.1 (PDB 4IP8) 24 , human phosphoglycerate kinase (PDB 3C39) 55 . Reporting summary Further information on experimental design is available in the Nature Research Reporting Summary linked to this article.
📊 Figures
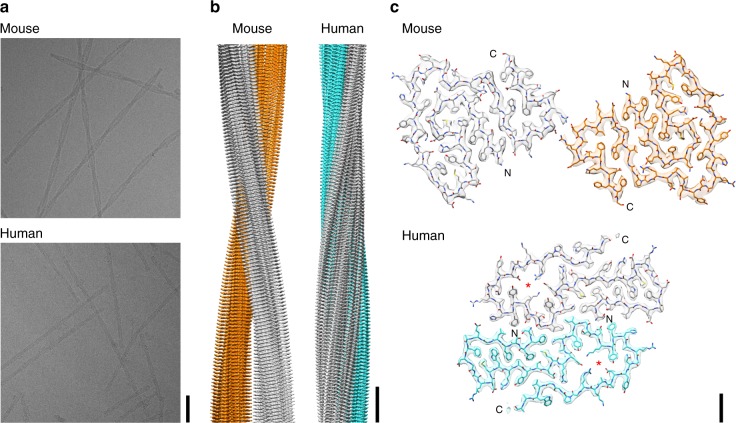
Fig. 1
Cryo-EM reconstructions of a murine and human AA amyloid fibril. a Cryo-EM images (scale bar: 50u2009nm). b Side views of the reconstructions. The two protein stacks of a fibril are colored gray and c...
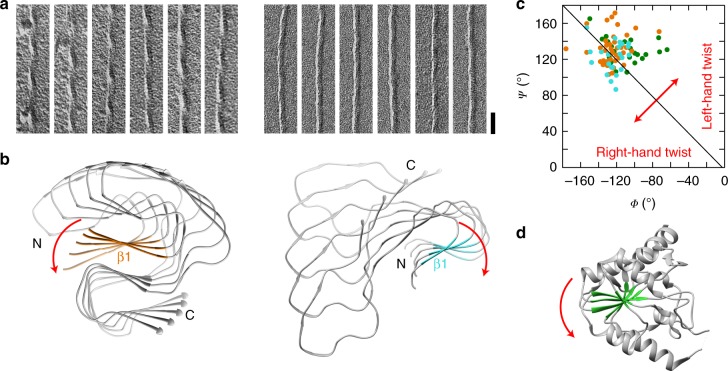
Fig. 2
Different handedness of the u03b2-sheet twist in the murine and the human fibril. a TEM images of murine (left) and human (right) AA amyloid fibrils after platinum side shadowing (scale bar: 50u2009nm...
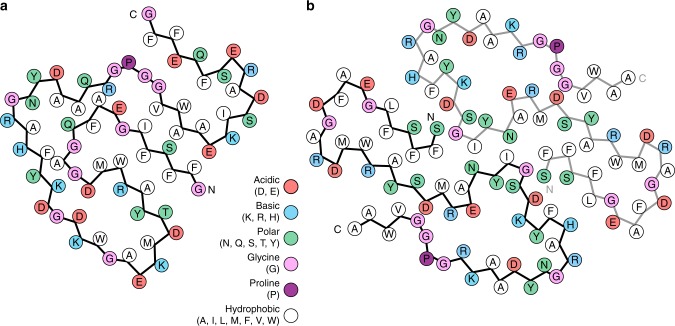
Fig. 3
Schematic view of the fibril protein illustrating the complementary packing. a Murine fibril protein. b Molecular layer of the human fibril, consisting of two fibril proteins
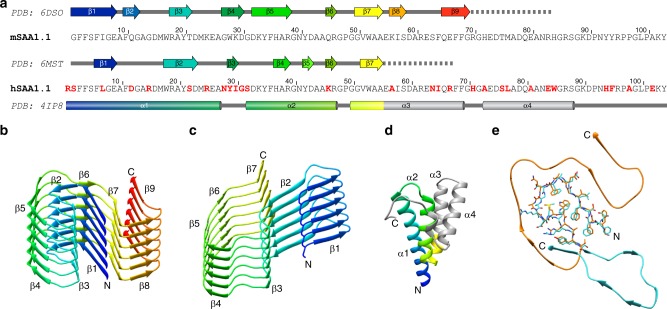
Fig. 4
Secondary structure of the fibril proteins. a Sequence comparison of mSAA1.1 and hSAA1.1. Red: amino acid substitutions in hSAA1.1 compared to mSAA1.1. Secondary structural assignments according to th...
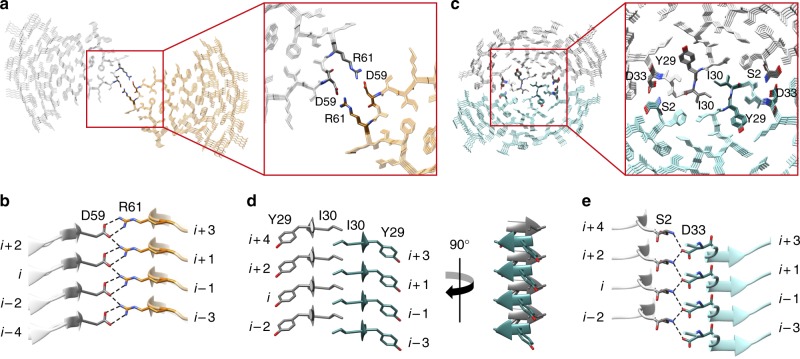
Fig. 5
Interactions between the two protein stacks in the murine and human fibril. a Cross-sectional view of four molecular layers of the murine fibril with a close-up on the stack-stack interface. b Side vi...
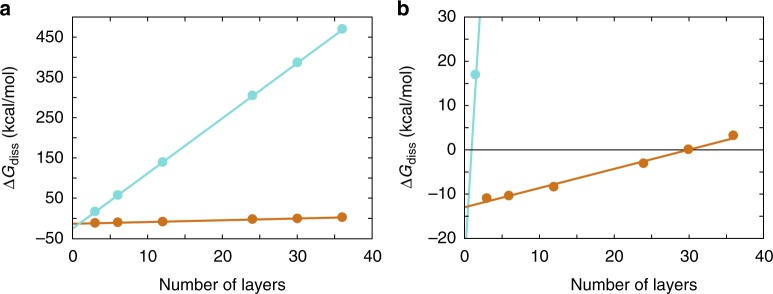
Fig. 6
Estimation of the value of u0394 G diss for the human and murine fibril. Dependence of the stack-stack interactions of the murine (orange) and human fibril (cyan) on the number of molecular layers as ...
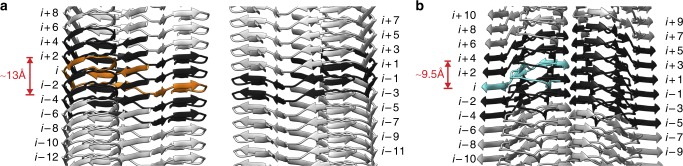
Fig. 7
Axial rise of the fibril protein interdigitates the structure. a Side view of the murine fibril. The murine fibrils shows a 13u2009u00c5 chain rise between the carbonyl carbons of Glu25 and Val51. Mol...
Figure images are served from the NIH/NLM PubMed Central Open Access Subset or Europe PMC; copyright remains with the publishers and authors.
💬 Discussion
0 commentsNo comments yet. Be the first to start a discussion!
Leave a Comment