Abstract
Abstract The aryl hydrocarbon receptor (AHR) is a ligand-dependent transcription factor that mediates a broad spectrum of (patho)physiological processes in response to numerous substances including pollutants, natural products and metabolites. However, the scarcity of structural data precludes understanding of how AHR is activated by such diverse compounds. Our 2.85 Å structure of the human indirubin-bound AHR complex with the chaperone Hsp90 and the co-chaperone XAP2, reported herein, reveals a closed conformation Hsp90 dimer with AHR threaded through its lumen and XAP2 serving as a brace. Importantly, we disclose the long-awaited structure of the AHR PAS-B domain revealing a unique organisation of the ligand-binding pocket and the structural determinants of ligand-binding specificity and promiscuity of the receptor. By providing structural details of the molecular initiating event leading to AHR activation, our study rationalises almost forty years of biochemical data and provides a framework for future mechanistic studies and structure-guided drug design.
🔬 Techniques
🔭 Microscopes
💻 Software
✨ Fluorophores
🧪 Sample Preparation
🔬 Cell Lines
🏭 Microscope Brands
🧪 Reagent Suppliers
📷 Detectors
💻 Software Details
💾 Data Repositories
🏛️ Research Organizations (ROR)
Affiliated research institutions:
📋 Methods
No statistical methods were used to predetermine sample size. The experiments were not randomised, and investigators were not blinded to allocation during experiments and outcome assessment.
Preparation of DNA constructs for structural studies Synthetic
DNA coding for human aryl hydrocarbon receptor (AHR, UniProt accession number P35869 ), heat shock protein HSP 90-beta (Hsp90, UniProt accession number P08238 ), HBV X-associated protein 2/aryl-hydrocarbon receptor-interacting protein (XAP2/AIP, UniProt accession number O00170 ) and prostaglandin E synthase 3 (p23, UniProt accession number Q15185 ) was ordered from Integrated DNA Technologies. AHR encompassing residues 1-437 was fused at its N-terminus with Twin Strep-tag and maltose binding protein (MBP). Tobacco Etch virus NIa protease (TEV) cleavage site was introduced between AHR and the tag portion of the construct. Full length Hsp90 was fused with His 6 -tag at its N-terminus. Full length XAP2 and p23 were left untagged. The DNA was cloned into pBAC4x-1 plasmid (Novagen) using In-Fusion kit (Takara Bio) and standard molecular biology techniques. The results were verified by sequencing (GENEWIZ). The final DNA construct allows expression of all 4 proteins simultaneously: Twin Strep-tag-MBP-TEV site-AHR 1-437 , His 6 -tag-Hsp90 1-724 , XAP2 1-330 and p23 1-160 . As the endogenous Hsp90 protein present in the insect cells is also able to form complexes with human AHR, double affinity purification strategy was necessary to assure that human Hsp90 exclusively will be present in the final sample. For binding studies, point mutations (H291A, F295A, S365A and Q383A) were introduced within the PAS-B domain of AHR using QuikChange Lightning Site-Directed Mutagenesis Kit (Agilent) and the results were confirmed by sequencing (GENEWIZ). The DNA sequences of the oligonucleotides used to introduce the mutations are provided in the Supplementary Table 4 .
Show full methods section
No statistical methods were used to predetermine sample size. The experiments were not randomised, and investigators were not blinded to allocation during experiments and outcome assessment.
Preparation of DNA constructs for structural studies Synthetic
DNA coding for human aryl hydrocarbon receptor (AHR, UniProt accession number P35869 ), heat shock protein HSP 90-beta (Hsp90, UniProt accession number P08238 ), HBV X-associated protein 2/aryl-hydrocarbon receptor-interacting protein (XAP2/AIP, UniProt accession number O00170 ) and prostaglandin E synthase 3 (p23, UniProt accession number Q15185 ) was ordered from Integrated DNA Technologies. AHR encompassing residues 1-437 was fused at its N-terminus with Twin Strep-tag and maltose binding protein (MBP). Tobacco Etch virus NIa protease (TEV) cleavage site was introduced between AHR and the tag portion of the construct. Full length Hsp90 was fused with His 6 -tag at its N-terminus. Full length XAP2 and p23 were left untagged. The DNA was cloned into pBAC4x-1 plasmid (Novagen) using In-Fusion kit (Takara Bio) and standard molecular biology techniques. The results were verified by sequencing (GENEWIZ). The final DNA construct allows expression of all 4 proteins simultaneously: Twin Strep-tag-MBP-TEV site-AHR 1-437 , His 6 -tag-Hsp90 1-724 , XAP2 1-330 and p23 1-160 . As the endogenous Hsp90 protein present in the insect cells is also able to form complexes with human AHR, double affinity purification strategy was necessary to assure that human Hsp90 exclusively will be present in the final sample. For binding studies, point mutations (H291A, F295A, S365A and Q383A) were introduced within the PAS-B domain of AHR using QuikChange Lightning Site-Directed Mutagenesis Kit (Agilent) and the results were confirmed by sequencing (GENEWIZ). The DNA sequences of the oligonucleotides used to introduce the mutations are provided in the Supplementary Table 4 .
Protein expression and purification
Spodoptera frugiperda Sf9 cells (Oxford Expression Technologies) were co-transfected using the described above plasmid construct and flashBAC ULTRA viral DNA (Oxford Expression Technologies). Protein expression was induced by inoculation of the cell culture at around 4 × 10 6 cells/ml with the second passage stock (P2) of the virus. 36 h post-infection cells were harvested by centrifugation, resuspended in the freezing buffer containing 50 mM Bis-Tris-HCl pH 7.0, 50 mM NaCl, 10 mM KCl, 10 mM MgCl 2 , 20 mM Na 2 MoO 4 20 mM imidazole, and 2 mM 2-mercaptoethanol (BME) and immediately used for protein purification without storing. For protein purification, cell pellets were resuspended in the freezing buffer supplemented with 2 mM PMSF (Sigma-Aldrich) and one tablet of cOmplete™ EDTA-free Protease Inhibitor Cocktail (Roche). Cells were lysed on ice using sonication and centrifuged at 40,000 x g for 30 min at 8 °C. The supernatant was filtered through 0.45 μM syringe filter (Sartorius) and applied onto 5 ml HisTrap HP column (Cytiva). The column was extensively washed using 50 CV of the washing buffer containing 20 mM Bis-Tris-HCl pH 7.0, 50 mM NaCl, 10 mM KCl, 10 mM MgCl 2 , 20 mM Na 2 MoO 4 , 20 mM imidazole and 2 mM BME. The protein complexes were eluted using a washing buffer supplemented with 500 mM imidazole. The eluted fractions were subsequently applied onto 5 ml Strep-Tactin®XT Superflow® column (IBA Lifesciences) preequilibrated with 20 mM Bis-Tris-HCl pH 7.0, 50 mM NaCl, 10 mM KCl, 10 mM MgCl 2 , 20 mM Na 2 MoO 4 and 2 mM BME. The protein was eluted with 50 mM biotin and incubated overnight with the in-house produced TEV protease in order to cleave off the Twin Strep-tag-MBP. The digestion solution was also supplemented with 2 mM ATP-MgCl 2 (Sigma-Aldrich) to stabilise the closed conformation of Hsp90. On the following day, the sample was filtered through 0.2 μM syringe filter (Sartorius) and loaded onto Capto HiRes Q 5/50 column (Cityva). The unbound material was washed away with 20 mM Bis-Tris-HCl pH 7.0, 50 mM NaCl, 10 mM KCl, 10 mM MgCl 2 , 20 mM Na 2 MoO 4 and 2 mM BME and the protein complexes with and without p23 were separated using 20 CV of 0-500 mM NaCl gradient. At this stage, the fractions containing either a ternary complex Hsp90-XAP2-AHR or a quaternary complex Hsp90-XAP2-p23-AHR were pooled separately and diluted 1:3 in the buffer containing 20 mM Bis-Tris-HCl pH 7.0, 10 mM KCl, 10 mM MgCl 2 , 20 mM Na 2 MoO 4 , 2 mM ATP-MgCl 2 and 2 mM BME. The sample was then concentrated using Amicon® Ultra-4 with the molecular weight cut-off 100 kDa (Millipore) and injected onto Superdex® 200 Increase 10/300 GL column (Cityva) preequilibrated with the final buffer containing 20 mM Bis-Tris-HCl pH 7.0, 50 mM NaCl, 10 mM KCl, 10 mM MgCl 2 , 20 mM Na 2 MoO 4 and 2 mM BME. All chromatography steps were performed using Äkta Pure protein purification system (Cityva) operating at 4 °C. The 0.5 ml protein fractions were used immediately for grid preparation or concentrated using Amicon® Ultra-4 with the molecular weight cut-off 100 kDa (Millipore), flash-frozen in liquid nitrogen and stored at −80 °C. The expression and purification of mutant proteins were performed in the analogical way. Protein concentration was calculated using absorption coefficient A 280 0.1% = 0.756. The absorption coefficients were obtained using the programme ProtParam from the ExPASy server ( http://web.expasy.org/protparam/ ).
Preparation of the complex with indirubin
Indirubin was purchased from Sigma-Aldrich (catalogue number SML0280). The compound was dissolved at 20 μM in DMSO (Sigma-Aldrich) and added to the protein solution at a 5x molar excess and 0.25% (v/v) final DMSO concentration. Before preparation of the grids, the complexes were incubated on ice for 1 h to allow sufficient time for binding.
Sample preparation for cryo-EM and data collection
The grids were prepared within 2 h following the final step of the complex purification. Only the highest concentration fraction from the middle of the size exclusion peak was used. Using the same buffer as used for the size exclusion chromatography, the proteins were diluted to the final concentration of 0.18-0.20 mg/ml. Typically, 3 μl of the protein solution were applied on the C-Flat CF-1.2/1.3-3Au grids (Protochips) that were glow-discharged using PELCO easiGlow™ Glow Discharge Unit (Ted Pella, Inc.). The grids were then blotted for 2.5 until 4.5 s at 100% humidity and room temperature and plunge-frozen in liquid ethane using FEI Vitrobot (Thermo Fisher Scientific). Grids were stored in liquid nitrogen until shipment and data collection. Cryo-EM data were collected at The Midlands Regional Cryo-EM Facility in Leicester, UK using FEI Titan Krios transmission electron microscope (Thermo Fisher Scientific) operating at 300 kV and equipped with Gatan K3 direct electron detector camera (Gatan) and GIF Quantum energy filter (Gatan) set to a slit width of 20 eV. EPU v.2.11 software was used for automatic data collection. Images were collected at nominal magnification of 81,000 in a super-resolution counting mode with a calibrated pixel size of 1.086 Å and an accumulative dose of 15 e-/pix/s and 43 frames per movie. The applied defocus range varied between −2.7 and −1.5 in 0.3 μm intervals. Details of the data collection parameters are presented in Supplementary Table 1 .
Cryo-EM data processing
Data processing was performed using RELION3.0 and 3.1 32 . The movies frames were gain-corrected, drift-corrected, dose-weighted, aligned and motion-corrected using MotionCor2 33 . The initial contrast transfer function (CTF) values for each micrograph were estimated using CTFFIND4.1 34 after which the poor-quality images were discarded. The reference-free particle picking was done with a Laplacian-of-Gaussian auto-picking mode in RELION. The detailed processing pipeline is depicted in Supplementary Fig. 2 . A total of 11,546,649 particles were picked out of 8,900 selected images. The particles were initially binned by 2 and extracted with a box size of 120 2 pixels. After one round of 2D classification, a subset of 11,343,679 particles was selected and subjected to 3D classification with 4 sub-classes, regularisation parameter T = 4 and with an initial model generated with the same set of particles and a low-pass filtered to 20 Å resolution. Among the four 3D classes, a dominant class containing 3,486,142 particles (30.7%) and displaying clear features of secondary structural elements was selected for further steps. The particles were then subjected to a 3D refinement step that yielded four sub-classes. One sub-class was identified as a dimer of Hsp90 protein alone. The second sub-class consisted of defective Hsp90-AHR complex particles without the XAP2 co-chaperone. The two remaining sub-classes containing a total of 942,224 particles of the Hsp90-XAP2-AHR ternary complex were selected and subjected to another round of 3D classification. All eight sub-classes displayed high-resolution features and the selected 1,655,792 particles were unbinned, extracted with a box size of 320 2 pixels and refined yielding a 3.90 Å reconstruction. The particles were then subjected to 3D refinement without alignment that yielded three sub-classes. Out of them, two high-resolution sub-classes containing 678,724 particles were combined and subjected to 3D refinement followed by per-particle CTF refinement and dose-weighting yielding a final global map at 2.85 Å resolution. To improve the resolution of the XAP2 and C-terminal part of AHR we created a mask around AHR PAS-B and XAP2 portion of the complex and using unbinned data we performed a focused refinement with signal subtraction. Multiple 3D classifications with number of classes ( K = 2, 3, and 4) and values of Tau ( T = 10, 20, 30 and 40) were carried out followed by 3D refinement for each obtained class. The particles belonging to the highest resolution class were selected and subjected to per-particle CTF refinement and dose-weighting yielding a focused map at 4.07 Å resolution. The overall resolution of each reconstruction was estimated using gold-standard Fourier shell correlation (FSC) = 0.143 criterion between the two half-maps 35 , 36 and presented in Supplementary Fig. 3f, h . FSC curves were calculated with a soft mask using Phenix Mtriage 37 . The composite map shown in Fig. 1a was obtained using the ‘vop add’ function in Chimera. Sphericity values for the electron density maps displayed in Supplementary Table 1 were calculated using the 3D FSC server ( https://3dfsc.salk.edu ) 38 .
Model building and refinement
Initial steps of model building were performed using Chimera 39 . For Hsp90 the protein model was based on the cryo-EM structure of the Hsp90-Cdk4-Cdc37 complex (PDB access code 5FWP). The initial model for a PAS-B domain of AHR was generated using I-Tasser 40 with CLOCK-BMAL1 (PDB access code 4F3L) and HIF-α-ARNT (PDB access code 4ZPR) structures as templates. The missing C-terminal part of the protein was built manually in Coot v0.8.9.2 41 . For the XAP2 protein, the initial model was assembled from the solution structure of the PPIase domain (PDB access code 2LKN) and crystal structure of PR domain in complex with human Hsp90 peptide (PDB access code 4AIF). The hinge region interconnecting the two domains was reconstructed manually. The focused map was used to build and refine the model for XAP2 protein and C-terminal part of AHR that was subsequently merged with the model obtained from the global map. The model of the PAS-B domain was build based on the global map that displayed higher data quality for this region compared with the focused map. The model of indirubin and associated constraints file were generated using Grade ( http://grade.globalphasing.org ) and placed inside the PAS-B domain. The asymmetric shape of the indirubin molecule was helpful with a correct placement of the model within the electron density. The structure was refined using Phenix Refine 37 . FSCs model versus map were calculated using Phenix. The geometry of the final structure was validated using Molprobity 42 .
Native mass spectrometry
Prior to MS analysis, the protein complex was buffer exchanged into 100 mM ammonium acetate buffer pH 7.0 (Sigma-Aldrich) using Bio-Spin microcentrifuge columns (Bio-Rad Laboratories). Intact MS spectra were recorded on a Synapt G2-Si HDMS instrument (Waters Corporation) modified for high mass analysis and operated in ToF mode. Samples were introduced into the ion source using borosilicate emitters (Thermo Fisher Scientific). Optimised instrument parameters were as follows: capillary voltage 1.4 kV, sampling cone voltage 150 V, offset voltage 120 V, trap collision energy 100, transfer collision voltage 25 V, argon flow rate 8 ml/min and trap bias 5 V. Data were processed using MassLynx v.4.2 (Waters). Analytical mass spectrometry and detection of molybdate Samples of the complex prepared as described in the ‘Protein expression and purification’ paragraph were injected onto Superdex® 200 Increase 10/300 GL column (Cityva) preequilibrated with the buffer devoid of molybdate: 20 mM Bis-Tris-HCl pH 7.0, 50 mM NaCl, 10 mM KCl, 10 mM MgCl 2 and 2 mM BME. The separation was performed using Äkta Pure protein purification system (Cityva) operating at 4 °C. The 0.5 ml protein fractions were pooled, concentrated using Amicon® Ultra-4 with the molecular weight cut-off 100 kDa (Millipore), flash-frozen in liquid nitrogen and stored at −80 °C. For the analysis, 100 μl of sample were diluted in 1% HNO 3 (v/v) in order to obtain a final solution of 10 ml. Trace element concentrations were determined with the Thermo Scientific iCAP TQ ICP-MS (using the Kinetic Energy Discrimination mode and He as collision gas on the “Plateforme AETE-ISO, OSU OREME, Université de Montpellier-France”). An internal solution, containing Be, Sc, Ge, Rh and Ir was added on-line to the samples to correct signal drifts. A calibration curve including four points (0, 1, 5 and 10 ppb) was analysed every 20–30 samples. The quality of the Mo analysis was checked by analysing international certified reference waters (CNRC SLRS-6). The accuracy was better than 10% relative to the certified values and the analytical error (relative standard deviation) was better than 3%. Immunoprecipitation assay The DNA was cloned into pcDNA3 (Invitrogen) using In-Fusion kit (Takara Bio) and standard molecular biology techniques. The final constructs are as follows: Twin Strep-tag-MBP-TEV site-AHR 1-437 , His 10 -tag-FLAG-tag-TEV site-Hsp90 1-724 and Myc-tag-XAP2 1-330 . Point mutations were introduced using QuikChange Lightning Site-Directed Mutagenesis Kit (Agilent) and the results were verified by sequencing (GENEWIZ). The DNA sequences of the oligonucleotides used to introduce mutations are provided in the Supplementary Table 4 . For a routine cell culture, HEK293F suspension-adapted cells (FreeStyle293F cells, Thermo Fisher Scientific) were grown and maintained in 30 ml free-styleTM 293 expression media (Gibco) in 125 ml cell culture flasks (Corning) according to manufacturer’s protocol in an orbital shaker incubator at 37 °C, 140 rpm, and 8% CO 2 . For the transfection assays, cells were seeded at 0.8 × 10 6 cells/ml into a final volume of 20 ml of the suspension medium per each 125 ml flask. A total of 20 μg of DNA were used to co-transfect the cells, corresponding to 13.3, 3.3, and 3.3 μg of expression vectors for AHR, Hsp90 and XAP2, respectively. 20 μg of DNA were added to 2 ml of the Dulbecco’s phosphate buffered saline (DPBS, Gibco) and vortexed for 5 s. Subsequently, 40 μl of 0.5 mg/ml filter-sterilised Polyethylenimine (PEI, transfected agent, Sigma Aldrich) was added to the PBS/DNA solution, the mix was vortexed for 5 s and incubated at RT for 20 min. This DNA/PEI mix was added to the cells and incubated in an orbital shaker for a further 48 h at 37 °C, 140 rpm, and 8% CO 2 . At the end of the transfection, 20 × 10 6 of cells were harvested at 250 × g for 5 min. The cell pellets were washed with 5 ml of DPBS and centrifuged at 1600 × g for additional 5 min. The supernatant was carefully removed and the cell pellets were immediately frozen at −20 °C and stored until further processing. All steps of the immunoprecipitation assay were performed on ice. Cell pellets were resuspended in 3 ml of the assay buffer containing 20 mM Bis-Tris-HCl pH 7.0, 10 mM KCl, 10 mM MgCl 2 , 20 mM Na 2 MoO 4 and 2 mM BME supplemented with cOmplete™ EDTA-free Protease Inhibitor Cocktail (Roche) and DNase I (Sigma-Aldrich). The samples were lysed by three cycles of repeated freezing and thawing. The obtained cell lysates were subsequently cleared by centrifugation at 5000 x g for 10 min. 200 μl of the resulting supernatants were transferred into a new tube, mixed with 25 μl of 50% anti-MBP Magnetic beads (New England Biolabs) and agitated for 1 h. The beads were washed three times with 20 beads volume of the assay buffer and eluted with 100 μl of the 2x SDS PAGE blue buffer using heat denaturation for 5 min at 95 °C. Samples were then analysed using Western blot technique. For the input control, 250 μl of supernatant were mixed with 250 μl of sample buffer and heated for 10 min at 95 °C. The sample were centrifuged at 11,000 x g for 1 min and resolved using 4–12% Bis-Tris Plus SDS-PAGE gels (Invitrogen). The proteins were transferred to the PVDF membrane (Bio-Rad TransBlot Turbo Midi) using the Trans-Blot Turbo Transfer System (Bio-Rad). The membranes were incubated in 5% (w/v) skimmed milk resuspended in DPBS (Sigma-Aldrich) with agitation for 1 h at 4 °C. The primary antibodies were then added and the membranes were incubated with agitation overnight at 4 °C. The primary antibodies used in this study: rat anti-MBP, (Sigma-Aldrich), dilution 1:1,000, rat anti-DYKDDDDK clone L5 (anti-FLAG, BioLegend), dilution 1:1,000, mouse anti-beta-actin (Proteintech), dilution 1:5,000, rat anti-Myc-tag clone number [9E10] (ABCAM), dilution 1:1,000 and rat anti-Strep-tag clone number [11A7] (ABCAM), dilution 1:2,000. The following day, the membranes were washed once with DPBS supplemented with 1% (v/v) Tween 20 and twice with DPBS. The secondary antibodies were then added, the membranes were agitated for 1 h at 4 °C and the wash step was repeated. The secondary antibodies used in this study: sheep anti-mouse HRP conjugated (GE Healthcare), dilution 1:3,000 and goat anti-rat HRP conjugated clone number poly4054 (BioLegend), dilution 1:5000. Finally, the membranes were revealed using ECL SuperSignal West Blot PLUS Chemiluminescent substrate (Thermo Fisher Scientific) and scanned using AMERSHAM Imager 600. The uncropped scans of the Western blot membranes are provided in the Source Data file.
Thermal stability measurements
Thermal stability of the complexes was analysed using a Tycho NT.6 (NanoTemper Technologies). The proteins were diluted to a final concentration of 2.5 μM into the buffer containing 20 mM Bis-Tris-HCl pH 7.0, 50 mM NaCl, 10 mM KCl, 10 mM MgCl 2 , 20 mM Na 2 MoO 4 and 2 mM BME. Indirubin was dissolved at 20 mM in DMSO and added to the samples to a final concentration of 12.5 μM. For the reference samples, DMSO alone was added to the final concentration 5% (v/v), the same as in the presence of the ligand. After addition of the ligand, samples were incubated at room temperature for 15 min. Thermal measurements were carried out in a range from 35 to 95 °C with steps 1 °C per min. The resulting melting curves were generated by plotting the first derivative of the fluorescence ratio at 330 nm/350 nm against temperature.
Generation of AHR reporter cell lines and culture medium
Cell culture materials were obtained from Life Technologies (Cergy-Pontoise, France). Luciferin sodium salt was purchased from Promega (Charbonnières, France). Dioxin was purchased from Campro Scientific (Berlin, Germany). All other compounds used in this study were obtained from Sigma-Aldrich (Saint-Quentin Fallavier, France). Stock solutions of the compounds were prepared in DMSO and stored at −20 °C. Fresh dilutions in the test medium were made up before each experiment. The final DMSO concentrations during treatment did not exceed 0.1% (v/v) of the test medium. The reporter HAhLH cell line was obtained by transfecting human HeLa cells with the dioxin-responsive gene XRE(TnGCGTG) 3 -tata-luciferase-Luc-hygromycin plasmid as described before 43 . H4AhLH and ZAhLH cell lines were obtained in a similar way by transfecting rat H4IIE and zebrafish ZFL cells with the dioxin-responsive gene XRE(TnGCGTG) 3 -tata-luciferase-Luc-hygromycin plasmid. HAhLH and H4AhLH cells were grown in Dulbecco’s Modified Eagle’s Medium F12 (DMEM) with phenol red, supplemented with 5% foetal calf serum (FCS), 1% antibiotics (penicillin/streptomycin) and 0.25 mg/ml hygromycin (culture medium) in a 5% CO 2 humidified atmosphere at 37 °C. For the cell treatment with compounds, phenol red-free DMEM/F-12 medium supplemented with 5% dextran-coated charcoal (DCC)-treated FBS and 1% penicillin/streptomycin was used (test medium). ZAhLH cells were cultured at 28 °C in humidified atmosphere with 5% CO 2 in LDF medium (50% Leibovitz 15 culture medium L15, 35% DMEM high glucose and 15% Ham’s-F12 medium) with 0.15 g/l sodium bicarbonate, 15 mM 4-(2-hydroxy-ethyl)−1-piperazineethanesulfonic acid (HEPES), 0.01 mg/ml insulin, 50 ng/ml epidermal growth factor (EGF), 50 U/ml penicillin and streptomycin antibiotics, 10% (v/v) foetal bovine serum (FBS). For cell treatment with the compounds, same culture medium was used except 10% (v/v) foetal bovine serum (FBS) was replaced by 5% of dextran-coated charcoal FBS (DCC). Reporter cell line assay HAhLH, H4AhLH and ZAhLH reporter cells were seeded in 96-well white opaque tissue culture plates at a density of 50,000 cells per well in 150 μl of the test medium. Test compounds were prepared at 4x concentration in the same medium, and 50 μl per well were added 24 h after seeding. Cells were incubated for 8 h in the presence of the compounds at 37 °C (HAhLH, H4AhLH) or 28 °C (ZAhLH). At the end of incubation, the medium containing test compounds was removed and replaced with test culture medium containing 0.3 mM luciferin and luminescence was measured in intact living cells for 2 s. Experiments were performed in quadruplicate for each ligand concentration. Each compound was tested in at least four independent experiments. Results were expressed as a percentage of maximal luciferase activity. Maximal luciferase activity (100%) was obtained in the presence of 10 nM (HAhLH, H4AhLH) or 30 nM (ZAhLH) dioxin. Dose response curves were modelled using GraphPad Software (version 5.0 Inc., San Diego, CA). Effective concentrations (ECs) are derived from the Hill equation. For a given compound, EC 50 is defined as the concentration inducing 50% of its maximal effect. The EC 50 values were calculated including the adjustment for the basal activity of the cell line. Molecular dynamics simulations All MD simulations were performed using Gromacs 2022 44 . The ff19sb force field 45 was employed to model the protein molecule, while ligands and water molecules were modelled with GAFF2 46 and OPC 47 force fields, respectively. Force field parameters were assigned by means of the tleap tool in AmberTools20 48 and were successively converted in Gromacs format using the amb2gro_top_gro.py script, also available in AmberTools20. The starting configurations for indirubin-bound and apo PAS-B domain (284-399) were taken directly from the cryo-EM structure of the complex. In simulations of the full complex, missing loops of Hsp90 (residues 220-275) and XAP2 (residues 110-133) molecules were modelled using the graphical interface of MODELLER available in UCSF Chimera 1.14 49 . Parameters for the molybdate ions were adapted from non-bonded parameters of phosphate ions and molybdate structural data (see Supplementary Tables 2 and 3 ). The remarkable stability of the molybdate ions in the experimental binding pose during the MD runs (RMSD ≤ 0.1 nm) reassured us about the reliability of this approximation. For the simulations of the apo system, indirubin was removed from the complex. Initial configurations were solvated in a rhombic dodecahedron box of 230 nm 3 for simulations of PAS-B domain, and of 4300 nm 3 for simulations of the full complex, neutralising the net charge of the system with 0.1 M of NaCl. A 10 ns simulation restraining the position of the heavy atoms of protein and ligand molecules was performed to let the water molecules equilibrate followed by 1 microsecond without restraints for each replica were performed in the NPT ensemble ( T = 300 K, P = 1 atm), controlling temperature and pressure by means of the v-rescale 50 and Parrinello-Rahman 51 algorithms, respectively. Periodic boundary conditions were applied, and long-range electrostatic interactions were computed with the particle mesh Ewald method 52 with cutoff of 1 nm for real space interactions, while van der Waals interactions were computed with a cutoff distance of 1 nm. All bonds were constrained using LINCS 53 , allowing for a timestep of 2 fs for the integration of the equations of motion. Lennard-Jones and electrostatic interaction energies between the protein residues and indirubin were extracted by means of the gmx energy tool in Gromacs 2022. Root mean square fluctuation (RMSF) of the backbone of bound and apo conformations were computed with the gmx rmsf tool, averaging the values for each residue. The gmx rms tool was used to compute the root mean square deviation (RMSD) of the backbone atoms of the protein in bound and apo conformations and of the indirubin molecule with respect to the backbone of the protein. Minimum distances between the heavy atoms of the residues of the protein and indirubin were computed with the gmx pairdist tool and residues were counted as in contact with indirubin when this distance was below 0.42 nm. To evaluate stacking and T-shape conformations, the angles between the rings of indirubin and of the amino acids were computed using the gmx gangle tool, while the distance between the centre of geometry of the same rings was evaluated by means of the gmx pairdist tool.
Data analysis and figure preparation
Figures were generated using UCSF Chimera v1.13.1 39 and ChimeraX v1.3 54 . Ligand binding data were analysed with GraphPad Software version 5.0 Inc., San Diego, CA. PAS-B topology diagram was obtained using Pro-origami 55 . The cavity within the PAS-B domain vas calculated using CASTp 26 . Sequence alignment was performed using Clustal Omega 56 and visualised using ESPript 3.0 ( https://espript.ibcp.fr ) 57 . Plots were generated using Prism v9 (GraphPad). Reporting summary Further information on research design is available in the Nature Portfolio Reporting Summary linked to this article.
Supplementary information Supplementary Information Peer Review File Description of Additional Supplementary Files Supplementary Movie 1 Supplementary Movie 2 Supplementary Movie 3 Reporting Summary
📊 Figures
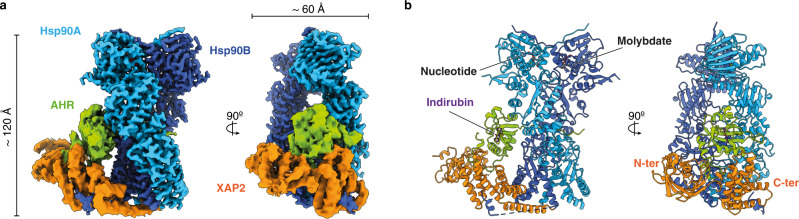
Fig. 1
Overall architecture of the agonist-bound cytosolic complex of AHR.
a A composite map of the Hsp90-XAP2-AHR complex in two orthogonal views. Hsp90A (light blue), Hsp90B (dark blue), XAP2 (orange), AHR (green). The same colour scheme is used throughout the manuscript u...
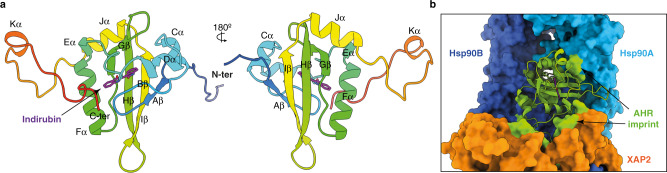
Fig. 2
Structure of the AHR PAS-B domain.
a Two opposing views of the PAS-B domain in cartoon representation coloured in rainbow from N- to C-terminus. The elements of the secondary structure are labelled. The indirubin molecule is shown as s...
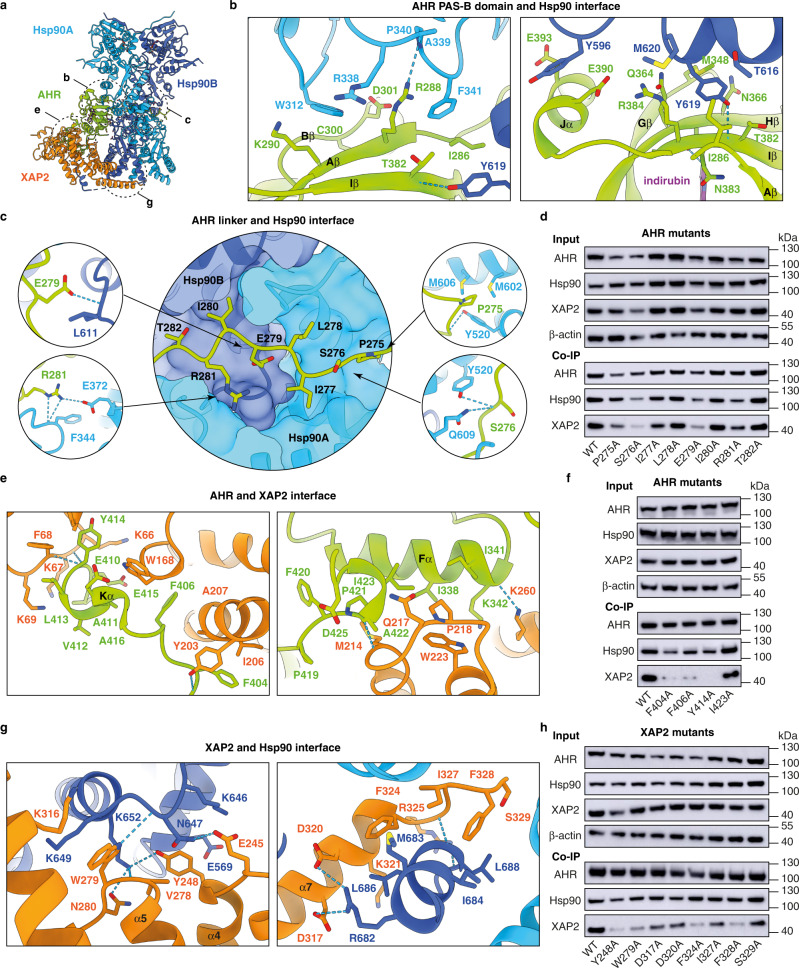
Fig. 3
Details of the Hsp90-XAP2-AHR complex organisation.
a An overall view of the complex with indicated location of the interaction sites between the proteins. The dashed circles indicate the contacts described in the following panels. b Two principal inte...
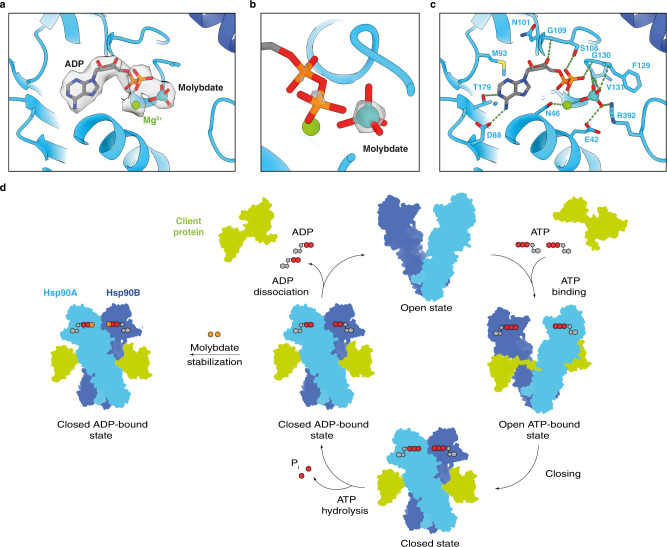
Fig. 4
Detailed analysis of the nucleotide binding site of Hsp90.
a Close-up view of the nucleotide binding site in molecule A of Hsp90. The electron density map for the molecule of ADP, molybdate anion and magnesium cation has been displayed. b Close-up view of the...
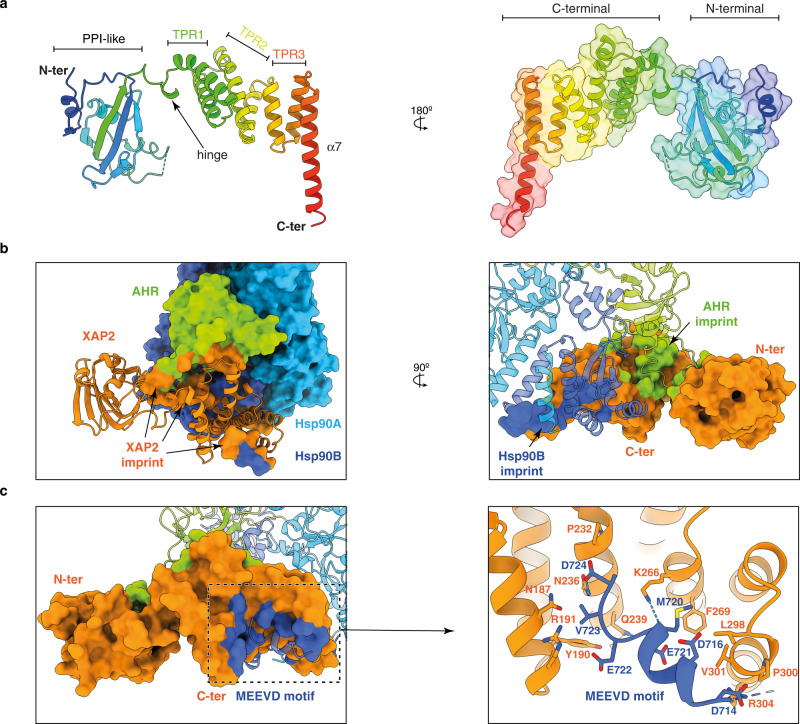
Fig. 5
Detailed analysis of XAP2 protein and its interactions with the other partners.
a Cartoon representation of XAP2 protein in two views coloured in rainbow from N- to C-terminus. Location of the most important features is indicated. XAP2 is composed of two domains that are separate...
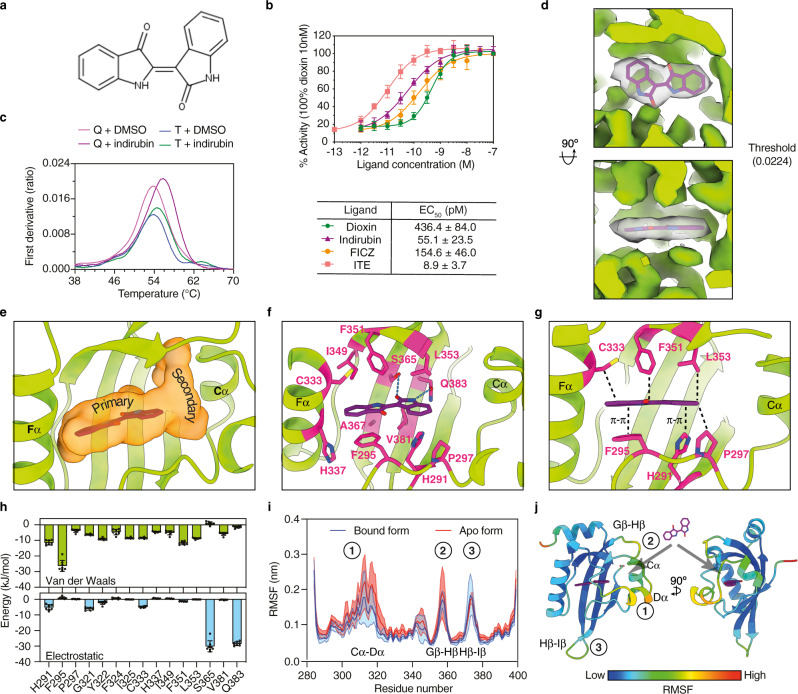
Fig. 6
Characterization of the interaction with indirubin.
a Structure of indirubin. b Results of cell-based activity assays for four AHR ligands. The results are represented as mean valueu2009u00b1u2009SD from independent biological replicates ( n =u20094). ...
Figure images are served from the NIH/NLM PubMed Central Open Access Subset or Europe PMC; copyright remains with the publishers and authors.
💬 Discussion
0 commentsNo comments yet. Be the first to start a discussion!
Leave a Comment