Abstract
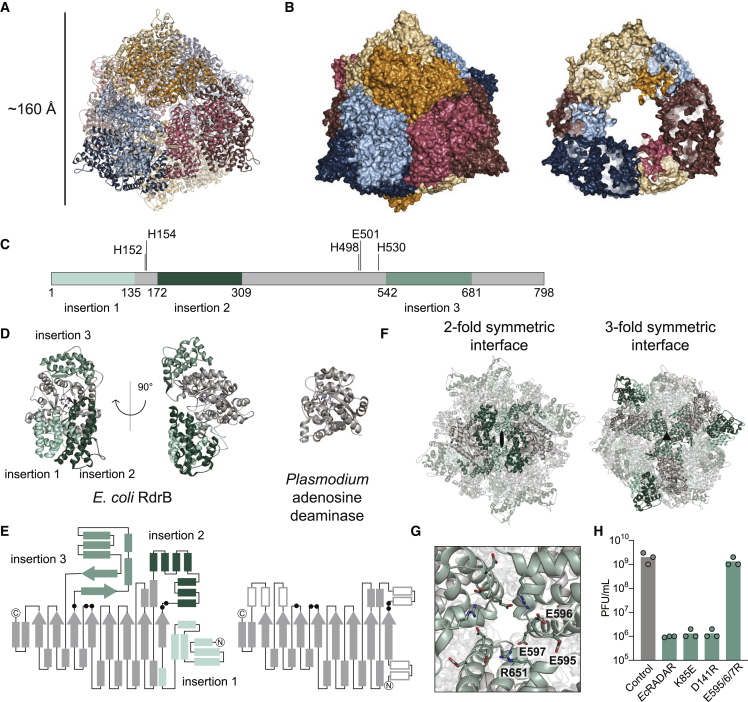
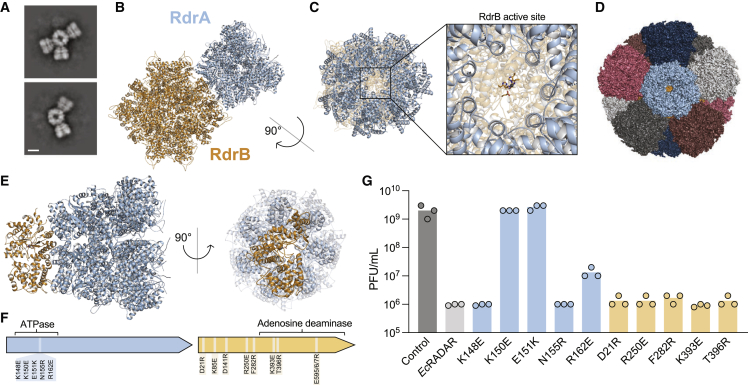
RADAR is a two-protein bacterial defense system that was reported to defend against phage by "editing" messenger RNA. Here, we determine cryo-EM structures of the RADAR defense complex, revealing RdrA as a heptameric, two-layered AAA+ ATPase and RdrB as a dodecameric, hollow complex with twelve surface-exposed deaminase active sites. RdrA and RdrB join to form a giant assembly up to 10 MDa, with RdrA docked as a funnel over the RdrB active site. Surprisingly, our structures reveal an RdrB active site that targets mononucleotides. We show that RdrB catalyzes ATP-to-ITP conversion in vitro and induces the massive accumulation of inosine mononucleotides during phage infection in vivo, limiting phage replication. Our results define ATP mononucleotide deamination as a determinant of RADAR immunity and reveal supramolecular assembly of a nucleotide-modifying machine as a mechanism of anti-phage defense.
🔬 Techniques
🧬 Organisms
✨ Fluorophores
🧪 Sample Preparation
🏭 Microscope Brands
🧪 Reagent Suppliers
📷 Detectors
💻 Software Details
💾 Data Repositories
🏛️ Research Organizations (ROR)
Affiliated research institutions:
📋 Methods
Key resources table REAGENT or RESOURCE SOURCE IDENTIFIER
Bacterial and virus strains
E. coli BL21-DE3 RIL Agilent 230245 E. coli MG1655 Coli Genetic Stock Center CGSC6300 Phage T2 German Collection of Microorganisms and Cell Cultures GmbH (DSMZ) DSM 16352,Accession: LC348380.1 Phage T4 U. Qimron Accession: AF158101.6 Phage T6 German Collection of Microorganisms and Cell Cultures GmbH (DSMZ) DSM 4622,Accession: MH550421.1 Phage T5 U. Qimron Accession: AY543070.1 Phage T7 U. Qimron Accession: NC_001604.1 Lambda vir U. Qimron Accession: NC_001416.1 Chemicals, peptides, and recombinant proteins Ni-NTA Agarose Qiagen 30250 HiTrap Q HP Column Cytvia 17115401 Zorbax Bonus-RP Agilent 863668-901 SRT SEC-300 Sepax 215300-7830 Nuclease P1 from Penicillium citrinum Sigma-Aldrich N8630 Alkaline Phosphatase, Quick CIP New England Biolabs M0525S Quantifoil R 2/1 300 mesh grids, copper Electron Microscopy Sciences FCF400-Cu Recombinant DNA pBbE8k-RFP Lee et al. 39 Addgene Cat#35276 pSG1 Doron et al. 5 N/A pBAD-GFP Thermo Fisher Scientific Cat #43001 E. coli P0304799.3 RADAR Genscript Corp. N/A C. rodentium DBS100 RADAR Genscript Corp. N/A S. suis SS993 RADAR Genscript Corp. N/A Ec RADAR_A_K82A Genscript Corp. N/A Ec RADAR_A_E151K Genscript Corp. N/A Ec RADAR_A_N155R Genscript Corp. N/A Ec RADAR_A_K148E Genscript Corp. N/A Ec RADAR_A_K150E Genscript Corp. N/A Ec RADAR_A_R162E Genscript Corp. N/A Ec RADAR_B_E501A Genscript Corp. N/A Ec RADAR_B_K85E Genscript Corp. N/A Ec RADAR_B_E595/596/597R Genscript Corp. N/A Ec RADAR_B_D141R Genscript Corp. N/A Ec RADAR_B_K393E Genscript Corp. N/A Ec RADAR_B_R250E Genscript Corp. N/A Ec RADAR_B_F282R Genscript Corp. N/A Ec RADAR_B_D21R Genscript Corp. N/A Ec RADAR_B_T396R Genscript Corp. N/A Deposited data Ec RdrA unsplit This paper EMD: 29323, PDB: 8FNT Ec RdrA single split This paper EMD: 29324 Ec RdrA double split This paper EMD: 29325 Ss RdrA This paper EMD: 29326, PDB: 8FNU Ec RdrB This paper EMD: 29327, PDB: 8FNV Ec RdrA– Ec RdrB This paper EMD: 29328, PDB: 8FNW Oligonucleotides Primers, see Table S5 This paper N/A Software and algorithms Phenix 1.13-2998 Adams et al. 40 https://www.phenix-online.org/ Coot 0.8.9 Emsley and Cowtan 41 https://www2.mrc-lmb.cam.ac.uk/personal/pemsley/coot/ Pymol v1.7.4.4 Schrödinger, LLC https://pymol.org/ Prism 7.0d GraphPad software https://www.graphpad.com/scientific-software/prism/ Resource availability Lead contact Further information and requests for resources and reagents should be directed to and will be fulfilled by the lead contact, Philip Kranzusch ( philip_kranzusch@dfci.harvard.edu ).
Show full methods section
Key resources table REAGENT or RESOURCE SOURCE IDENTIFIER
Bacterial and virus strains
E. coli BL21-DE3 RIL Agilent 230245 E. coli MG1655 Coli Genetic Stock Center CGSC6300 Phage T2 German Collection of Microorganisms and Cell Cultures GmbH (DSMZ) DSM 16352,Accession: LC348380.1 Phage T4 U. Qimron Accession: AF158101.6 Phage T6 German Collection of Microorganisms and Cell Cultures GmbH (DSMZ) DSM 4622,Accession: MH550421.1 Phage T5 U. Qimron Accession: AY543070.1 Phage T7 U. Qimron Accession: NC_001604.1 Lambda vir U. Qimron Accession: NC_001416.1 Chemicals, peptides, and recombinant proteins Ni-NTA Agarose Qiagen 30250 HiTrap Q HP Column Cytvia 17115401 Zorbax Bonus-RP Agilent 863668-901 SRT SEC-300 Sepax 215300-7830 Nuclease P1 from Penicillium citrinum Sigma-Aldrich N8630 Alkaline Phosphatase, Quick CIP New England Biolabs M0525S Quantifoil R 2/1 300 mesh grids, copper Electron Microscopy Sciences FCF400-Cu Recombinant DNA pBbE8k-RFP Lee et al. 39 Addgene Cat#35276 pSG1 Doron et al. 5 N/A pBAD-GFP Thermo Fisher Scientific Cat #43001 E. coli P0304799.3 RADAR Genscript Corp. N/A C. rodentium DBS100 RADAR Genscript Corp. N/A S. suis SS993 RADAR Genscript Corp. N/A Ec RADAR_A_K82A Genscript Corp. N/A Ec RADAR_A_E151K Genscript Corp. N/A Ec RADAR_A_N155R Genscript Corp. N/A Ec RADAR_A_K148E Genscript Corp. N/A Ec RADAR_A_K150E Genscript Corp. N/A Ec RADAR_A_R162E Genscript Corp. N/A Ec RADAR_B_E501A Genscript Corp. N/A Ec RADAR_B_K85E Genscript Corp. N/A Ec RADAR_B_E595/596/597R Genscript Corp. N/A Ec RADAR_B_D141R Genscript Corp. N/A Ec RADAR_B_K393E Genscript Corp. N/A Ec RADAR_B_R250E Genscript Corp. N/A Ec RADAR_B_F282R Genscript Corp. N/A Ec RADAR_B_D21R Genscript Corp. N/A Ec RADAR_B_T396R Genscript Corp. N/A Deposited data Ec RdrA unsplit This paper EMD: 29323, PDB: 8FNT Ec RdrA single split This paper EMD: 29324 Ec RdrA double split This paper EMD: 29325 Ss RdrA This paper EMD: 29326, PDB: 8FNU Ec RdrB This paper EMD: 29327, PDB: 8FNV Ec RdrA– Ec RdrB This paper EMD: 29328, PDB: 8FNW Oligonucleotides Primers, see Table S5 This paper N/A Software and algorithms Phenix 1.13-2998 Adams et al. 40 https://www.phenix-online.org/ Coot 0.8.9 Emsley and Cowtan 41 https://www2.mrc-lmb.cam.ac.uk/personal/pemsley/coot/ Pymol v1.7.4.4 Schrödinger, LLC https://pymol.org/ Prism 7.0d GraphPad software https://www.graphpad.com/scientific-software/prism/ Resource availability Lead contact Further information and requests for resources and reagents should be directed to and will be fulfilled by the lead contact, Philip Kranzusch ( philip_kranzusch@dfci.harvard.edu ).
Materials availability
This study did not generate new unique reagents.
Experimental model and subject details Bacterial strains and phages
E. coli strain MG1655 (ATCC 47076) was grown in MMB (LB supplemented with 0.1 mM MnCl 2 , 5 mM MgCl 2 , with or without 0.5% agar) at 37°C or room temperature (RT). Whenever applicable, media were supplemented with ampicillin (100 μg mL −1 ), to ensure the maintenance of plasmids. Infection was performed in MMB media at 37°C or RT as detailed in each section. Phages used in this study are listed in the key resources table . Method details Protein expression and purification Recombinant E. coli RdrA and RdrB and S. suis RdrA were purified using methods previously described. 36 Briefly, RdrA and RdrB were cloned into an N-terminal 6×His-SUMO2-tagged pET vector and transformed into BL21-RIL E. coli (Agilent). Large scale cultures (2–4 liters) were grown for ∼5 h at 37°C, then induced with IPTG overnight at 16°C. Bacterial pellets were resuspended and sonicated in lysis buffer (20 mM HEPES-KOH pH 7.5, 400 mM NaCl, 30 mM imidazole, 10% glycerol and 1 mM DTT) and purified using Ni-NTA resin (Qiagen). Ni-NTA resin was washed with lysis buffer supplemented to 1 M NaCl and eluted with lysis buffer supplemented to 300 mM imidazole. The Ni-NTA elution fraction was dialyzed into 20 mM HEPES-KOH pH 7.5, 250 mM KCl, 1 mM DTT overnight while removing the SUMO2 tag with recombinant human SENP2 protease (D364–L589, M497A). RdrA was bound to a Q column (Cytvia) and eluted with a gradient of KCl from 150 mM to 1 M. RdrA and RdrB were each concentrated using a 30K-cutoff concentrator (Millipore) and purified by size exclusion chromatography on a 16/60 Sephacryl 300 column. Proteins were concentrated to >10 mg mL −1 , flash frozen with liquid nitrogen, and stored at −80°C.
Plasmid and strain construction
RADAR operons used for phage challenge assays in this study were synthesized by Genscript Corp. and cloned into the p15a-origin-containing pSG1 plasmid with their native promoters, or into the pBAD plasmid (Thermofisher, cat. #43001), as previously described. 10 Mutants of the system were also synthesized and cloned by Genscript. All synthesized sequences are presented in Table S4 . Inducible mutants of RdrB were constructed using Q5 Site directed Mutagenesis kit (NEB, cat. #E0554S), using primers described in Table S5 .
Plaque assays
Phages were propagated by picking a single phage plaque into a liquid culture of E. coli MG1655 grown at 37°C to OD 600 of 0.3 in MMB medium until culture collapse. The culture was then centrifuged for 10 min at 15,000 × g and the supernatant was filtered through a 0.2 μm filter to get rid of remaining bacteria and bacterial debris. Lysate titer was determined using the small drop plaque assay method as described before. 42 Plaque assays were performed as previously described. 42 Bacteria ( E. coli MG1655 with pSG1 or pBAD plasmid) and negative control ( E. coli MG1655 with empty pSG1 or pBad-GFP) were grown overnight at 37°C. Then 300 μL of the bacterial culture was mixed with 30 mL melted MMB agar (LB supplemented with 0.1 mM MnCl 2 , 5 mM MgCl 2 , 0.5% agar, with or without 0.2% arabinose) and left to dry for 1 h at room temperature. 10-fold serial dilutions in MMB were performed for each of the tested phages and 10 μL drops were put on the bacterial layer. Plates were incubated overnight at RT. Plaque forming units (PFUs) were determined by counting the derived plaques after overnight incubation.
Liquid toxicity assay
Overnight cultures of bacteria harboring a pSG1 plasmid with Ec RdrA and an inducible plasmid (pBbE8k) with different versions of Ec RdrB or a GFP control were diluted 1:100 in MMB medium. Cells were incubated at 37°C while shaking at 200 rpm for 1 h. 180 μL of the bacterial culture were transferred into wells in a 96-well plate supplemented with 2% arabinose and incubated at 37°C with shaking in a TECAN Infinite200 plate reader. OD 600 was followed with measurement every 10 min.
Cryo-electron microscopy data collection
Solutions of purified RdrA, RdrB, and a combination of both, were applied to glow discharged grids and vitrified in liquid ethane. For RdrA and RdrB, concentrations of 2.40 and 2.35 mg mL −1 were used respectively. For the combination of both, RdrA and RdrB were mixed in a 1:1 ration resulting in final concentrations of 1 mg mL −1 and 0.98 mg mL −1 respectively. The ideal concentrations to use were based off the preliminary negative stain data. To vitrify the sample on TEM grids, a Mark IV Vitrobot (ThermoFisher) was used. A 3 μL solution of each sample were independently deposited onto 1.2 / 1.3 Au Quantifoil grid with Carbon mesh then blotted with filter paper for 6 seconds, using a double-sided blot with a force of 5, in a 100% relative humidity chamber at 4°C. S. suis RdrA, as well as E. coli RdrA and RdrB combination grids, were screened and imaged using a Talos Arctica (ThermoFisher) microscope operating at 200 kV and equipped with K3 direct electron detector (Gatan). Approximately 300 and 240 movies were acquired of the RdrA and the RdrA and RdrB combination sample, respectively, using SerialEM software version 3.8.6 at a pixel size of 1.1 Å, a total dose of 42.02 e− /Å 2 , dose per frame of 1.05 e− /Å 2 . A defocus range of −0.7 to −2.0 μm was used for E. coli RdrA and RdrB combination grids while a defocus range of −0.5 to −3.0 μm was used for S. suis RdrA. E. coli RdrA and E. coli RdrB grids were screened and imaged using a Titan Krios microscope operating at 300 kV and equipped with a K3 direct electron detector with energy filter (Gatan). All data was acquired using SerialEM software version 3.8.6 at a pixel size of 0.825 Å and a defocus range of −0.5 to −2.5 μm. Approximately 11,200 movies of E. coli RdrA were collected at a total dose of 48.8 e− /Å 2 , dose per frame of 1.16 e− /Å 2 . Approximately 5,700 movies of E. coli RdrB were collected with a total dose of 48.8 e− /Å 2 , dose per frame of 1.16 e− /Å 2 .
Cryo-EM data processing Dose-fractionated images of E. coli
RdrA were gain normalized and motion corrected with MotionCor2 (v1.3.1) 43 followed by CTF and defocus value determination in CTFFIND4. 44 Particle picking was carried out in crYOLO 45 resulting in 2,296,605 initial particles. Following multiple rounds of 2D classification in RELION 46 to remove erroneous picks, contamination, and “junk” particles 1,578,051 particles representing intact RdrA were obtained. Heterogeneous refinement in cryosparc 47 identified three different populations of RdrA, totaling 1,314,627 particles. Following particle polishing 48 and CTF refinement 49 in RELION on the combined data a further cycle of heterogeneous refinement followed by Non-uniform refinement 50 and additional CTF refinement in cryosparc resulted in the “no split”, “single split”, and “double split” reconstructions at resolutions of 2.3, 2,5 and 2.5 Å respectively ( Figure S2 A). E. coli RdrB was processed in a similar manner with 842,931 particles initial identified, leading to 712,803 after 2D classification. Following multiple rounds of heterogeneous refinement in cryopsarc 233,454 particles were subjected to polishing, CTF refinement, particle polishing, additional 2D classification and finally Non-uniform refinement resulting in a 2.1 Å reconstruction with T symmetry (2.5 Å C1) ( Figure S3 A). The small set of E. coli RdrA-RdrB complex images were motion corrected using the RELION implementation, followed by CTFFIND4 and particle picking in crYOLO, resulting in 20,409 particles. All particles were subjected to ab initio reconstruction into three classes in cryosparc. 9,236 particles were identified corresponding to the complex, resulting in a 6.7 Å reconstruction following refinement. Dose-fractionated images of S. suis RdrA were gain normalized and motion corrected with MotionCor2 (v1.4.0) followed by CTF and defocus value determination in CTFFIND4. 44 crYOLO models were trained to identify potential “monomer” (single heptametic ring) and “dimer” (double stacked rings) species. These were then combined and duplicate particles removed prior to 2D classification in RELION which resulted in 573,499 particles after “junk” removal. These particles then underwent multiple rounds of heterogeneous refinement within cryosparc alongside CTF refinement resulting in 193,305 particles in total. These particles were polished in RELION before a final round of CTF refinement and Non-uniform refinement in cryosparc resulting in the final C7 reconstruction at 2.5 Å (2.7 Å C1). Structural biology applications other than cryosparc used in this project were compiled and configured by SBGrid. 51 Negative stain electron microscopy E coli RdrA and RdrB were mixed to a final concentration of 50 nM for each protein in buffer containing 100 mM KCl, 50 mM HEPES pH 7.5, and 1 mM TCEP. 4 μL samples were applied to glow-discharged copper grids (Electron Microscopy Sciences, cat. #FCF400-Cu), stained with 2% uranyl formate, and imaged on a JEOL-1400 at 80kV. To determine sample quality for subsequent cryo-EM analysis, 30 micrographs were acquired at 40kx magnification (3.3 pixels nm -1 ) and used for 2D classification in RELION. 46 Select 2D classes representing different arrangements of RdrA petals around the RdrB core were analyzed in ImageJ to add scale bars.
RNA sequencing
Overnight cultures of bacteria ( E. coli MG1655 harboring pSG1- Ec RADAR or pSG1- Cr RADAR plasmid) or negative control ( E. coli MG1655 with the pSG1 plasmid) were diluted 1:100 in 60 mL of MMB medium and incubated at 37°C while shaking at 200 rpm until early log phase (OD 600 of 0.3). 10 mL samples of each bacterial culture were taken and centrifuged at 4000 rpm for 5 min at 4°C. The pellets were flash frozen using dry ice and ethanol. The remaining cultures were infected by phage T4 or T2, at a final MOI of 2. 10 mL samples were taken throughout infection at 0, 15, 27 and 120 min post infection (for Ec RADAR), or 0, 15, 27 and 60 min post infection (for Cr RADAR), and centrifuged and flash frozen as described above. RNA extraction was performed as described previously. 52 Briefly, frozen pellets were re-suspended in 1 mL of RNA protect solution (FastPrep) and lysed by Fastprep homogenizer (MP Biomedicals). RNA was extracted using the FastRNA PRO blue kit (MP Biomedicals, 116025050) according to the manufacturer’s instructions. DNase treatment was performed using the Turbo DNA free kit (Life Technologies, AM2238). RNA was subsequently fragmented using fragmentation buffer (Ambion-Invitrogen, cat. #10136824) at 72°C for 1 min and 45 s. The reactions were cleaned by adding ×2.5 SPRI beads (Agencourt AMPure XP, Beckman Coulter, A63881). The beads were washed twice with 80% ethanol and air dried for 5 min. The RNA was eluted using water. Ribosomal RNA was depleted by using the Ribo-Zero rRNA Removal Kit (Epicentre, MRZB12424). Strand-specific RNA-seq was performed using the NEBNext Ultra Directional RNA Library Prep Kit (NEB, E7420) with the following adjustments: all cleanup stages were performed using ×1.8 SPRI beads, and only one cleanup step was performed after the end repair step. Following sequencing on an Illumina NextSeq500, sequenced reads were demultiplexed and adapters were trimmed using ‘fastx clipper’ software with default parameters. Reads were mapped to the bacterial and phage genomes by using NovoAlign (Novocraft) v3.02.02 with default parameters as previously described. 52 Reads mapped to rRNA genes were discarded. Reads mapping equally well to multiple positions in the reference genome, as well as reads containing insertions and deletions as compared to the reference genome, were also discarded. Only reads mapping to the antisense strand of annotated genes were used for the mutation analyses, as these reads represent cDNA generated from the mRNA. Mutations from reference genomes were identified and quantified by counting each mismatch across the transcriptome. Frequency of mismatches was compared between control and RADAR samples throughout the infection time course.
Cell lysate preparation
Overnight cultures of E. coli harboring the defensive system and negative controls were diluted 1:100 in 250 mL MMB medium (with or without 0.2% arabinose, as described in Table S4 and grown at 37°C (250 rpm) until reaching OD 600 of 0.3. The cultures were infected by T2 or T4 at a final MOI of 2. Following the addition of phage, at 5, 15 and 60 or 120 min post infection (plus an uninfected control sample), 50 mL samples were taken and centrifuged for 5 min at 15,000 × g. Pellets were flash frozen using dry ice and ethanol. The pellets were re-suspended in 600 μL of 100 mM phosphate buffer at pH 8 and supplemented with 4 mg mL −1 lysozyme. The samples were then transferred to a FastPrep Lysing Matrix B 2 mL tube (MP Biomedicals cat. #116911100) and lysed using a FastPrep bead beater for 40 s at 6 m s −1 (two cycles). Tubes were then centrifuged at 4°C for 15 min at 15,000 × g. Supernatant was transferred to Amicon Ultra-0.5 Centrifugal Filter Unit 3 kDa (Merck Millipore cat. #UFC500396) and centrifuged for 45 min at 4°C at 12,000 × g. Filtrate was taken and used for LC-MS analysis.
Detection of inosine compounds by untargeted HPLC-MS
Profiling of polar metabolites was done as previously described 53 with minor modifications as described below. In brief, the analysis was performed using an Acquity I class UPLC System combined with a mass spectrometer (Thermo Exactive Plus Orbitrap), which was operated in a positive ionization mode using a mass range of 200–800 m/z. The LC separation was done using the SeQuant Zic-pHilic (150 mm × 2.1 mm) with the SeQuant guard column (20 mm × 2.1 mm) (Merck). The mobile phase B was acetonitrile and mobile phase A was 20 mM ammonium carbonate plus 0.1% ammonia hydroxide in water. The flow rate was kept at 200 μl min −1 and the gradient was as follows: 75% B (0–2 min), decrease to 25% B (2–14 min), 25% B (14–18 min), increase back to 75% B (18–19 min), 75% B (19–23 min). Inosine derivatives peaks were identified in the data using MSMS fragmentation, by identifying the inosine base signature as well as phosphates, ribose or deoxyribose. Area under the peak was quantified using MZmine 2.53 54 with an accepted deviation of 5 ppm.
Quantitative MS methods
Cell lysates were prepared as described above and sent for analysis at the Targeted Metabolomics unit of the Weizmann institute. Quantification of nucleotides was carried out using an Acquity I-class UPLC system coupled to Xevo TQ-S triple quadrupole mass spectrometer (both Waters). The UPLC was performed using a SeQuant ZIC-pHILIC column as described previously, 55 with linear gradient decrease of acetonitrile in 20 mmol L −1 ammonium carbonate for 10 min. Mass spectrometry analysis was performed using electrospray interface in positive ionization mode for all metabolites. Metabolites were detected using multiple-reaction monitoring (MRM), using argon as the collision gas. Quantification was made using a standard curve in the 0–1 μg mL −1 concentration range. 13 C 10 -ATP and 15 N 5 -AMP were added to standards and samples as internal standards to get final concentrations 10 μmol L −1 and 0.5 μmol L −1 , respectively. TargetLynx (Waters) was used for data analysis. Standards and materials used for this analysis were purchased from the following resources. Deoxyadenosine 5′-monophosphate (dAMP), deoxyadenosine (dA), deoxyinosine (dI), inosine 5′-diphosphate (IDP), inosine (I), 13 C 10 -adenosine 5’-triphosphate ( 13 C 10 -ATP) and 15 N 5 -adenosine 5′-monophosphate ( 15 N 5 -AMP) were purchased from Merck. Deoxyinosine 5’-triphosphate (dITP), deoxyinosine 5’-monophosphate (dIMP), and Inosine 5′-triphosphate (ITP) were purchased from Santa Cruz Biotechnology. Deoxyadenosine 5′-diphosphate (dADP) was purchased from Alfa Aesar. Analysis of base editing by HPLC All RdrB reactions were carried out at 37°C in standard reaction conditions: 50 mM KCl, 50 mM HEPES pH 7.5, 1 mM TCEP, 10 mM MgCl 2 , 100 μM ZnSO 4 , and 1–10 μM E. coli RdrB. For monomeric substrates (ATP, dATP, AMP, adenosine), 1 mM final concentration of substrate was used, and reactions were incubated for 30 min before heating to 90°C to end reactions. For comparison of ATP and dATP conversion, reactions containing 1 mM ATP and 1 mM dATP were incubated at 37°C for 10 min. Hairpin RNA experiments contained 1 μM hairpin RNA and were at 37°C for 1 h. Reactions were treated with calf intestinal phosphatase (New England Biolabs) and hairpin RNA samples were concurrently treated with P1 nuclease to release monomeric NMPs for analysis, then samples were spun through a 0.2 μm filter. Analysis was carried out using a C18 column (Agilent Zorbax Bonus-RP 4.6×150 mm, 3.5-micron). The column was heated to 40°C and run at 1 mL min −1 with a mobile phase of 50 mM NaH 2 PO 4 (pH 6.8 with NaOH) supplemented with 3% acetonitrile. ATPase activity Purified E. coli RdrA (5 μM) was incubated with 1 mM indicated NTP for 2 h with 50 mM KCl, 50 mM HEPES-KOH pH 7.5, 1 mM TCEP, and 10 mM MgCl 2 . Malachite green (Sigma-Aldrich MAK307) was used to quantify phosphate released by NTP hydrolysis, following the manufacturer’s instructions. Samples were diluted 1:8 so released phosphate was within linear range of detection based on phosphate standards. Absorbance at 650 nm of a “blank” sample with no protein was subtracted from all samples, then the absorbance was used to calculate the molarity of phosphate released based on a standard curve created using phosphate standards. Samples were measured in technical duplicate and are representative of 4 independent biological replicates.
Quantification and statistical analysis
Statistical details for each experiment can be found in the figure legends and outlined in the corresponding method details section. Bar graphs show the average of replicates with individual points overlaid, unless stated otherwise.
Materials availability
This study did not generate new unique reagents.
Experimental model and subject details Bacterial strains and phages
E. coli strain MG1655 (ATCC 47076) was grown in MMB (LB supplemented with 0.1 mM MnCl 2 , 5 mM MgCl 2 , with or without 0.5% agar) at 37°C or room temperature (RT). Whenever applicable, media were supplemented with ampicillin (100 μg mL −1 ), to ensure the maintenance of plasmids. Infection was performed in MMB media at 37°C or RT as detailed in each section. Phages used in this study are listed in the key resources table .
Method details Protein expression and purification Recombinant E. coli RdrA and RdrB and S. suis RdrA were purified using methods previously described. 36 Briefly, RdrA and RdrB were cloned into an N-terminal 6×His-SUMO2-tagged pET vector and transformed into BL21-RIL E. coli (Agilent). Large scale cultures (2–4 liters) were grown for ∼5 h at 37°C, then induced with IPTG overnight at 16°C. Bacterial pellets were resuspended and sonicated in lysis buffer (20 mM HEPES-KOH pH 7.5, 400 mM NaCl, 30 mM imidazole, 10% glycerol and 1 mM DTT) and purified using Ni-NTA resin (Qiagen). Ni-NTA resin was washed with lysis buffer supplemented to 1 M NaCl and eluted with lysis buffer supplemented to 300 mM imidazole. The Ni-NTA elution fraction was dialyzed into 20 mM HEPES-KOH pH 7.5, 250 mM KCl, 1 mM DTT overnight while removing the SUMO2 tag with recombinant human SENP2 protease (D364–L589, M497A). RdrA was bound to a Q column (Cytvia) and eluted with a gradient of KCl from 150 mM to 1 M. RdrA and RdrB were each concentrated using a 30K-cutoff concentrator (Millipore) and purified by size exclusion chromatography on a 16/60 Sephacryl 300 column. Proteins were concentrated to >10 mg mL −1 , flash frozen with liquid nitrogen, and stored at −80°C.
Plasmid and strain construction
RADAR operons used for phage challenge assays in this study were synthesized by Genscript Corp. and cloned into the p15a-origin-containing pSG1 plasmid with their native promoters, or into the pBAD plasmid (Thermofisher, cat. #43001), as previously described. 10 Mutants of the system were also synthesized and cloned by Genscript. All synthesized sequences are presented in Table S4 . Inducible mutants of RdrB were constructed using Q5 Site directed Mutagenesis kit (NEB, cat. #E0554S), using primers described in Table S5 .
Plaque assays
Phages were propagated by picking a single phage plaque into a liquid culture of E. coli MG1655 grown at 37°C to OD 600 of 0.3 in MMB medium until culture collapse. The culture was then centrifuged for 10 min at 15,000 × g and the supernatant was filtered through a 0.2 μm filter to get rid of remaining bacteria and bacterial debris. Lysate titer was determined using the small drop plaque assay method as described before. 42 Plaque assays were performed as previously described. 42 Bacteria ( E. coli MG1655 with pSG1 or pBAD plasmid) and negative control ( E. coli MG1655 with empty pSG1 or pBad-GFP) were grown overnight at 37°C. Then 300 μL of the bacterial culture was mixed with 30 mL melted MMB agar (LB supplemented with 0.1 mM MnCl 2 , 5 mM MgCl 2 , 0.5% agar, with or without 0.2% arabinose) and left to dry for 1 h at room temperature. 10-fold serial dilutions in MMB were performed for each of the tested phages and 10 μL drops were put on the bacterial layer. Plates were incubated overnight at RT. Plaque forming units (PFUs) were determined by counting the derived plaques after overnight incubation.
Liquid toxicity assay
Overnight cultures of bacteria harboring a pSG1 plasmid with Ec RdrA and an inducible plasmid (pBbE8k) with different versions of Ec RdrB or a GFP control were diluted 1:100 in MMB medium. Cells were incubated at 37°C while shaking at 200 rpm for 1 h. 180 μL of the bacterial culture were transferred into wells in a 96-well plate supplemented with 2% arabinose and incubated at 37°C with shaking in a TECAN Infinite200 plate reader. OD 600 was followed with measurement every 10 min.
Cryo-electron microscopy data collection
Solutions of purified RdrA, RdrB, and a combination of both, were applied to glow discharged grids and vitrified in liquid ethane. For RdrA and RdrB, concentrations of 2.40 and 2.35 mg mL −1 were used respectively. For the combination of both, RdrA and RdrB were mixed in a 1:1 ration resulting in final concentrations of 1 mg mL −1 and 0.98 mg mL −1 respectively. The ideal concentrations to use were based off the preliminary negative stain data. To vitrify the sample on TEM grids, a Mark IV Vitrobot (ThermoFisher) was used. A 3 μL solution of each sample were independently deposited onto 1.2 / 1.3 Au Quantifoil grid with Carbon mesh then blotted with filter paper for 6 seconds, using a double-sided blot with a force of 5, in a 100% relative humidity chamber at 4°C. S. suis RdrA, as well as E. coli RdrA and RdrB combination grids, were screened and imaged using a Talos Arctica (ThermoFisher) microscope operating at 200 kV and equipped with K3 direct electron detector (Gatan). Approximately 300 and 240 movies were acquired of the RdrA and the RdrA and RdrB combination sample, respectively, using SerialEM software version 3.8.6 at a pixel size of 1.1 Å, a total dose of 42.02 e− /Å 2 , dose per frame of 1.05 e− /Å 2 . A defocus range of −0.7 to −2.0 μm was used for E. coli RdrA and RdrB combination grids while a defocus range of −0.5 to −3.0 μm was used for S. suis RdrA. E. coli RdrA and E. coli RdrB grids were screened and imaged using a Titan Krios microscope operating at 300 kV and equipped with a K3 direct electron detector with energy filter (Gatan). All data was acquired using SerialEM software version 3.8.6 at a pixel size of 0.825 Å and a defocus range of −0.5 to −2.5 μm. Approximately 11,200 movies of E. coli RdrA were collected at a total dose of 48.8 e− /Å 2 , dose per frame of 1.16 e− /Å 2 . Approximately 5,700 movies of E. coli RdrB were collected with a total dose of 48.8 e− /Å 2 , dose per frame of 1.16 e− /Å 2 .
Cryo-EM data processing Dose-fractionated images of E. coli
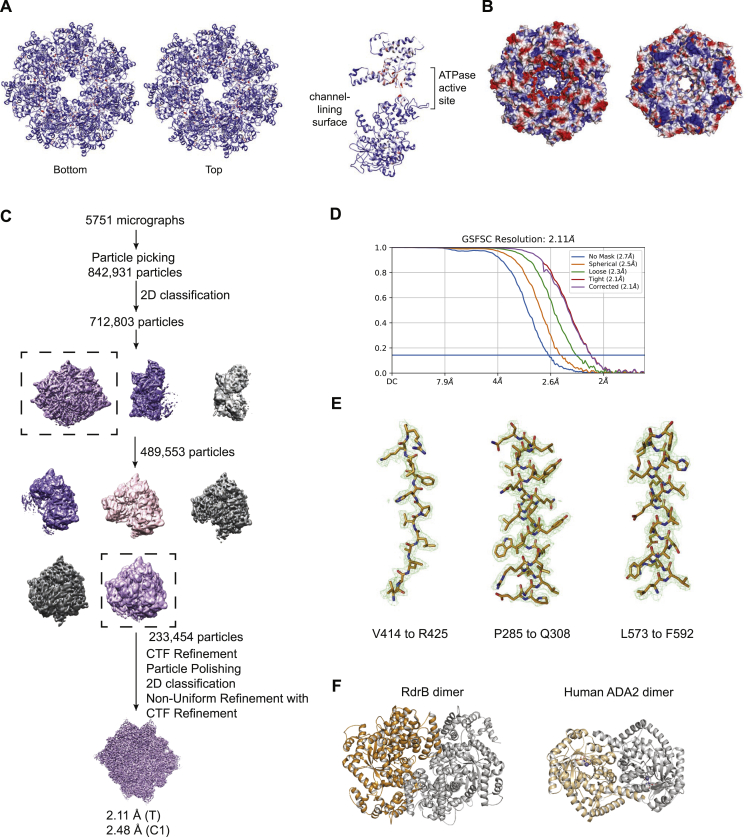
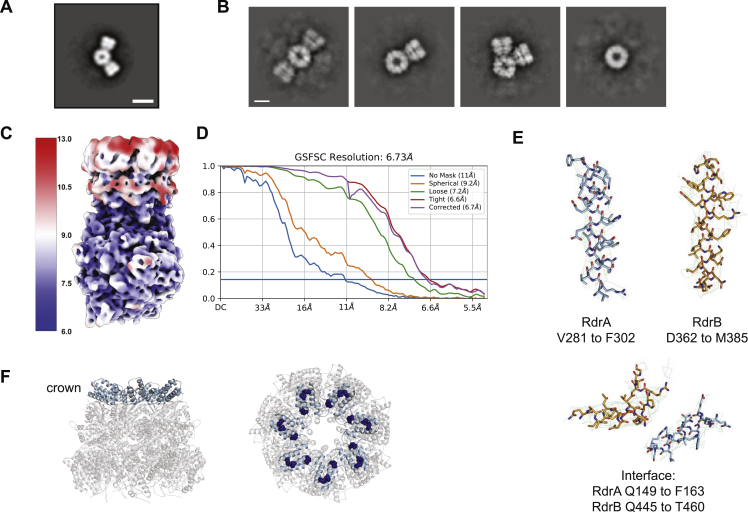
RdrA were gain normalized and motion corrected with MotionCor2 (v1.3.1) 43 followed by CTF and defocus value determination in CTFFIND4. 44 Particle picking was carried out in crYOLO 45 resulting in 2,296,605 initial particles. Following multiple rounds of 2D classification in RELION 46 to remove erroneous picks, contamination, and “junk” particles 1,578,051 particles representing intact RdrA were obtained. Heterogeneous refinement in cryosparc 47 identified three different populations of RdrA, totaling 1,314,627 particles. Following particle polishing 48 and CTF refinement 49 in RELION on the combined data a further cycle of heterogeneous refinement followed by Non-uniform refinement 50 and additional CTF refinement in cryosparc resulted in the “no split”, “single split”, and “double split” reconstructions at resolutions of 2.3, 2,5 and 2.5 Å respectively ( Figure S2 A). E. coli RdrB was processed in a similar manner with 842,931 particles initial identified, leading to 712,803 after 2D classification. Following multiple rounds of heterogeneous refinement in cryopsarc 233,454 particles were subjected to polishing, CTF refinement, particle polishing, additional 2D classification and finally Non-uniform refinement resulting in a 2.1 Å reconstruction with T symmetry (2.5 Å C1) ( Figure S3 A). The small set of E. coli RdrA-RdrB complex images were motion corrected using the RELION implementation, followed by CTFFIND4 and particle picking in crYOLO, resulting in 20,409 particles. All particles were subjected to ab initio reconstruction into three classes in cryosparc. 9,236 particles were identified corresponding to the complex, resulting in a 6.7 Å reconstruction following refinement. Dose-fractionated images of S. suis RdrA were gain normalized and motion corrected with MotionCor2 (v1.4.0) followed by CTF and defocus value determination in CTFFIND4. 44 crYOLO models were trained to identify potential “monomer” (single heptametic ring) and “dimer” (double stacked rings) species. These were then combined and duplicate particles removed prior to 2D classification in RELION which resulted in 573,499 particles after “junk” removal. These particles then underwent multiple rounds of heterogeneous refinement within cryosparc alongside CTF refinement resulting in 193,305 particles in total. These particles were polished in RELION before a final round of CTF refinement and Non-uniform refinement in cryosparc resulting in the final C7 reconstruction at 2.5 Å (2.7 Å C1). Structural biology applications other than cryosparc used in this project were compiled and configured by SBGrid. 51 Negative stain electron microscopy E coli RdrA and RdrB were mixed to a final concentration of 50 nM for each protein in buffer containing 100 mM KCl, 50 mM HEPES pH 7.5, and 1 mM TCEP. 4 μL samples were applied to glow-discharged copper grids (Electron Microscopy Sciences, cat. #FCF400-Cu), stained with 2% uranyl formate, and imaged on a JEOL-1400 at 80kV. To determine sample quality for subsequent cryo-EM analysis, 30 micrographs were acquired at 40kx magnification (3.3 pixels nm -1 ) and used for 2D classification in RELION. 46 Select 2D classes representing different arrangements of RdrA petals around the RdrB core were analyzed in ImageJ to add scale bars.
RNA sequencing
Overnight cultures of bacteria ( E. coli MG1655 harboring pSG1- Ec RADAR or pSG1- Cr RADAR plasmid) or negative control ( E. coli MG1655 with the pSG1 plasmid) were diluted 1:100 in 60 mL of MMB medium and incubated at 37°C while shaking at 200 rpm until early log phase (OD 600 of 0.3). 10 mL samples of each bacterial culture were taken and centrifuged at 4000 rpm for 5 min at 4°C. The pellets were flash frozen using dry ice and ethanol. The remaining cultures were infected by phage T4 or T2, at a final MOI of 2. 10 mL samples were taken throughout infection at 0, 15, 27 and 120 min post infection (for Ec RADAR), or 0, 15, 27 and 60 min post infection (for Cr RADAR), and centrifuged and flash frozen as described above. RNA extraction was performed as described previously. 52 Briefly, frozen pellets were re-suspended in 1 mL of RNA protect solution (FastPrep) and lysed by Fastprep homogenizer (MP Biomedicals). RNA was extracted using the FastRNA PRO blue kit (MP Biomedicals, 116025050) according to the manufacturer’s instructions. DNase treatment was performed using the Turbo DNA free kit (Life Technologies, AM2238). RNA was subsequently fragmented using fragmentation buffer (Ambion-Invitrogen, cat. #10136824) at 72°C for 1 min and 45 s. The reactions were cleaned by adding ×2.5 SPRI beads (Agencourt AMPure XP, Beckman Coulter, A63881). The beads were washed twice with 80% ethanol and air dried for 5 min. The RNA was eluted using water. Ribosomal RNA was depleted by using the Ribo-Zero rRNA Removal Kit (Epicentre, MRZB12424). Strand-specific RNA-seq was performed using the NEBNext Ultra Directional RNA Library Prep Kit (NEB, E7420) with the following adjustments: all cleanup stages were performed using ×1.8 SPRI beads, and only one cleanup step was performed after the end repair step. Following sequencing on an Illumina NextSeq500, sequenced reads were demultiplexed and adapters were trimmed using ‘fastx clipper’ software with default parameters. Reads were mapped to the bacterial and phage genomes by using NovoAlign (Novocraft) v3.02.02 with default parameters as previously described. 52 Reads mapped to rRNA genes were discarded. Reads mapping equally well to multiple positions in the reference genome, as well as reads containing insertions and deletions as compared to the reference genome, were also discarded. Only reads mapping to the antisense strand of annotated genes were used for the mutation analyses, as these reads represent cDNA generated from the mRNA. Mutations from reference genomes were identified and quantified by counting each mismatch across the transcriptome. Frequency of mismatches was compared between control and RADAR samples throughout the infection time course.
Cell lysate preparation
Overnight cultures of E. coli harboring the defensive system and negative controls were diluted 1:100 in 250 mL MMB medium (with or without 0.2% arabinose, as described in Table S4 and grown at 37°C (250 rpm) until reaching OD 600 of 0.3. The cultures were infected by T2 or T4 at a final MOI of 2. Following the addition of phage, at 5, 15 and 60 or 120 min post infection (plus an uninfected control sample), 50 mL samples were taken and centrifuged for 5 min at 15,000 × g. Pellets were flash frozen using dry ice and ethanol. The pellets were re-suspended in 600 μL of 100 mM phosphate buffer at pH 8 and supplemented with 4 mg mL −1 lysozyme. The samples were then transferred to a FastPrep Lysing Matrix B 2 mL tube (MP Biomedicals cat. #116911100) and lysed using a FastPrep bead beater for 40 s at 6 m s −1 (two cycles). Tubes were then centrifuged at 4°C for 15 min at 15,000 × g. Supernatant was transferred to Amicon Ultra-0.5 Centrifugal Filter Unit 3 kDa (Merck Millipore cat. #UFC500396) and centrifuged for 45 min at 4°C at 12,000 × g. Filtrate was taken and used for LC-MS analysis.
Detection of inosine compounds by untargeted HPLC-MS
Profiling of polar metabolites was done as previously described 53 with minor modifications as described below. In brief, the analysis was performed using an Acquity I class UPLC System combined with a mass spectrometer (Thermo Exactive Plus Orbitrap), which was operated in a positive ionization mode using a mass range of 200–800 m/z. The LC separation was done using the SeQuant Zic-pHilic (150 mm × 2.1 mm) with the SeQuant guard column (20 mm × 2.1 mm) (Merck). The mobile phase B was acetonitrile and mobile phase A was 20 mM ammonium carbonate plus 0.1% ammonia hydroxide in water. The flow rate was kept at 200 μl min −1 and the gradient was as follows: 75% B (0–2 min), decrease to 25% B (2–14 min), 25% B (14–18 min), increase back to 75% B (18–19 min), 75% B (19–23 min). Inosine derivatives peaks were identified in the data using MSMS fragmentation, by identifying the inosine base signature as well as phosphates, ribose or deoxyribose. Area under the peak was quantified using MZmine 2.53 54 with an accepted deviation of 5 ppm.
Quantitative MS methods
Cell lysates were prepared as described above and sent for analysis at the Targeted Metabolomics unit of the Weizmann institute. Quantification of nucleotides was carried out using an Acquity I-class UPLC system coupled to Xevo TQ-S triple quadrupole mass spectrometer (both Waters). The UPLC was performed using a SeQuant ZIC-pHILIC column as described previously, 55 with linear gradient decrease of acetonitrile in 20 mmol L −1 ammonium carbonate for 10 min. Mass spectrometry analysis was performed using electrospray interface in positive ionization mode for all metabolites. Metabolites were detected using multiple-reaction monitoring (MRM), using argon as the collision gas. Quantification was made using a standard curve in the 0–1 μg mL −1 concentration range. 13 C 10 -ATP and 15 N 5 -AMP were added to standards and samples as internal standards to get final concentrations 10 μmol L −1 and 0.5 μmol L −1 , respectively. TargetLynx (Waters) was used for data analysis. Standards and materials used for this analysis were purchased from the following resources. Deoxyadenosine 5′-monophosphate (dAMP), deoxyadenosine (dA), deoxyinosine (dI), inosine 5′-diphosphate (IDP), inosine (I), 13 C 10 -adenosine 5’-triphosphate ( 13 C 10 -ATP) and 15 N 5 -adenosine 5′-monophosphate ( 15 N 5 -AMP) were purchased from Merck. Deoxyinosine 5’-triphosphate (dITP), deoxyinosine 5’-monophosphate (dIMP), and Inosine 5′-triphosphate (ITP) were purchased from Santa Cruz Biotechnology. Deoxyadenosine 5′-diphosphate (dADP) was purchased from Alfa Aesar. Analysis of base editing by HPLC All RdrB reactions were carried out at 37°C in standard reaction conditions: 50 mM KCl, 50 mM HEPES pH 7.5, 1 mM TCEP, 10 mM MgCl 2 , 100 μM ZnSO 4 , and 1–10 μM E. coli RdrB. For monomeric substrates (ATP, dATP, AMP, adenosine), 1 mM final concentration of substrate was used, and reactions were incubated for 30 min before heating to 90°C to end reactions. For comparison of ATP and dATP conversion, reactions containing 1 mM ATP and 1 mM dATP were incubated at 37°C for 10 min. Hairpin RNA experiments contained 1 μM hairpin RNA and were at 37°C for 1 h. Reactions were treated with calf intestinal phosphatase (New England Biolabs) and hairpin RNA samples were concurrently treated with P1 nuclease to release monomeric NMPs for analysis, then samples were spun through a 0.2 μm filter. Analysis was carried out using a C18 column (Agilent Zorbax Bonus-RP 4.6×150 mm, 3.5-micron). The column was heated to 40°C and run at 1 mL min −1 with a mobile phase of 50 mM NaH 2 PO 4 (pH 6.8 with NaOH) supplemented with 3% acetonitrile. ATPase activity Purified E. coli RdrA (5 μM) was incubated with 1 mM indicated NTP for 2 h with 50 mM KCl, 50 mM HEPES-KOH pH 7.5, 1 mM TCEP, and 10 mM MgCl 2 . Malachite green (Sigma-Aldrich MAK307) was used to quantify phosphate released by NTP hydrolysis, following the manufacturer’s instructions. Samples were diluted 1:8 so released phosphate was within linear range of detection based on phosphate standards. Absorbance at 650 nm of a “blank” sample with no protein was subtracted from all samples, then the absorbance was used to calculate the molarity of phosphate released based on a standard curve created using phosphate standards. Samples were measured in technical duplicate and are representative of 4 independent biological replicates.
Quantitative MS methods
Cell lysates were prepared as described above and sent for analysis at the Targeted Metabolomics unit of the Weizmann institute. Quantification of nucleotides was carried out using an Acquity I-class UPLC system coupled to Xevo TQ-S triple quadrupole mass spectrometer (both Waters). The UPLC was performed using a SeQuant ZIC-pHILIC column as described previously, 55 with linear gradient decrease of acetonitrile in 20 mmol L −1 ammonium carbonate for 10 min. Mass spectrometry analysis was performed using electrospray interface in positive ionization mode for all metabolites. Metabolites were detected using multiple-reaction monitoring (MRM), using argon as the collision gas. Quantification was made using a standard curve in the 0–1 μg mL −1 concentration range. 13 C 10 -ATP and 15 N 5 -AMP were added to standards and samples as internal standards to get final concentrations 10 μmol L −1 and 0.5 μmol L −1 , respectively. TargetLynx (Waters) was used for data analysis. Standards and materials used for this analysis were purchased from the following resources. Deoxyadenosine 5′-monophosphate (dAMP), deoxyadenosine (dA), deoxyinosine (dI), inosine 5′-diphosphate (IDP), inosine (I), 13 C 10 -adenosine 5’-triphosphate ( 13 C 10 -ATP) and 15 N 5 -adenosine 5′-monophosphate ( 15 N 5 -AMP) were purchased from Merck. Deoxyinosine 5’-triphosphate (dITP), deoxyinosine 5’-monophosphate (dIMP), and Inosine 5′-triphosphate (ITP) were purchased from Santa Cruz Biotechnology. Deoxyadenosine 5′-diphosphate (dADP) was purchased from Alfa Aesar.
Supplemental information Table S1. RADAR defense system distribution, related to Figure 1 Table S2. Structure statistics, related to Figures 2, 3, and 4 Table S3. RNA sequencing, related to Figure 5 Table S4. Sequences synthesized in this study, related to Figure 1 Table S5. Primers used in this study, related to Figure 1
📊 Figures
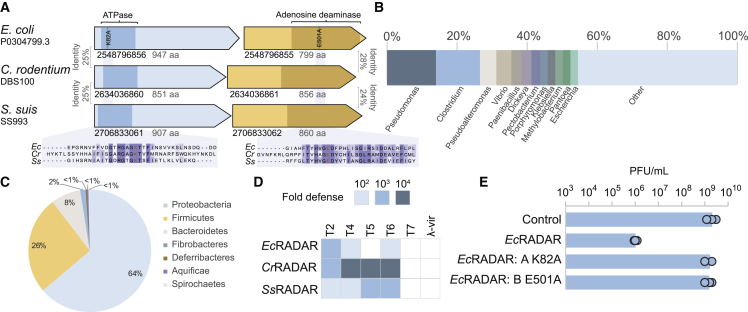
Figureu00a01
Diverse RADAR systems protect E.u00a0coli from phage replication (A) RADAR systems studied here. Gene IDs in the IMG database are indicated. (B) Genera of bacteria encoding RADAR. (C) Phylum distribut...
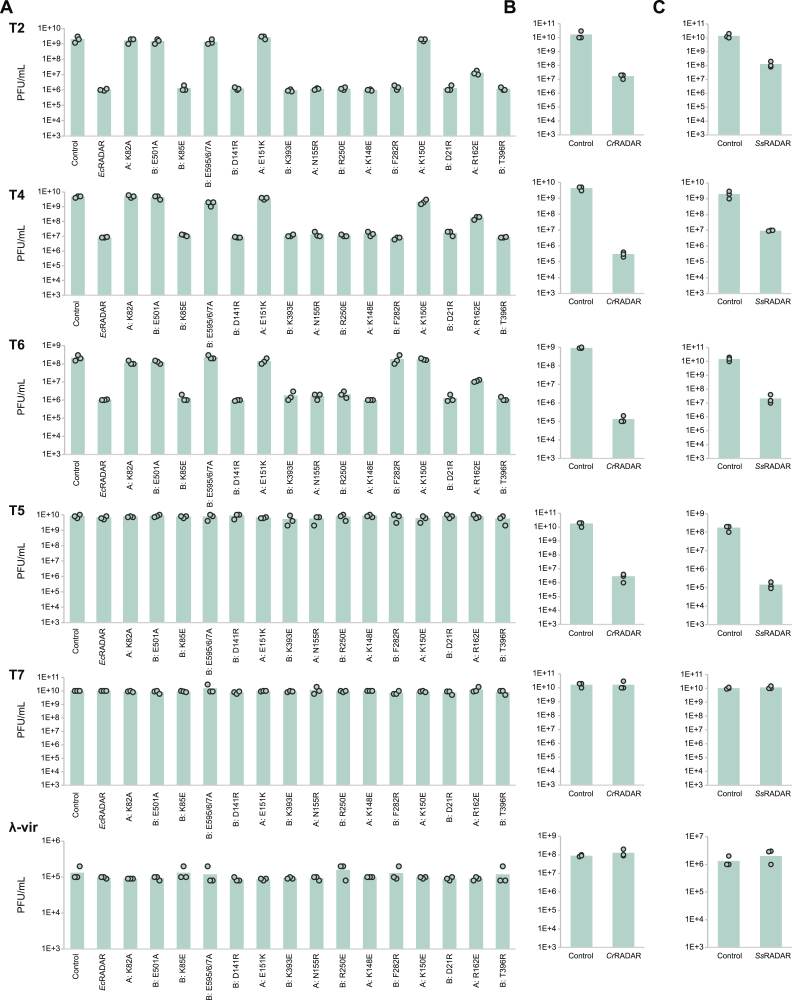
Figureu00a0S1
RADAR system from E.u00a0coli P0304799.3, C.u00a0rodentium DBS100, and S.u00a0suis SS993 protect against phage infection, related to Figureu00a01 (A) Bacteria expressing WT RADAR system from E.u00a0co...
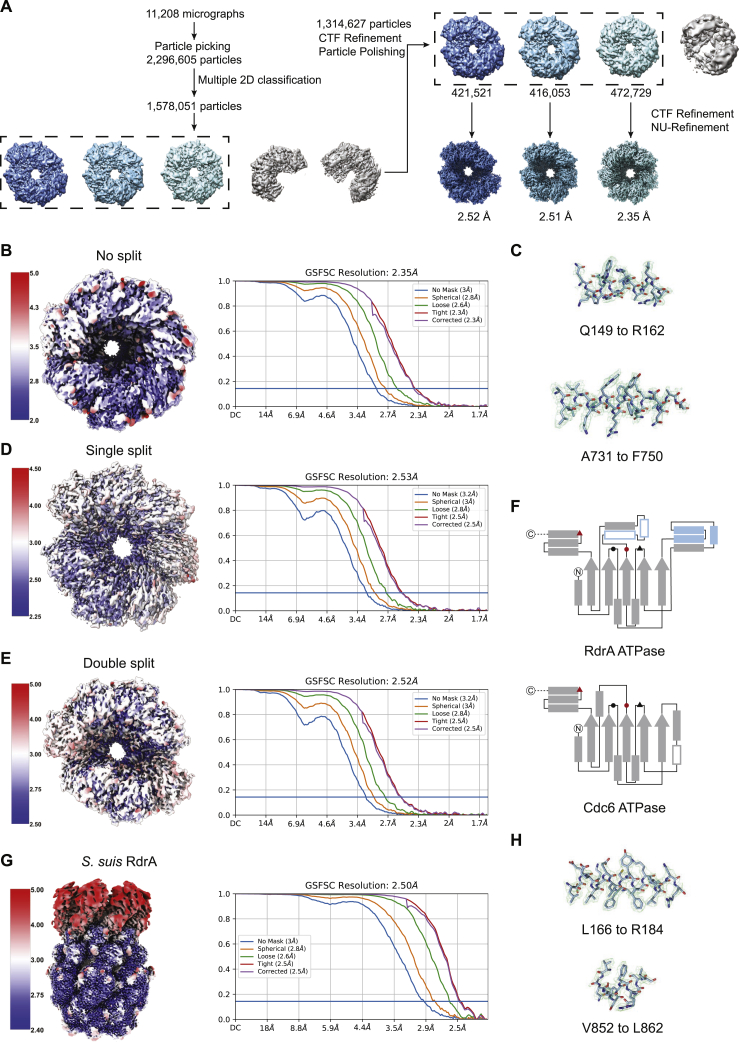
Figureu00a0S2
Structure of E.u00a0coli and S.u00a0suis RdrA ATPase, related to Figureu00a02 (A) Particle picking and classification strategy for E.u00a0coli RdrA. (B) Local resolution (left) and resolution by Fouri...
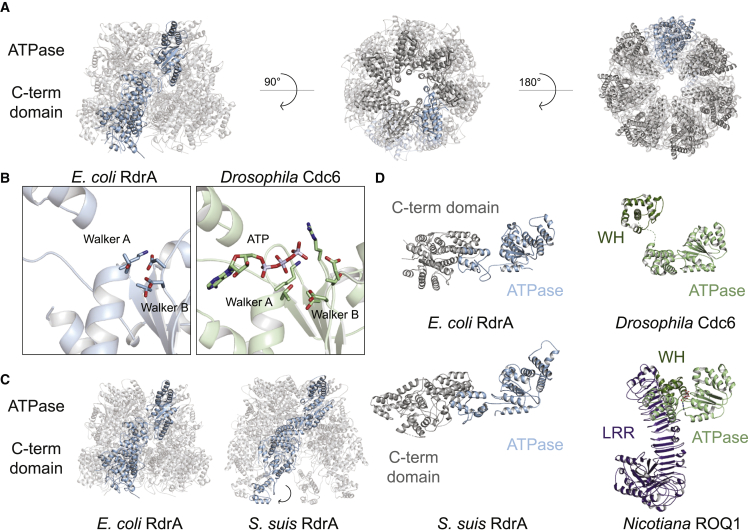
Figureu00a02
Structure of RdrA reveals a two-layered heptameric ATPase assembly with a unique C-terminal domain (A) Cartoon representation of E.u00a0coli RdrA cryo-EM structure. (B) Comparison of E.u00a0coli RdrA ...
Figureu00a0S3
Structure of E.u00a0coli RdrA adenosine deaminase, related to Figureu00a03 (A) Amino acid conservation of RdrA among 270 RADAR systems ( Tableu00a0S1 ). Dark red indicates highly conserved amino acids...
Figureu00a03
Structure of RdrB reveals an adenosine deaminase dodecamer (A) Cartoon representation of E.u00a0coli RdrB dodecamer, with each protomer in a different color. (B) Surface representation of E.u00a0coli ...
Figureu00a0S4
Structure of E.u00a0coli RdrA-RdrB supramolecular complex, related to Figureu00a04 (A) 2D class average from negative stain electron microscopy of RdrA-RdrB complex with a central protein surrounded b...
Figureu00a04
RdrA and RdrB form a supramolecular complex required for anti-phage defense (A) 2D class averages of cryo-EM RdrA-RdrB mixture showing many arrangements with different numbers of RdrA petals surroundi...
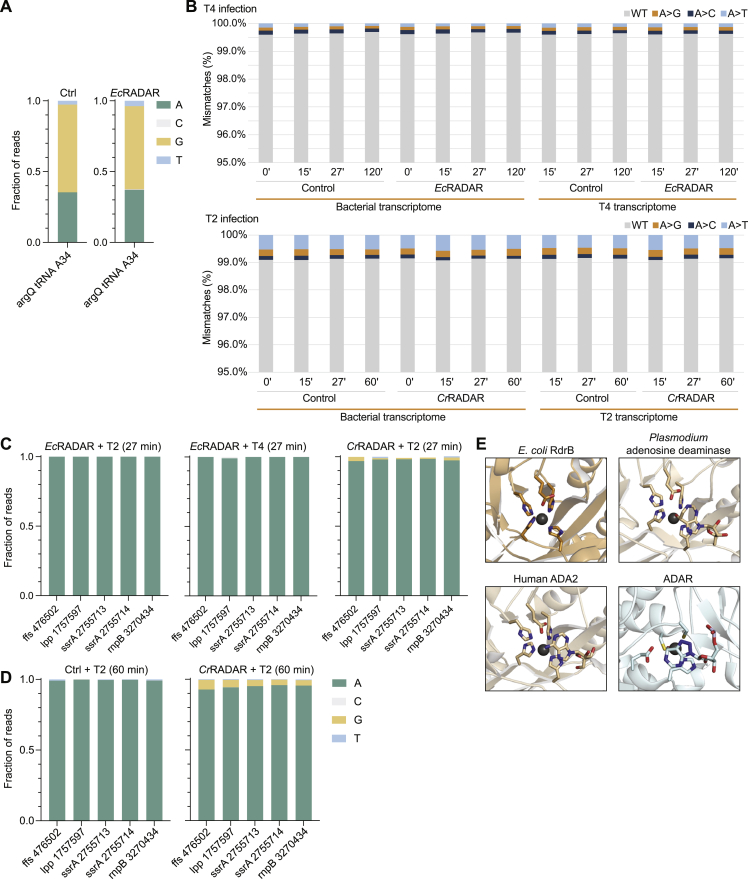
Figureu00a0S5
Analysis of deaminase activity of RdrB, related to Figureu00a05 (A) Detection of A-to-G mutational signature caused by A-to-I editing of the arginine tRNA argQ, confirming the ability of the RNA-seq p...
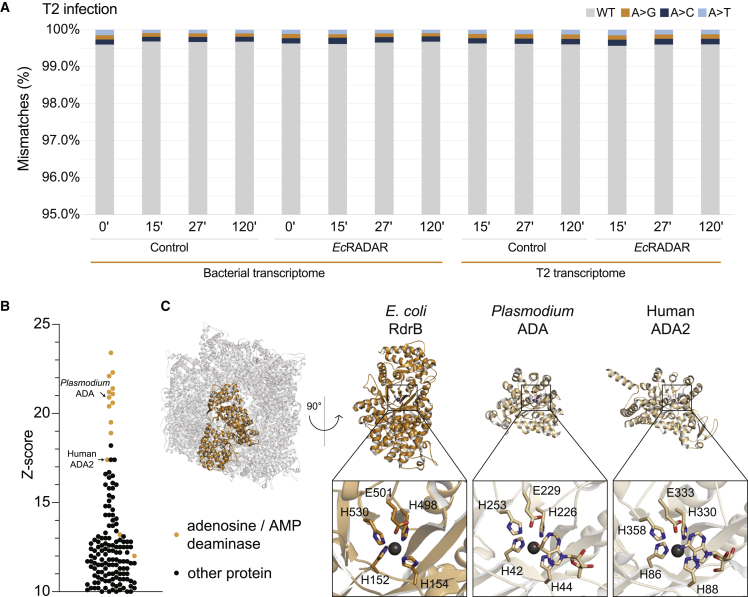
Figureu00a05
Structural analysis of RdrB suggests targeting of nucleotide substrates (A) Mismatches between sequenced RNA and genomic DNA in adenine positions. RNA, extracted from Ec RADAR-expressing or control ce...
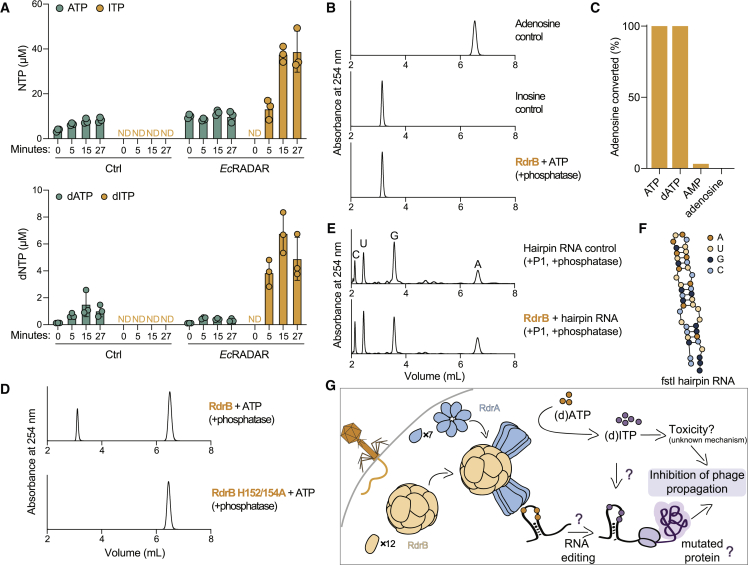
Figureu00a06
RADAR mediates ATP-to-ITP conversion in anti-phage defense (A) Quantitative mass spectrometry of ATP, dATP, ITP, and dITP in lysates extracted from cells containing Ec RADAR or control plasmid. Cells ...
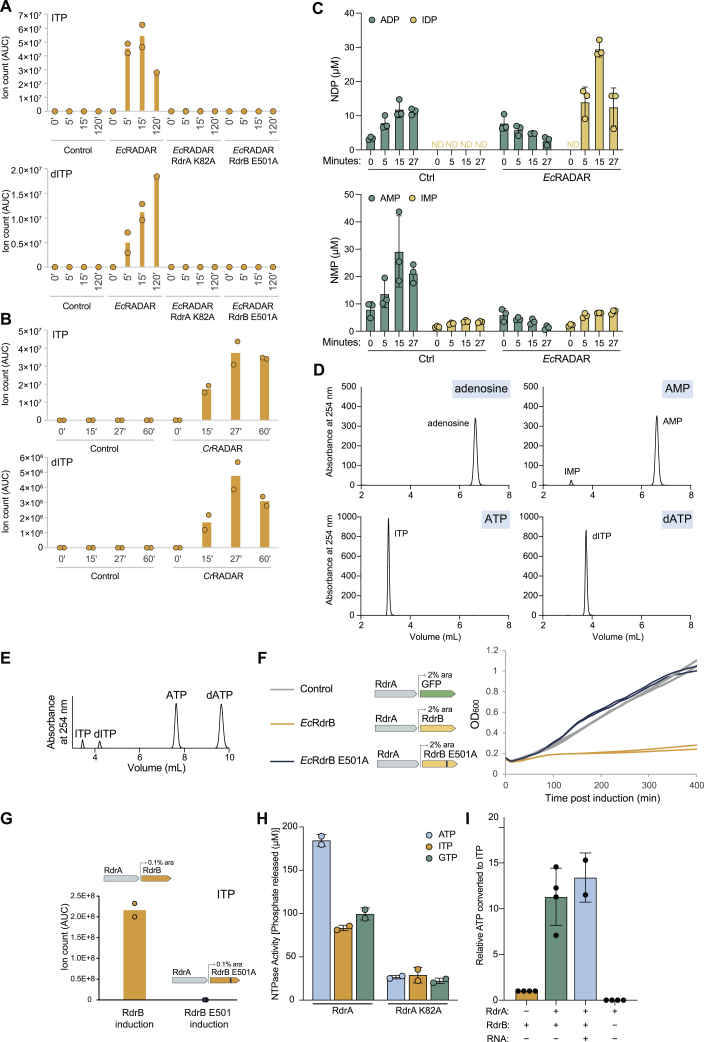
Figureu00a0S6
RdrB converts (d)ATP to (d)ITP inu00a0vivo and inu00a0vitro , related to Figureu00a06 (A) Ion count (area under curve) of ITP or dITP (respectively) in lysates extracted from WT Ec RADAR containing ce...
Figure images are served from the NIH/NLM PubMed Central Open Access Subset or Europe PMC; copyright remains with the publishers and authors.
💬 Discussion
0 commentsNo comments yet. Be the first to start a discussion!
Leave a Comment