Abstract
Abstract Mitochondrial complex I is a central metabolic enzyme that uses the reducing potential of NADH to reduce ubiquinone-10 (Q 10 ) and drive four protons across the inner mitochondrial membrane, powering oxidative phosphorylation. Although many complex I structures are now available, the mechanisms of Q 10 reduction and energy transduction remain controversial. Here, we reconstitute mammalian complex I into phospholipid nanodiscs with exogenous Q 10 . Using cryo-EM, we reveal a Q 10 molecule occupying the full length of the Q-binding site in the ‘active’ (ready-to-go) resting state together with a matching substrate-free structure, and apply molecular dynamics simulations to propose how the charge states of key residues influence the Q 10 binding pose. By comparing ligand-bound and ligand-free forms of the ‘deactive’ resting state (that require reactivating to catalyse), we begin to define how substrate binding restructures the deactive Q-binding site, providing insights into its physiological and mechanistic relevance.
🔬 Techniques
🧬 Organisms
💻 Software
🧪 Sample Preparation
🔬 Cell Lines
🏭 Microscope Brands
🧪 Reagent Suppliers
📷 Detectors
💻 Software Details
💾 Data Repositories
🏛️ Research Organizations (ROR)
Affiliated research institutions:
📋 Methods
Transformation and recombinant expression of membrane scaffold protein, MSP2N2 Bacterial strain Escherichia coli NiCo21(DE3) was kindly provided by Dr Ali Ryan, Northumbria University, UK. Chemically competent E. coli NiCo21(DE3) cells were prepared and transformed with pMSP2N2 (Addgene) using a standard New England BioLabs (NEB) heat shock protocol. For heterologous overexpression of MSP2N2, a starter culture of E. coli NiCo21(DE3) containing pMSP2N2 was grown overnight at 37 °C in LB broth with 50 µg mL −1 kanamycin. 4 ×2 L Fernbach flasks containing 500 mL of fresh LB media supplemented with antibiotic were inoculated with 1% v/v starter culture and grown at 37 °C, 250 rpm until the culture reached an OD 600 of 0.6. Protein expression was induced using 0.1 mM IPTG and the cells were cultured for a further 4 h at 37 °C with 250 rpm shaking. Cells were harvested by centrifugation at 6,000 × g for 20 min at 4 °C, resuspended in 40 mL lysis buffer (50 mM Tris-HCl pH 8, 500 mM NaCl, 5% glycerol, 1% v/v Triton X-100, 0.002% v/v PMSF, and 1 EDTA-free protease inhibitor tablet (Roche)) and stored at −80 °C.
Purification of MSP2N2
The method for purification of MSP2N2 was adapted from a published protocol 34 . Cell suspensions were thawed and lysed by sonication on ice using a Q700 sonicator (Qsonica) (50% output amplitude, 30 cycles of 10 s on, 20 s off). The cell lysate was clarified by centrifugation using a SS34 rotor at 30,000 × g for 1 h at 4 °C. The supernatant was collected, syringe filtered through a 0.22 µm membrane (Merck Millipore Ltd.) and applied to a 1 mL Ni-NTA column (His-Trap TM HP, Cytiva) equilibrated with 50 mM Tris-HCl (pH 8), 500 mM NaCl (=buffer A) + 1% v/v Triton X-100. The column was washed with 10 column volumes of buffer A + 1% v/v Triton X-100 followed by 10 column volumes of buffer A + 50 mM sodium cholate. Non-specifically bound proteins were washed with 10 column volumes of buffer A + 80 mM imidazole and finally MSP2N2 was eluted with buffer A + 400 mM imidazole. To obtain highly pure MSP2N2, the eluate from 1 mL Ni-NTA column was reapplied to a 5 mL Ni-NTA column (His-Trap TM HP, Cytiva) and the same procedure was repeated. Pure MSP2N2 fractions were pooled and dialysed against 2 L of 10 mM MOPS (pH 7.5 at 4 °C), 50 mM KCl at 4 °C. Sample homogeneity was confirmed by SDS-PAGE, and the protein flash frozen and stored at −80 °C. Preparation of bovine mitochondria, membranes, and complex I Bovine heart mitochondria were prepared as described previously 33 , and mitochondrial membranes prepared using a method modified from that used previously for Mus musculus 10 . Briefly, mitochondria were thawed and diluted to 5 mg mL −1 with 20 mM Tris-HCl (pH 7.55 at 20 °C), 1 mM EDTA, 10% glycerol, then ruptured by three 5 s bursts of sonication with 30 s intervals on ice using a Q700 micro-tip Sonicator (Qsonica) at 65% output amplitude setting. The membranes were pelleted at 75,000 × g using an MLA80 rotor (Beckman Coulter) for 1 h, then resuspended in the same buffer. Bovine complex I was prepared as described previously 33 with a minor modification to match the mouse complex I preparation 10 (solubilised membranes were centrifuged at 48,000 × g for 30 min instead of 8500 × g for 12 min) and kept on ice until reconstitution into nanodiscs. Complex I reconstitution into nanodiscs Complex I was reconstituted into nanodiscs using a protocol based on the reconstitution of complex I into proteoliposomes 21 , 35 . Two batches of 0.5 mg of chloroform-dissolved synthetic lipids (1,2-dioleoyl-sn-glycero-3-phosphocholine (DOPC), 1,2-dioleoyl- sn -glycero-3-phosphoethanol-amine (DOPE), 18:1 cardiolipin, Avanti Polar Lipids; stock: at a mass ratio of 8:1:1 (DOPC:DOPE:cardiolipin) and total concentration of 25 mg mL −1 ) were each mixed with 20 nmol of chloroform-dissolved ubiquinone-10 (Q 10 ; i.e. 40 nmol Q 10 per mg lipid) in a test tube. The solvent was evaporated off under a stream of N 2 , and any residual chloroform removed in a desiccator under vacuum for at least 2 h. The dried lipid-Q 10 mixtures were each resuspended in 457.5 µL 10 mM MOPS (pH 7.5 at 4 °C), 50 mM KCl by vigorous vortexing, and sonicated in an ultrasonic bath (Grant Instruments (Cambridge) Ltd.) for 10 min together with 42.5 µL of 20% w/v sodium cholate (i.e. final concentration of 40 mM). Each sample was transferred into a 1.5 mL Eppendorf tube, centrifuged at 7,000 × g for 10 min in a bench-top centrifuge, then each supernatant was transferred to a new tube and incubated on ice for 10 mins. MSP2N2 and bovine complex I (prepared as described above) were pooled gently with the lipid-Q 10 mixture at a molar ratio of 400:10:1 (lipid:MSP2N2:complex I). Each sample was then diluted 2-fold with 0.5 mL 10 mM MOPS (pH 7.5 at 4 °C), 50 mM KCl to a total volume of 1 mL, and incubated on ice for 20 min. Then each sample was run over a separate PD10 desalting column (Cytiva) at 4 °C to remove the peripheral detergents. The eluates were pooled together, concentrated using a 100 kDa MWCO Amicon® Ultra concentrator (Merck Milipore Ltd.) to ~100 µL, and filtered using a 0.22 µm Corning® Costar® Spin-X® plastic centrifuge tube filter (Merck Milipore Ltd.). The concentrated sample was applied to a Superose 6 increase 5/150 column (Cytiva) equilibrated with 10 mM MOPS (pH 7.5 at 4 °C), 50 mM KCl, and the most concentrated fractions from the monodisperse CxI-ND peak were used for grid preparation.
Show full methods section
Transformation and recombinant expression of membrane scaffold protein, MSP2N2 Bacterial strain Escherichia coli NiCo21(DE3) was kindly provided by Dr Ali Ryan, Northumbria University, UK. Chemically competent E. coli NiCo21(DE3) cells were prepared and transformed with pMSP2N2 (Addgene) using a standard New England BioLabs (NEB) heat shock protocol. For heterologous overexpression of MSP2N2, a starter culture of E. coli NiCo21(DE3) containing pMSP2N2 was grown overnight at 37 °C in LB broth with 50 µg mL −1 kanamycin. 4 ×2 L Fernbach flasks containing 500 mL of fresh LB media supplemented with antibiotic were inoculated with 1% v/v starter culture and grown at 37 °C, 250 rpm until the culture reached an OD 600 of 0.6. Protein expression was induced using 0.1 mM IPTG and the cells were cultured for a further 4 h at 37 °C with 250 rpm shaking. Cells were harvested by centrifugation at 6,000 × g for 20 min at 4 °C, resuspended in 40 mL lysis buffer (50 mM Tris-HCl pH 8, 500 mM NaCl, 5% glycerol, 1% v/v Triton X-100, 0.002% v/v PMSF, and 1 EDTA-free protease inhibitor tablet (Roche)) and stored at −80 °C.
Purification of MSP2N2
The method for purification of MSP2N2 was adapted from a published protocol 34 . Cell suspensions were thawed and lysed by sonication on ice using a Q700 sonicator (Qsonica) (50% output amplitude, 30 cycles of 10 s on, 20 s off). The cell lysate was clarified by centrifugation using a SS34 rotor at 30,000 × g for 1 h at 4 °C. The supernatant was collected, syringe filtered through a 0.22 µm membrane (Merck Millipore Ltd.) and applied to a 1 mL Ni-NTA column (His-Trap TM HP, Cytiva) equilibrated with 50 mM Tris-HCl (pH 8), 500 mM NaCl (=buffer A) + 1% v/v Triton X-100. The column was washed with 10 column volumes of buffer A + 1% v/v Triton X-100 followed by 10 column volumes of buffer A + 50 mM sodium cholate. Non-specifically bound proteins were washed with 10 column volumes of buffer A + 80 mM imidazole and finally MSP2N2 was eluted with buffer A + 400 mM imidazole. To obtain highly pure MSP2N2, the eluate from 1 mL Ni-NTA column was reapplied to a 5 mL Ni-NTA column (His-Trap TM HP, Cytiva) and the same procedure was repeated. Pure MSP2N2 fractions were pooled and dialysed against 2 L of 10 mM MOPS (pH 7.5 at 4 °C), 50 mM KCl at 4 °C. Sample homogeneity was confirmed by SDS-PAGE, and the protein flash frozen and stored at −80 °C. Preparation of bovine mitochondria, membranes, and complex I Bovine heart mitochondria were prepared as described previously 33 , and mitochondrial membranes prepared using a method modified from that used previously for Mus musculus 10 . Briefly, mitochondria were thawed and diluted to 5 mg mL −1 with 20 mM Tris-HCl (pH 7.55 at 20 °C), 1 mM EDTA, 10% glycerol, then ruptured by three 5 s bursts of sonication with 30 s intervals on ice using a Q700 micro-tip Sonicator (Qsonica) at 65% output amplitude setting. The membranes were pelleted at 75,000 × g using an MLA80 rotor (Beckman Coulter) for 1 h, then resuspended in the same buffer. Bovine complex I was prepared as described previously 33 with a minor modification to match the mouse complex I preparation 10 (solubilised membranes were centrifuged at 48,000 × g for 30 min instead of 8500 × g for 12 min) and kept on ice until reconstitution into nanodiscs. Complex I reconstitution into nanodiscs Complex I was reconstituted into nanodiscs using a protocol based on the reconstitution of complex I into proteoliposomes 21 , 35 . Two batches of 0.5 mg of chloroform-dissolved synthetic lipids (1,2-dioleoyl-sn-glycero-3-phosphocholine (DOPC), 1,2-dioleoyl- sn -glycero-3-phosphoethanol-amine (DOPE), 18:1 cardiolipin, Avanti Polar Lipids; stock: at a mass ratio of 8:1:1 (DOPC:DOPE:cardiolipin) and total concentration of 25 mg mL −1 ) were each mixed with 20 nmol of chloroform-dissolved ubiquinone-10 (Q 10 ; i.e. 40 nmol Q 10 per mg lipid) in a test tube. The solvent was evaporated off under a stream of N 2 , and any residual chloroform removed in a desiccator under vacuum for at least 2 h. The dried lipid-Q 10 mixtures were each resuspended in 457.5 µL 10 mM MOPS (pH 7.5 at 4 °C), 50 mM KCl by vigorous vortexing, and sonicated in an ultrasonic bath (Grant Instruments (Cambridge) Ltd.) for 10 min together with 42.5 µL of 20% w/v sodium cholate (i.e. final concentration of 40 mM). Each sample was transferred into a 1.5 mL Eppendorf tube, centrifuged at 7,000 × g for 10 min in a bench-top centrifuge, then each supernatant was transferred to a new tube and incubated on ice for 10 mins. MSP2N2 and bovine complex I (prepared as described above) were pooled gently with the lipid-Q 10 mixture at a molar ratio of 400:10:1 (lipid:MSP2N2:complex I). Each sample was then diluted 2-fold with 0.5 mL 10 mM MOPS (pH 7.5 at 4 °C), 50 mM KCl to a total volume of 1 mL, and incubated on ice for 20 min. Then each sample was run over a separate PD10 desalting column (Cytiva) at 4 °C to remove the peripheral detergents. The eluates were pooled together, concentrated using a 100 kDa MWCO Amicon® Ultra concentrator (Merck Milipore Ltd.) to ~100 µL, and filtered using a 0.22 µm Corning® Costar® Spin-X® plastic centrifuge tube filter (Merck Milipore Ltd.). The concentrated sample was applied to a Superose 6 increase 5/150 column (Cytiva) equilibrated with 10 mM MOPS (pH 7.5 at 4 °C), 50 mM KCl, and the most concentrated fractions from the monodisperse CxI-ND peak were used for grid preparation.
Characterisation of complex I-reconstituted nanodiscs
The complex I concentration in the nanodisc preparation was quantified relative to a detergent solubilised sample of known concentration using the NADH:APAD + activity assay with 500 µM APAD + , 1 µM piericidin and 100 µM NADH, as described previously 21 , 33 , 35 , except that 0.15% soy bean asolectin (Avanti Polar Lipids) and 0.15% CHAPS (Merck Chemicals Ltd.) were present. CxI-ND concentrations (i.e. combined protein concentrations of complex I and MSP2N2) were determined using the Pierce™ bicinchoninic acid (BCA) protein assay kit (Thermo Fisher Scientific). For the sample subjected to cryo-EM analyses, the complex I and CxI-ND concentrations were 3.7 and 4.8 mg mL −1 , respectively, and the same ratio was observed consistently in several independent preparations. Phospholipid contents were determined as described previously 21 , 33 , 35 . The average phospholipid molecular weight was taken to be 771.6 g mol −1 , and the volume of the phospholipid phase was estimated by assuming that 1 mg of phospholipid occupies ~1 µL. Q 10 contents were quantified by HPLC, by reference to a set of standard samples, using a Nucleosil 100-5C18 column and a Dionex Ultimate 3000 RS electrochemical detector as described previously 21 , 33 , 35 . Q 10 concentrations were defined relative to the phospholipid phase volume. All catalytic activity assays were conducted at 32 °C in 96-well plates using a Molecular Devices Spectramax 384 plus plate reader and Softmax Pro. Catalysis was initiated by addition of 200 µM NADH and monitored at 340 and 380 nm (ε 340-380 = 4.81 mM −1 cm −1 ). Linear rates were used for activity calculations, and inhibitor-insensitive rates (determined by the addition of 1 µM piericidin A) subtracted from each measured rate where noted. Isolated complex I used for reconstitution and CxI-ND samples used for cryo-EM analyses were diluted to 0.5 µg mL −1 in 20 mM Tris-HCl (pH 7.5 at 32 °C), and activity assays performed with 200 µM decylubiquinone (dQ), 0.15% asolectin/CHAPS, and/or 10 µg mL −1 alternative oxidase (AOX), prepared as described previously 33 .
Cryo-EM grid preparation and image acquisition
UltrAuFoil gold grids (0.6/1, Quantifoil Micro Tools GmbH) were prepared as described previously 9 . Briefly, grids were glow discharged (20 mA, 90 s), incubated in a solution of 5 mM 11-mercaptoundecyl hexaethyleneglycol (TH 001—m11.n6-0.01, ProChimia Surfaces) in ethanol for two days in an anaerobic glovebox (Belle), then washed with ethanol and dried just before use. Using a Vitrobot Mark IV (FEI), 2.5 µL of 4.8 mg mL −1 CxI-ND solution (from the same preparation) were applied to the grids before blotting for 10 s at force setting −10, at 100% relative humidity and 4 °C, and then plunge-frozen into liquid ethane. Twelve grids were screened for particle number and distribution and two grids were selected for two 2-day data collections. They were imaged using a Gatan K3 detector and a post-column imaging energy filter (Gatan BioContinuum) operating in zero-energy mode with a slit width of 20 eV mounted on an FEI 300 keV Titan Krios microscope (Thermo Fisher Scientific) with a 100 µm and 70 µm objective and C2 apertures, respectively, and EPU v. 2.7.0.5806REL at the Department of Biochemistry, University of Cambridge. Data were collected in super-resolution electron counting mode at a pixel size of 0.535 Å pixel −1 (81,000× nominal magnification) with a defocus range −1.0 to −2.4 in 0.2 µm intervals, and the autofocus routine run every 10 µm. Aberration-free image shift (AFIS) was used for data acquisition on day 1 of the 2-day data collection for the first grid but was abandoned due to frequent occurrences of erratic image beam shifts observed in collected movies. The dose rates for the two datasets were 16.9 electrons Å −2 s −1 , with 2.4 s exposures captured in 40 frames. The total dose was thus 40.5 electrons Å −2 in both cases. Data were retrieved as non-gain-corrected LZW-compressed tiff movie stacks.
Cryo-EM data processing
The two datasets were processed separately until stated otherwise, using RELION 3.1.0 36 (Supplementary Figs. 2 and 3 ). The micrographs were motion-corrected using RELION’s implementation of motion correction with 5 ×5 patches, and contrast transfer function (CTF) estimated using CTFFIND-4.1 50 with an amplitude contrast of 0.1 and ResMax set to 5 Å. Micrographs were filtered to remove those with a negative rlnCtfFigureOfMerit value, an rlnMaxResolution value worse than 6 Å, or an rlnCtfAstigmatism value lower than 20 or greater than 1000. Ice-contaminated micrographs were further removed manually to give 2,639 and 1,797 micrographs for datasets 1 and 2, respectively, from which 804,367 and 382,037 particles were selected using RELION’s AutoPicking tool with a 3D map input (EMD-14127) 40 low-pass filtered to 20 Å. Particles were extracted with an initial 4.5× downscaling to 2.4075 Å pixel −1 , and filtered to select those with an rlnAutopickFigureOfMerit value between 0 and 4. Following one round of 2D (with alignment) and 3D (without alignment) classification to remove junk particles, the remaining particles were re-extracted at the nominal pixel size (1.07 Å pixel −1 ; 2× bin) for another round of 3D classification with local angular search to remove aberrant classes of particles. 251,045 (dataset 1) and 140,731 (dataset 2) particles were brought forward for iterative rounds of CTF refinement 36 , to estimate anisotropic magnification, beam tilt, trefoil, 4 th order aberration, and per-particle defocus, astigmatism and B-factor parameters. Particles with an rlnNrOfSignificantSamples value greater than 2999 were removed, and the two datasets combined to give 367,615 particles. These particles were then re-extracted with re-centring, subjected to Bayesian polishing, CTF refined and 3D classified (local angular search) to remove any remaining junk. At this early stage, 358,326 particles were 3D refined with a complex I mask (generated from a working model using RELION MaskCreate) and with solvent flattening to give a global resolution of 2.28 Å (according to a gold-standard Fourier shell correlation (FSC) of 0.143). Signal subtraction was then performed to remove most of the non-complex I contribution (MSP2N2 nanodisc belt and the lipid bilayer within the nanodisc) using the complex I mask. 3D classification (number of classes, K = 6, local angular search to 0.2° sampling) was then performed, which separated the particles into active, deactive and state 3 complex I classes. Two classes arising from atypically shaped nanodisc complexes (class 1) and junk (class 2) were excluded from subsequent rounds of processing. Active (class 4), deactive (classes 5 and 6) and state 3 (class 3) classes retained 61,654, 259,547, and 22,019 particles, respectively, which were then signal reverted to include the nanodisc densities, and repolished at 0.7523 Å pixel −1 (1.4× bin). The three classes refined to 2.65, 2.28, and 3.02 Å resolution, respectively, at the calibrated pixel size of 0.7496 Å pixel −1 (Supplementary Fig. 2 ) determined by comparison with existing mammalian complex I structures 12 . All data processing were done at the nominal pixel size of 0.7523 Å pixel −1 , and corrected to a calibrated pixel size of 0.7496 Å pixel −1 at the post-processing or local resolution stages in RELION (see below). Focused 3D classification without alignment (regularisation parameter, T = 100) was performed on the active, deactive, and state 3 classes (Table 1 and Supplementary Fig. 3 ). All individual classes were first subject to signal subtraction to retain roughly only the peripheral arm of complex I, and then focus-classified using a mask generated from a tentatively modelled Q 10 (active), a mask generated from a provisional partial protein model (ND1, NDUFS2, and NDUFS7) encapsulating the Q-binding site (deactive), or a mask generated from a tentatively modelled DDM (state 3) (Supplementary Fig. 3 ); 7 junk particles were discarded in this step for the deactive class. Masks for focused classification were generated using RELION MaskCreate with up to 10 pixels of extensions and soft cosine edges; no low-pass filtering was performed. The identified sub-states outlined in the main text were then signal reverted to give the global map, and the global resolution estimated from the FSC between two independent, unfiltered half-maps (FSC = 0.143) (Table 1 and Supplementary Figs. 3 and 4 ). As no obvious differences were identified between the state 3 sub-states, which were evenly balanced, they were kept as a single class. The model-generated mask used for 3D refinement with solvent flattening and resolution estimation was generated in UCSF ChimeraX 51 using the molmap function, before being low-pass filtered to 15 Å and having a 6-pixel soft cosine edge added using RELION MaskCreate. Mollweide projections were plotted using Python and Matplotlib, and the degree of directional resolution anisotropy calculated using the 3DFSC program suite 52 (Supplementary Fig. 4 ). All consensus maps were locally sharpened from the unsharpened, unfiltered half-maps generated from RELION post-process (user-provided B-factor and ad-hoc low-pass filter set to 0 and Nyquist, respectively; the output pixel size was altered to match the calibrated pixel size) using phenix.autosharpen in Phenix 1.18.2-3874 53 , setting the resolution limit to the highest local resolution determined from RELION LocalRes (Supplementary Fig. 4 ), and with a local sharpening box size of 15 3 pixels and a targeted overlap of 5 pixels. The deactive-ligand map was split into three sections (distal and proximal membrane domains, and hydrophilic domain) for manual multibody refinement (i.e. signal subtraction, followed by focused refinements) following nanodisc subtraction (Supplementary Fig. 3 ). The focus-refined maps were then globally sharpened in RELION post-process, and using the globally sharpened consensus deactive-ligand map as a reference, combined to make a composite map using phenix.combine_focused_maps in Phenix 1.19-4092 53 (Supplementary Fig. 3 ). The composite map was carefully compared to the consensus map to ensure that there were no map distortions or anomalies. The locally sharpened global maps (active-Q 10 , active-apo, deactive-apo, and state 3) and globally sharpened composite map (deactive-ligand) were used for model building and refinement (Table 1 ). Nanodisc maps were generated by complex I subtraction and focused refinement (i.e. subtract-refinement) using a nanodisc mask, either with alignment (all particles combined) or without alignment (individual sub-states). To make the nanodisc mask, a tight complex I mask was first generated from a working model using RELION MaskCreate, and subtracted from the consensus map to obtain densities for the nanodisc; leftover complex I densities were removed using the Map Eraser tool in UCSF ChimeraX 51 , and the complex I-subtracted map then used as the RELION MaskCreate input. Maps were visualised in UCSF ChimeraX 51 for the generation of figures, and raw threshold levels of the relevant maps adjusted using the Volume Viewer tool. Model building, refinement and validation Working models derived from a model for bovine complex I in the active state (PDB ID: 7QSD) 40 were rigid-body fitted into maps using the Fit in Map tool in UCSF ChimeraX 51 , rigid-body real space refinement in Phenix 1.18.2-3874 53 , and Curlew all-atom-refined using Coot 0.9.4-pre 54 . The models were checked, and new resolvable regions built manually in Coot 0.9.4.2-pre. Local bovine populations are known to have a polymorphism at residue position 255 of subunit NDUFA10 – cDNA sequencing has shown evidence for both asparagine and lysine, while electrospray ionisation mass spectrometry supports the latter 55 . On the basis of these reports and the Coulomb potential densities in the CxI-ND maps, we modelled it as Lys255 NDUFA10 . Similarly, residue position 129 (glutamine) of subunit NDUFS2 was modelled as Arg129 NDUFS2 . Densities for existing and additional phospholipid molecules were identified with the Unmodelled blobs tool in Coot. All non-cardiolipin phospholipids were modelled as phosphatidylethanolamines unless density features indicated phosphatidylcholine to be more likely. All DDM molecules in the starting model were removed or replaced with phospholipid molecules where the CxI-ND map features indicated, and lipid tails were clipped where necessary using the delete tools in Coot and PyMOL 2.5.2. The manually inspected models were then real-space refined against the respective locally sharpened consensus (active-Q 10 , active-apo, deactive-apo, and state 3) or composite (deactive-ligand) maps in Phenix 1.18.2-3874 53 with Ramachandran restraints set to Oldfield (favoured) and Emsley8k (allowed and outlier) to remove genuine forced twists. This real-space refinement step was performed iteratively with manual adjustments in Coot. Water molecules were placed into distinct density peaks as identified with the Find Waters function in Coot, with the minimum and maximum distance to protein atoms set to 2.4 and 3.4 Å, respectively. The identified waters were manually edited to remove falsely placed waters (based on H-bonding geometries, strength and shape of densities, and steric clashes) and bulk solvent waters, and to add waters missed due to uncertain positions of surrounding sidechains or waters. Atom resolvabilities (Q-scores) in the respective cryo-EM maps were calculated using MapQ 56 , and any outliers identified and corrected. The models were then real-space refined in Phenix as outlined above. The model statistics for the five sub-states in active, deactive and state 3 classes (Table 1 ) were produced by Phenix, MolProbity, and EMRinger. Model-to-map FSC curves were generated using phenix.validation_cryoem. Model-map CC mask values for various substrate/ligand poses were calculated by first extracting the ligand coordinates from the protein models and then running phenix.validation_cryoem against their respective final maps. A provisional poly-alanine model for the two MSP2N2 nanodisc belts was built and refined into a 7.4 Å subtract-refined nanodisc map made from all three major species of complex I-reconstituted nanodiscs using interactive molecular dynamic simulations in ISOLDE 1.2.2 57 with α-helical secondary structure restraints.
Comparisons of cryo-EM maps and models
Map-to-map real-space correlations were performed using the Fit in Map function in UCSF ChimeraX 51 (Supplementary Table 1 ) following low-pass filtering of the relevant maps to the resolution of the lowest resolution map in the set in RELION 36 . RMSD calculations were performed using the Align command in PyMOL.
Identification of hydrogen bonds H-bonding contacts within individual
CxI-ND models (with hydrogens added using phenix.ready_set and/or phenix.reduce 53 ) were identified using the hbonds command in UCSF ChimeraX 51 , for which the geometric criteria are based on a survey of small-molecule crystal structures 58 , and atom types adapted and extended from the program IDATM 59 . Quinone cavity determination The interior surface of the Q-binding channel was predicted using CASTp 45 , which computes a protein surface topology from a PDB model. The default 1.4 Å radius probe was used and the results were visualised in PyMOL using the CASTpyMOL 3.1 plugin and by UCSF ChimeraX 51 .
Molecular dynamics simulations
The cryo-EM structure of active-state complex I from M. musculus at 3.1 Å resolution (PDB ID: 6ZR2) 12 was used to build the initial simulation model. Protonation states of sidechains were adjusted to neutral pH, except that His59 NDUFS2 and Asp160 NDUFS2 were modelled initially as di-protonated (HisH + ) and neutral (AspH), Glu68 ND3 , Glu36 NDUFS5 , Glu262 ND1 and Glu114 ND4 as neutral (GluH), and His549 NDUFS1 and His42 NDUFB2 as di-protonated. The N-termini of NDUFS7 (Ser34) and the truncated NDUFB6 (Ser66) were modelled as neutral. These alternative protonation states were suggested by the chemical environment of the group and PropKa calculations 60 (with nearby FeS cluster N2 in the oxidised state). All cofactors and post-translational modifications present in PDB 6ZR2 were included. High confidence phospholipids were retained and built with linoleoyl (18:2) acyl chains. The polar headgroups were preserved, thereby they were modelled as 1,2-dilinoleoyl-sn-glycero-3-phosphatidylcholine (DLPC), 1,2-dilinoleoyl-sn-glycero-3-phosphatidylethanolamine (DLPE) and 1’-3’-bis[1,2-dilinoleoyl-sn-glycero-3-phospho]-sn-glycerol, as the cardiolipin dianion (CDL). Missing hydrogen atoms were built with the GROMACS suite 61 . Neutral His tautomers were chosen based on optimal H-bonding. The modelled protein complex was embedded in a solvated bilayer with a composition mimicking that of the inner mitochondrial membrane 62 . The final solvated and inserted system contains 368 DLPC (179 in the matrix leaflet), 294 DLPE (143 in the matrix leaflet), 96 CDL (half in each leaflet) and 22 oxidised Q 10 molecules, all initially in the membrane phase. The asymmetry in DLPC and DLPE composition between the two leaflets is due to chain NDUFA9 occupying an area of the matrix leaflet only. The water phase contains 205,387 molecules plus 553 Na + and 348 Cl − ions to neutralise the total system charge and maintain ~0.1 M salt concentration. The resulting simulation model contains a total of 861,975 atoms. Water solvation of the apo Q-binding channel and regions near the oxidised N2 FeS centre was compared to the active-Q 10 and previous cryo-EM models (PDB ID: 6YJ4) 23 and adjusted accordingly. The simulation model was relaxed and equilibrated during molecular dynamics (MD) simulations of 740 ns in total. Initially all protein heavy atoms were tethered to their initial position by harmonic restraints, then the force constants were decreased progressively from 1000 to 10 kJ mol −1 nm −1 , and all atoms were free to move in the last 210 ns. Membrane packing (area per lipid) and hydration of several groups in the Q-binding channel were monitored and checked for stability after 400 ns. Then, the final configuration of this simulation had one Q 10 molecule inserted into the binding channel. The Q 10 coordinates, as well as those of the sidechains of His59 NDUFS2 , Tyr108 NDUFS2 , Thr156 NDUFS2 , Met70 NDUFS7 and Ser205 ND1 , were adjusted to the superimposed active-Q 10 cryo-EM model (Fig. 2a ). Clashing water molecules in the channel were removed and the protonation states of His59 NDUFS2 and Asp160 NDUFS2 were changed to the three charge-states studied ([Asp − + His]; [AspH + His]; [AspH + HisH + ]). If necessary, charge neutrality was maintained by removing a counter-ion. Each charge-state was further relaxed and equilibrated during 235 ns of MD simulation, with initial harmonic restraints in heavy protein atoms, the distances between atoms His59 NDUFS2 -N δ1 –Q 10 O 3 and His59 NDUFS2 -N ε2 –Asp160 NDUFS2 -C γ , and the collective variable (CV) described below. Restraint forces were progressively reduced to zero and removed fully in the last 50 ns. Hydration of the Q-binding channel was again monitored and checked for stability. This procedure was designed and implemented to generate equilibrated and unbiased simulation models in the three charge-states studied. A canonical MD trajectory of 300 ns without any restraints was obtained for each charge-state. The root-mean squared deviation (RMSD) for the positions of the C α atoms of chains NDUFS7, NDUFS2 and ND1 remained stable during these trajectories at ~1.4 Å in relation to both the initial model (PDB 6ZR2) and the current active-Q 10 cryo-EM model. A pathway collective variable (CV), as used previously for Q-binding simulations 31 , was applied to describe the position of the Q-headgroup along the channel. This CV (see Fig. 3b–d ) is a combination of distances between the heavy atoms in the Q-headgroup and the C α atoms of residues in subunits NDUFS7, NDUFS2 and ND1 exposed to the Q-binding channel. Distances are evaluated with respect to four milestone configurations that represent progressive binding of Q 10 . These configurations are provided here as Supplementary Data 1 to allow reproduction of our calculations. Finally, well-tempered metadynamics 63 simulations were performed for each charge-state, starting from a configuration taken at 75 ns of each canonical MD trajectory described above. Metadynamics were activated in the CV coordinate (position on the path, p1.sss, and distance from the path, p1.zzz) and in the His59 NDUFS2 χ 2 dihedral (C β -C γ bond torsion) with Gaussians deposited every 500 time steps (1 ps), at initial height of 0.6 kJ mol −1 , widths of 0.4 and 0.02 units for the CV and dihedral, respectively, and a bias factor of 15.0. Walls were included to restrict sampling for the CV at 21 < p1.sss < 26 Å and −2.45 < p1.zzz < −2.20 Å, with force constant of 1000 kJ mol −1 nm −1 . Productive metadynamics simulations lasted 140 ns for each charge-state. Due to the enhanced sampling nature of this method, simulation times significantly shorter than for canonical MD are sufficient for an appropriate conformational sampling of confined regions, such as the reactive position of the complex I Q-binding site. Convergence within ±1 kJ mol −1 of free energy differences in the CV profile (Fig. 3a ) was reached after 70 ns. The effects of metadynamics and of restraints were removed by re-weighting the distribution of structural properties (distances, dihedral, CV) and the resulting free energies are shown in Fig. 3a , e–g and Supplementary Fig. 8 . The statistical uncertainty was estimated as 95% confidence intervals by bootstrap analysis. In all MD simulations the interactions of protein, lipids and ions were described with the all-atom CHARMM36m force-field 64 . Water was represented by the standard TIP3P model 65 . FeS centres were described using the Chang and Kim 66 parameters with corrections by McCullagh and Voth 67 . Q 10 interactions were represented by our calibrated force-field 62 , 68 . The remaining cofactors were described by available CHARMM and CGenFF parameters (charmm36-mar2019.ff) 64 . All simulations were conducted with GROMACS (version 2020.3) 61 at constant temperature of 310 K, pressure of 1 atm and a time step of 2 fs. Long-range electrostatics were treated with the Particle Mesh Ewald method 69 . Metadynamics simulations were performed with the PLUMED plugin (version 2.6.1) 70 . Reporting summary Further information on research design is available in the Nature Research Reporting Summary linked to this article.
Supplementary information Supplementary Information Peer Review File Description of Additional Supplementary Files Supplementary Data 1 Reporting Summary
📊 Figures
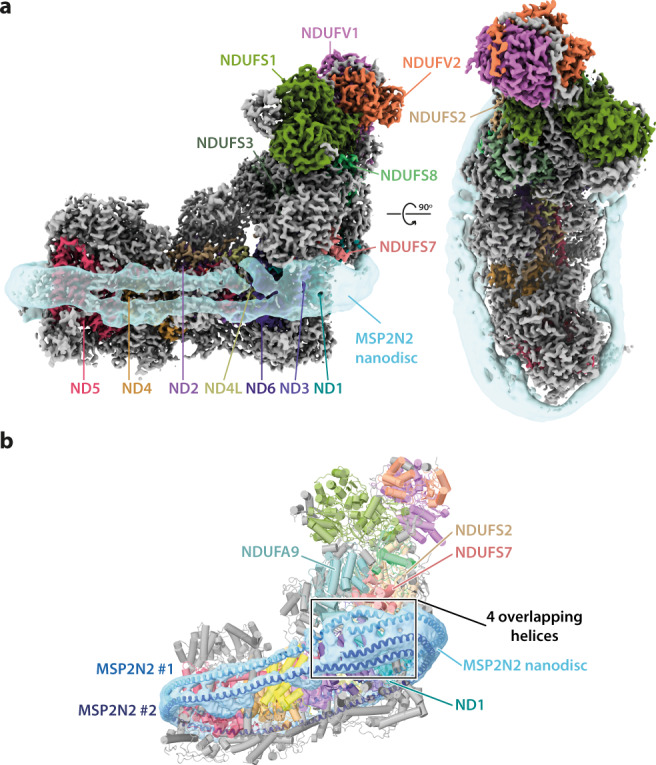
Fig. 1
Overview of the structure of mitochondrial complex I from Bos taurus reconstituted into nanodiscs.
a Side and top views of the cryo-EM densities for the 14 core (coloured) and 31 supernumerary (grey) subunits of Q 10 -bound active complex I at a map threshold of 6.5 are shown with the subtract-refi...
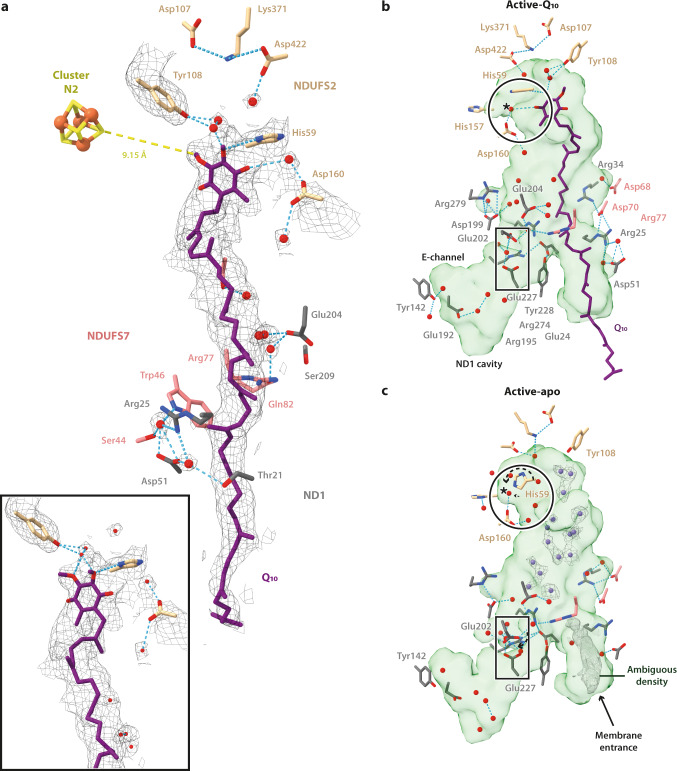
Fig. 2
Active states of complex I with and without bound Q 10 .
a Cryo-EM densities of Q 10 and neighbouring water molecules in the active-Q 10 map at a map threshold of 4.4 are shown together with the polar residues that make H-bonding interactions, as identified...
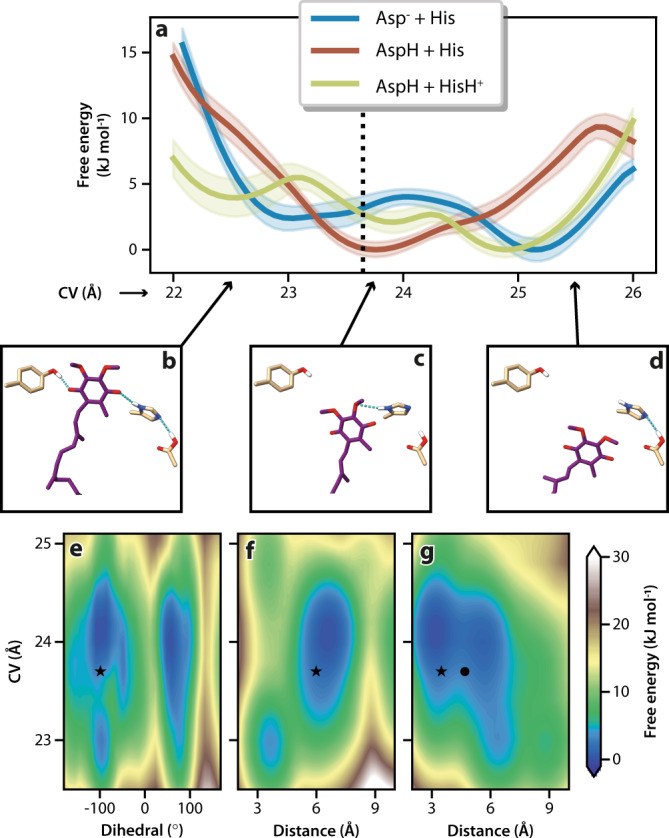
Fig. 3
Free energy profiles from molecular dynamics simulations.
a Profiles were obtained for three combinations of sidechain protonation with Asp160 NDUFS2 ionised (Asp u2212 ) or protonated (AspH) and His59 NDUFS2 neutral (His, N u03b41 -protonated u03c0 tautomer...
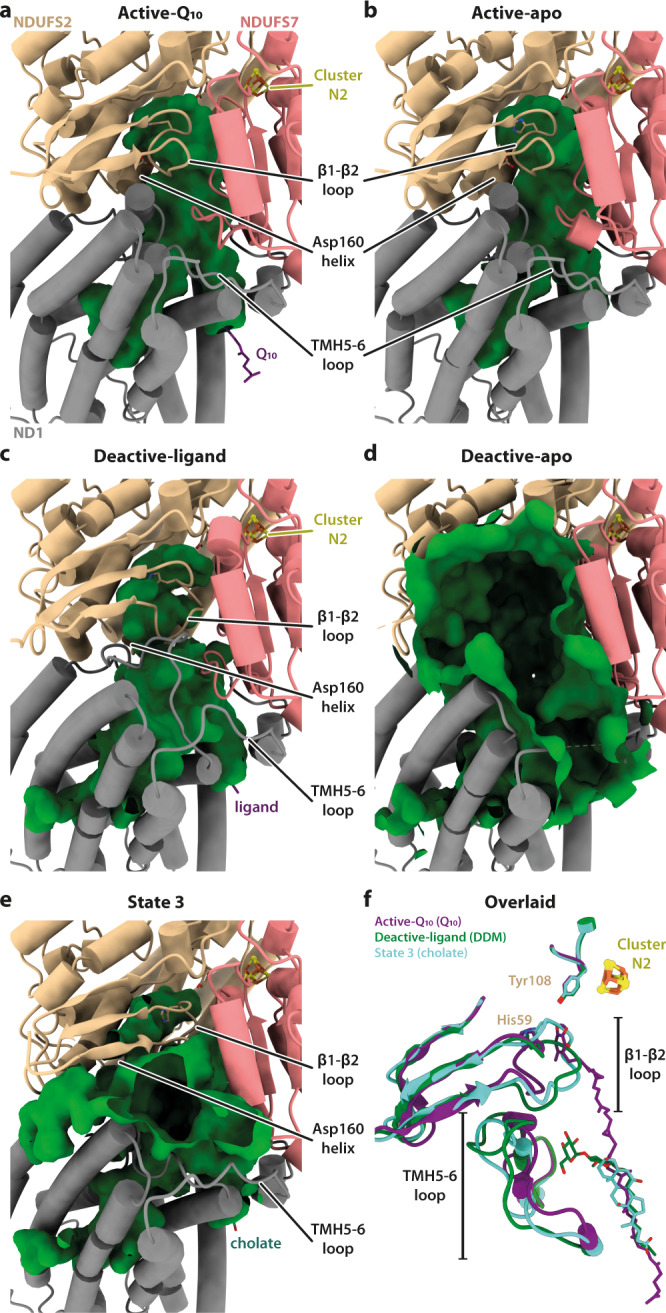
Fig. 4
Conformations of the Q-binding site loops and the cavities they encapsulate in the five observed states of complex I.
a u2013 e Cartoon representations of subunits ND1, NDUFS2, and NDUFS7 showing varying extents of disorder indicated as cavitiesu00a0(green surfaces) detected by CASTp 45 . Where visible, His59 NDUFS2 ...
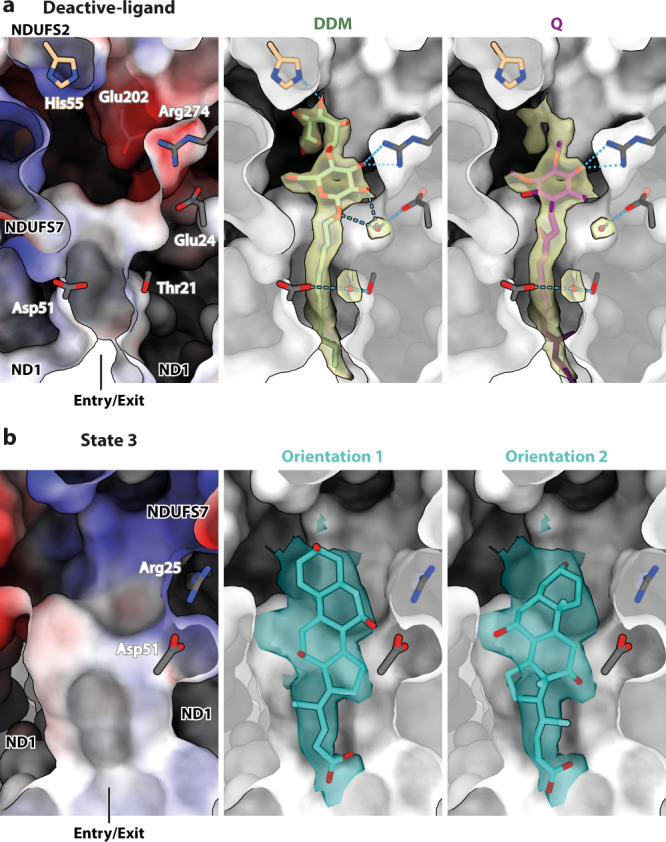
Fig. 5
Ligands bound at the entrance of the Q-binding site of complex I.
A clipped view of the surface representation of the entrance to the Q-binding channel in the ( a ) deactive-ligand and ( b ) state 3 models [coloured by Coulombic electrostatic potential (left) or by ...
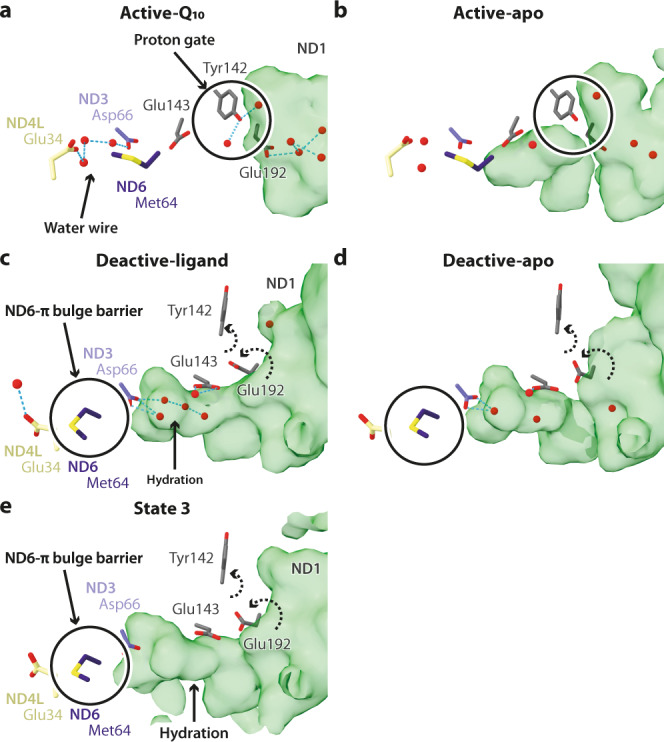
Fig. 6
The ND1 cavity and the E-channel that connect the Q-site to the first antiporter-like subunit ND2.
The proton pathways from subunits ND1 to ND4L in the ( a ) active-Q 10 , ( b ) active-apo, ( c ) deactive-ligand, ( d ) deactive-apo, and ( e ) state 3 states. Cavities (green surfaces) were identifie...
Figure images are served from the NIH/NLM PubMed Central Open Access Subset or Europe PMC; copyright remains with the publishers and authors.
💬 Discussion
0 commentsNo comments yet. Be the first to start a discussion!
Leave a Comment