Abstract
The SNF2h remodeler slides nucleosomes most efficiently as a dimer, yet how the two protomers avoid a tug-of-war is unclear. Furthermore, SNF2h couples histone octamer deformation to nucleosome sliding, but the underlying structural basis remains unknown. Here we present cryo-EM structures of SNF2h-nucleosome complexes with ADP-BeFx that capture two potential reaction intermediates. In one structure, histone residues near the dyad and in the H2A-H2B acidic patch, distal to the active SNF2h protomer, appear disordered. The disordered acidic patch is expected to inhibit the second SNF2h protomer, while disorder near the dyad is expected to promote DNA translocation. The other structure doesn't show octamer deformation, but surprisingly shows a 2 bp translocation. FRET studies indicate that ADP-BeFx predisposes SNF2h-nucleosome complexes for an elemental translocation step. We propose a model for allosteric control through the nucleosome, where one SNF2h protomer promotes asymmetric octamer deformation to inhibit the second protomer, while stimulating directional DNA translocation.
🔬 Techniques
🧬 Organisms
✨ Fluorophores
🔬 Cell Lines
🏭 Microscope Brands
🧪 Reagent Suppliers
📷 Detectors
💻 Software Details
💻 Code & Software
Analysis software for single-molecule fluorescence resonance energy transfer (smFRET) data.
Quantification of single-molecule FRET trajectories containing fast, non-instantaneous transitions
Python programs for electron microscopy
💾 Data Repositories
🏛️ Research Organizations (ROR)
Affiliated research institutions:
📋 Methods
Key resources table
Reagent type (species) or resource Designation Source or reference Identifiers Additional information Strain, strain background ( Escherichia coli ) Rosetta (DE3) Millipore sigma 70954 Chemically competent cells Strain, strain background ( Escherichia coli ) BL1 (DE3) pLysS Agilent Technologies 200132 Chemically competent cells Recombinant DNA reagent core Widom 601 (bold) andflanking DNAsequences ( Lowary and Widom, 1998 ) 5’-CGGCCGCC CTGGAGAATCCCGGTGCCGAGGCCGCTCAATTGGTCGTAGACAGCTCTAGCACCGCTTAAACGCACGTACGCGCTGTCCCCCGCGTTTTAACCGCCAAGGGGATTACTCCCTAGTCTCCAGGCACGTGTCAGATATATACATCCTGT GCATGTATTGAACAGCGACCTTGCCGGTGCCAGTCGGATAGTGTTCCGAGCTCCCACTCTAGAGGATCCCCGGGTACC-3’ Recombinant DNA reagent 601 plasmid ( Lowary and Widom, 1998 ) PCR template Recombinant DNA reagent pBH4-SNF2h ( Leonard and Narlikar, 2015 ) Expression plasmid Recombinant DNA reagent Pet3a-H2A ( Yang et al., 2006 ) Expression plasmid Recombinant DNA reagent Pet3a-H2B ( Yang et al., 2006 ) Expression plasmid Recombinant DNA reagent Pet3a-H3 ( Yang et al., 2006 ) Expression plasmid Recombinant DNA reagent Pet3a-H4 ( Yang et al., 2006 ) Expression plasmid Sequence-based reagent 601 core forward primer IDT 5’-CTGGAGAATCCCGGTGCCG-3’ Sequence-based reagent 601 + 60 reverse primer IDT 5’-AGAGTGGGAGCTCGG AACAC-3’ Sequence-based reagent Cy3- 601 core forward primer IDT 5’-/Cy3/CTGGAGAATCCCGGTGCCG-3’ Sequence-based reagent Cy5- 601–9 forward primer TriLink Biotechnologies 5’-{Cyanine5-C6-NH}GCGGCC GCCCTGGAGAATCC-3’ Sequence-based reagent Bio- 601 + 78 reverse primer IDT 5’-/5BioTeg/GGTACCCGG GGA TCCTCTAGAG-3’ Sequence-based reagent 601–120F C149cy5 Iba 5’-GGCACGTGTCAGATATATACATCCTGTG5ATGTATTGAACA-3’ 5 = cy5 C6-Amino-2'deoxycytidine Sequence-based reagent SNF2h K298E forward primer IDT 5’-GAGAAGTCTGTGTTCGAAAAATTTAATTGGAG-3’ Sequence-based reagent SNF2h K298E reverse primer IDT 5’-CTCCAATTAAATTTTTCGAAC ACAGACTTCTC-3’ Sequence-based reagent SNF2h K440A forward primer IDT 5’-CTCAACTCAGCAGGCG CGATGGACAAAATGAGG-3' Sequence-based reagent SNF2h K440A reverse primer IDT 5’-CCTCATTTTGTCCATCGCGCCTGCTGAGTTGAG-3' Sequence-based reagent SNF2h D442A forward primer IDT 5’-CTCAGCAGGCAAGATGGCGAAAATGAGGTTATTGAAC-3' Sequence-based reagent SNF2h D442A reverse primer IDT 5’-GTTCAATAACCTCATTTTCGCCATCTTGCCTGCTGAG-3' Sequence-based reagent SNF2h K443A forward primer IDT 5’-CAGCAGGCAAGATGGACGCGATGAGGTTATTGAACATC-3' Sequence-based reagent SNF2h K443A reverse primer IDT 5’-GATGTTCAATAACCTCATCGCGTCCATCTTGCCTGCTG-3' Sequence-based reagent SNF2h N448A forward primer IDT 5’-GACAAAATGAGGTTATTGGCGATCCTAATGCAGTTGAG-3' Sequence-based reagent SNF2h N448A Reverse primer IDT 5’-CTCAACTGCATTAGGATCGCCAATAACCTCATTTTGTC-3' Sequence-based reagent SNF2h W581A forward primer IDT 5’-GTAATTTTGTATGATTCTGATGCGAATCCCCAAGTAGATCTTC-3' Sequence-based reagent SNF2h W581A reverse primer IDT 5’-GAAGATCTACTTGGGGATTCGCATCAGAATCATACAAAATTAC-3' Peptide, recombinant protein ( Homo sapiens ) SNF2h ( Leonard and Narlikar, 2015 ) Peptide, recombinant protein ( Xenopus laevis ) Histone H2A ( Luger et al., 1997 ) Peptide, recombinant protein ( Xenopus laevis ) Histone H2B ( Luger et al., 1997 ) Peptide, recombinant protein ( Xenopus laevis ) Histone H3 ( Luger et al., 1997 ) Peptide, recombinant protein ( Xenopus laevis ) Histone H4 ( Luger et al., 1997 ) Peptide, recombinant protein ( Xenopus laevis ) Histone H3 33C ( Rowe and Narlikar, 2010 ) Peptide, recombinant protein ( Escherichia virus T4 ) T4 DNA Ligase New England Biolabs Cat #: M0202L Peptide, recombinant protein ( Bos taurus ) Catalase Sigma Cat #: E3289 Peptide, recombinant protein ( Aspergillus niger ) Glucose oxidase Sigma Cat #: G2133 Peptide, recombinant protein ( Oryctolagus cuniculus ) Lactate dehydrogenase Sigma Cat #: 427217 Peptide, recombinant protein ( Oryctolagus cuniculus ) Pyruvate Kinase Sigma Cat #: 10128155001 Chemical compound, drug ATP GE Cat #: 27-2056-01 Chemical compound, drug γ- 32 P-ATP Perkin Elmer Cat #: Blu002Z250uC Chemical compound, drug ADP Millipore sigma Cat #: 117105 Chemical compound, drug Cy3-maleimide Lumiprobe Cat #: 21080 Chemical compound, drug Cy5-maleimide Lumiprobe Cat #: 43080 Chemical compound, drug dNTPs Allstar Scientific Cat #: 471-5DN Chemical compound, drug N-(2-aminoethyl)−3-aminopropyltrimethoxysilane United Chemicals Cat #: A0700 Chemical compound, drug mPEG-SVA Laysan Bio Chemical compound, drug biotin-PEG-SVA Laysan Bio Chemical compound, drug acetylated BSA Promega Cat #: R3691 Chemical compound, drug Neutravidin Life Technologies A2666 Chemical compound, drug Trolox Sigma Cat #: 238813 Chemical compound, drug 10XTBE Bio-Rad Cat #: 161–0770 Chemical compound, drug Acrylamide/Bis-acrylamide Bio-rad Cat #: 161–0146 Chemical compound, drug HEPES Fisher Cat #: BP310 Chemical compound, drug Tris Base Thermo Fisher Cat #: BP1525 Chemical compound, drug NaCl RPI Cat #: S23020 Chemical compound, drug KCl Sigma Cat #: P3911 Chemical compound, drug MgCl 2 RPI Cat #: M24000 Chemical compound, drug Glycerol Sigma Cat #: G7893 Chemical compound, drug NP40 (IGEPAL) Sigma Cat #: I8896 Chemical compound, drug 2-Mercaptoethanol Sigma Cat #: M3148 Chemical compound, drug Glucose RPI Cat#: G32045 Chemical compound, drug NADH Millipore Sigma Cat#: 481913 Chemical compound, drug Phosphoenol Pyruvate Thermo Fisher Cat#: NC9842221 Software, algorithm Prism 6 Graphpad Software, algorithm Traces https://github.com/stephlj/Traces Software, algorithm pyhsmm https://github.com/mattjj/pyhsmm Software, algorithm Slopey https://github.com/stephlj/slopey Software, algorithm PyEM https://github.com/asarnow/pyem Software, algorithm Gautomatch http://www.mrc-lmb.cam.ac.uk/kzhang/ Software, algorithm SerialEM ( Mastronarde, 2005 ) Software, algorithm RELION 3.0 ( Zivanov et al., 2018 ) Software, algorithm Motioncor2 ( Zheng et al., 2017 ) Software, algorithm GCTF ( Zhang, 2016 ) Software, algorithm UCSFImage4 ( Li et al., 2015 ) Software, algorithm EMAN2 ( Tang et al., 2007 ) Software, algorithm CryoSPARC ( Punjani et al., 2017 ) Software, algorithm Diffmap.exe http://grigoriefflab.janelia.org/diffmap Software, algorithm Coot ( Emsley et al., 2010 ) Software, algorithm Phenix ( Adams et al., 2010 ) Software, algorithm ImageJ https://imagej.nih.gov/ij/ Other Superdex 200 increase10/300 GL GE Cat. #: 29091596 Other HiTrap QXL column GE Cat. #: 17-5159-01 Other Superdex 200 HiLoad 26/600 GE Cat. #: 28989336 Other TALON metal affinity resin Clontech Cat. # 635503 Protein expression, purification and complex preparation for cryo-EM Human SNF2h was expressed in Escherichia coli BL21(DE3) Rosetta cells and purified as previously described ( Leonard and Narlikar, 2015 ). SNF2h mutations were generated by site directed mutagenesis using the quick change protocol (Stratagene). Recombinant Xenopus laevis histones were expressed in E. coli, purified from inclusion bodies and assembled into octamers as described previously ( Luger et al., 1999 ). Briefly, histone protein octamer was reconstituted from denatured purified histones via refolding in high salt buffer and purified on a Superdex 200 increase 10/300 GL size exclusion column (GE Healthcare). DNA containing the Widom 601 positioning sequence with 60 bp of flanking DNA was made by large scale PCR with Taq DNA polymerase and purified by native PAGE as described previously ( Zhou and Narlikar, 2016 ). For remodeling assays, 5’ Cy3 labeled DNA was made by large scale PCR with a primer labeled at the 5’ end with the fluorophore ( Zhou and Narlikar, 2016 ).
Show full methods section
Key resources table
Reagent type (species) or resource Designation Source or reference Identifiers Additional information Strain, strain background ( Escherichia coli ) Rosetta (DE3) Millipore sigma 70954 Chemically competent cells Strain, strain background ( Escherichia coli ) BL1 (DE3) pLysS Agilent Technologies 200132 Chemically competent cells Recombinant DNA reagent core Widom 601 (bold) andflanking DNAsequences ( Lowary and Widom, 1998 ) 5’-CGGCCGCC CTGGAGAATCCCGGTGCCGAGGCCGCTCAATTGGTCGTAGACAGCTCTAGCACCGCTTAAACGCACGTACGCGCTGTCCCCCGCGTTTTAACCGCCAAGGGGATTACTCCCTAGTCTCCAGGCACGTGTCAGATATATACATCCTGT GCATGTATTGAACAGCGACCTTGCCGGTGCCAGTCGGATAGTGTTCCGAGCTCCCACTCTAGAGGATCCCCGGGTACC-3’ Recombinant DNA reagent 601 plasmid ( Lowary and Widom, 1998 ) PCR template Recombinant DNA reagent pBH4-SNF2h ( Leonard and Narlikar, 2015 ) Expression plasmid Recombinant DNA reagent Pet3a-H2A ( Yang et al., 2006 ) Expression plasmid Recombinant DNA reagent Pet3a-H2B ( Yang et al., 2006 ) Expression plasmid Recombinant DNA reagent Pet3a-H3 ( Yang et al., 2006 ) Expression plasmid Recombinant DNA reagent Pet3a-H4 ( Yang et al., 2006 ) Expression plasmid Sequence-based reagent 601 core forward primer IDT 5’-CTGGAGAATCCCGGTGCCG-3’ Sequence-based reagent 601 + 60 reverse primer IDT 5’-AGAGTGGGAGCTCGG AACAC-3’ Sequence-based reagent Cy3- 601 core forward primer IDT 5’-/Cy3/CTGGAGAATCCCGGTGCCG-3’ Sequence-based reagent Cy5- 601–9 forward primer TriLink Biotechnologies 5’-{Cyanine5-C6-NH}GCGGCC GCCCTGGAGAATCC-3’ Sequence-based reagent Bio- 601 + 78 reverse primer IDT 5’-/5BioTeg/GGTACCCGG GGA TCCTCTAGAG-3’ Sequence-based reagent 601–120F C149cy5 Iba 5’-GGCACGTGTCAGATATATACATCCTGTG5ATGTATTGAACA-3’ 5 = cy5 C6-Amino-2'deoxycytidine Sequence-based reagent SNF2h K298E forward primer IDT 5’-GAGAAGTCTGTGTTCGAAAAATTTAATTGGAG-3’ Sequence-based reagent SNF2h K298E reverse primer IDT 5’-CTCCAATTAAATTTTTCGAAC ACAGACTTCTC-3’ Sequence-based reagent SNF2h K440A forward primer IDT 5’-CTCAACTCAGCAGGCG CGATGGACAAAATGAGG-3' Sequence-based reagent SNF2h K440A reverse primer IDT 5’-CCTCATTTTGTCCATCGCGCCTGCTGAGTTGAG-3' Sequence-based reagent SNF2h D442A forward primer IDT 5’-CTCAGCAGGCAAGATGGCGAAAATGAGGTTATTGAAC-3' Sequence-based reagent SNF2h D442A reverse primer IDT 5’-GTTCAATAACCTCATTTTCGCCATCTTGCCTGCTGAG-3' Sequence-based reagent SNF2h K443A forward primer IDT 5’-CAGCAGGCAAGATGGACGCGATGAGGTTATTGAACATC-3' Sequence-based reagent SNF2h K443A reverse primer IDT 5’-GATGTTCAATAACCTCATCGCGTCCATCTTGCCTGCTG-3' Sequence-based reagent SNF2h N448A forward primer IDT 5’-GACAAAATGAGGTTATTGGCGATCCTAATGCAGTTGAG-3' Sequence-based reagent SNF2h N448A Reverse primer IDT 5’-CTCAACTGCATTAGGATCGCCAATAACCTCATTTTGTC-3' Sequence-based reagent SNF2h W581A forward primer IDT 5’-GTAATTTTGTATGATTCTGATGCGAATCCCCAAGTAGATCTTC-3' Sequence-based reagent SNF2h W581A reverse primer IDT 5’-GAAGATCTACTTGGGGATTCGCATCAGAATCATACAAAATTAC-3' Peptide, recombinant protein ( Homo sapiens ) SNF2h ( Leonard and Narlikar, 2015 ) Peptide, recombinant protein ( Xenopus laevis ) Histone H2A ( Luger et al., 1997 ) Peptide, recombinant protein ( Xenopus laevis ) Histone H2B ( Luger et al., 1997 ) Peptide, recombinant protein ( Xenopus laevis ) Histone H3 ( Luger et al., 1997 ) Peptide, recombinant protein ( Xenopus laevis ) Histone H4 ( Luger et al., 1997 ) Peptide, recombinant protein ( Xenopus laevis ) Histone H3 33C ( Rowe and Narlikar, 2010 ) Peptide, recombinant protein ( Escherichia virus T4 ) T4 DNA Ligase New England Biolabs Cat #: M0202L Peptide, recombinant protein ( Bos taurus ) Catalase Sigma Cat #: E3289 Peptide, recombinant protein ( Aspergillus niger ) Glucose oxidase Sigma Cat #: G2133 Peptide, recombinant protein ( Oryctolagus cuniculus ) Lactate dehydrogenase Sigma Cat #: 427217 Peptide, recombinant protein ( Oryctolagus cuniculus ) Pyruvate Kinase Sigma Cat #: 10128155001 Chemical compound, drug ATP GE Cat #: 27-2056-01 Chemical compound, drug γ- 32 P-ATP Perkin Elmer Cat #: Blu002Z250uC Chemical compound, drug ADP Millipore sigma Cat #: 117105 Chemical compound, drug Cy3-maleimide Lumiprobe Cat #: 21080 Chemical compound, drug Cy5-maleimide Lumiprobe Cat #: 43080 Chemical compound, drug dNTPs Allstar Scientific Cat #: 471-5DN Chemical compound, drug N-(2-aminoethyl)−3-aminopropyltrimethoxysilane United Chemicals Cat #: A0700 Chemical compound, drug mPEG-SVA Laysan Bio Chemical compound, drug biotin-PEG-SVA Laysan Bio Chemical compound, drug acetylated BSA Promega Cat #: R3691 Chemical compound, drug Neutravidin Life Technologies A2666 Chemical compound, drug Trolox Sigma Cat #: 238813 Chemical compound, drug 10XTBE Bio-Rad Cat #: 161–0770 Chemical compound, drug Acrylamide/Bis-acrylamide Bio-rad Cat #: 161–0146 Chemical compound, drug HEPES Fisher Cat #: BP310 Chemical compound, drug Tris Base Thermo Fisher Cat #: BP1525 Chemical compound, drug NaCl RPI Cat #: S23020 Chemical compound, drug KCl Sigma Cat #: P3911 Chemical compound, drug MgCl 2 RPI Cat #: M24000 Chemical compound, drug Glycerol Sigma Cat #: G7893 Chemical compound, drug NP40 (IGEPAL) Sigma Cat #: I8896 Chemical compound, drug 2-Mercaptoethanol Sigma Cat #: M3148 Chemical compound, drug Glucose RPI Cat#: G32045 Chemical compound, drug NADH Millipore Sigma Cat#: 481913 Chemical compound, drug Phosphoenol Pyruvate Thermo Fisher Cat#: NC9842221 Software, algorithm Prism 6 Graphpad Software, algorithm Traces https://github.com/stephlj/Traces Software, algorithm pyhsmm https://github.com/mattjj/pyhsmm Software, algorithm Slopey https://github.com/stephlj/slopey Software, algorithm PyEM https://github.com/asarnow/pyem Software, algorithm Gautomatch http://www.mrc-lmb.cam.ac.uk/kzhang/ Software, algorithm SerialEM ( Mastronarde, 2005 ) Software, algorithm RELION 3.0 ( Zivanov et al., 2018 ) Software, algorithm Motioncor2 ( Zheng et al., 2017 ) Software, algorithm GCTF ( Zhang, 2016 ) Software, algorithm UCSFImage4 ( Li et al., 2015 ) Software, algorithm EMAN2 ( Tang et al., 2007 ) Software, algorithm CryoSPARC ( Punjani et al., 2017 ) Software, algorithm Diffmap.exe http://grigoriefflab.janelia.org/diffmap Software, algorithm Coot ( Emsley et al., 2010 ) Software, algorithm Phenix ( Adams et al., 2010 ) Software, algorithm ImageJ https://imagej.nih.gov/ij/ Other Superdex 200 increase10/300 GL GE Cat. #: 29091596 Other HiTrap QXL column GE Cat. #: 17-5159-01 Other Superdex 200 HiLoad 26/600 GE Cat. #: 28989336 Other TALON metal affinity resin Clontech Cat. # 635503 Protein expression, purification and complex preparation for cryo-EM Human SNF2h was expressed in Escherichia coli BL21(DE3) Rosetta cells and purified as previously described ( Leonard and Narlikar, 2015 ). SNF2h mutations were generated by site directed mutagenesis using the quick change protocol (Stratagene). Recombinant Xenopus laevis histones were expressed in E. coli, purified from inclusion bodies and assembled into octamers as described previously ( Luger et al., 1999 ). Briefly, histone protein octamer was reconstituted from denatured purified histones via refolding in high salt buffer and purified on a Superdex 200 increase 10/300 GL size exclusion column (GE Healthcare). DNA containing the Widom 601 positioning sequence with 60 bp of flanking DNA was made by large scale PCR with Taq DNA polymerase and purified by native PAGE as described previously ( Zhou and Narlikar, 2016 ). For remodeling assays, 5’ Cy3 labeled DNA was made by large scale PCR with a primer labeled at the 5’ end with the fluorophore ( Zhou and Narlikar, 2016 ).
DNA labeled at two locations for ensemble
FRET experiments was prepared by large scale PCR of two separate DNA templates (207 bp DNA 5’-cy3 labeled, using labeled primers (IBA Life Sciences). 120 µg of each DNA template was digested with AflIII at 37°C overnight and purified by native PAGE. Purified DNA fragments were then ligated with 8000 units of T4 DNA ligase with 1 mM ATP•MgCl 2 (New England Biolabs) for 20 min at room temperature and purified again by native PAGE. Nucleosomes were reconstituted by the salt gradient dialysis method and purified by glycerol gradient centrifugation ( Zhou and Narlikar, 2016 ). Purified nucleosomes were flash frozen in liquid nitrogen and stored at −80°C. The sequence of the 601 sequence with 60 bp of flanking DNA (207 bp DNA) is as follows: CTGGAGAATCCCGGTGCCGAGGCCGCTCAATTGGTCGTAGACAGCTCTAGCACCGCTTAAACGCACGTACGCGCTGTCCCCCGCGTTTTAACCGCCAAGGGGATTACTCCCTAGTCTCCAGGCACGTGTCAGATATATACATCCTGTGCATGTATTGAACAGCGACCTTGCCGGTGCCAGTCGGATAGTGTTCCGAGCTCCCACTCT Pre-assembled nucleosomes were first dialyzed overnight into 25 mM HEPES pH 7.5 to remove glycerol before sample preparations for cryo-EM. To prepare the nucleosome-SNF2h complex, nucleosomes were mixed with purified SNF2h on ice, then incubated at room temperature for 10 min before applying to the grids for plunge freezing. Initially, the complex was prepared by mixing 1.45 µM 0/60 nucleosomes with 5 µM SNF2h in 20 mM HEPES pH 7.5, 70 mM KCl, 0.5 mM ADP-Mg 2+ , 0.5 mM MgCl 2 , 0.5 mM BeF x (1:5 BeCl 2 :NaF). This sample yielded a reconstruction of nucleosome with two SNF2h bound at 8.4 Å resolution by using a scintillator-based camera. The other sample was prepared by mixing 0.625 µM 0/60 nucleosomes with 1.25 µM SNF2h in 0.5 mM ADP-Mg, 0.5 mM BeF x , 0.5 mM MgCl 2 , 140 mM KCl, 3 mM Tris pH 7.5, 1.25 mM HEPES pH 7.5, 1.5% glycerol. This resulted in high-resolution reconstructions using direct electron detection camera. While the resolution difference is mainly caused by the camera technology and unlikely to be related to the differences in sample preparation, the salt concentration could be amplified during the process of blotting and plunge freezing. For the nucleosome alone reconstruction, 1 µM nucleosomes were used directly after the dialysis. When plunge freezing cryo-EM grids, both protein and solutes in buffer are concentrated but to very different extents. The concentration of SNF2h-nucleosome samples on cryo-EM grids are roughly ~100 µM, estimated from the number of particles seen in micrographs. This concentration increase is mostly caused by the volume reduction (~10,000 fold) during blotting, in which filter papers preferably absorb water with chemical solutes over proteins. It is not possible to estimate the final concentration of KCl and ADP-BeF x in a frozen cryo-EM grid, but it may also increase several folds from the sample applied to EM grids, because of evaporation between blotting and freezing. Thus, 70 mM KCl could become as high as ~200 mM and 140 mM KCl become ~400 mM before freezing. If so, it would profoundly impact the binding affinity of SNF2h to the nucleosome, and/or the affinity of ADP-BeF x for SNF2h. We also speculate that macromolecular interactions that are destabilized by the higher ionic strength are more susceptible to being disassembled by the air-water interface during plunge freezing. Negative stain EM Grids of negatively stained sample were prepared as described ( Ohi et al., 2004 ). Sample from these grids was then observed on a Tecnai T12 (FEI) operated at 120kV ( Figure 2—figure supplement 3A–D ). From collected micrographs, monodisperse particles were picked manually, windowed out and subjected to template-free 2D classification using RELION ( Scheres, 2012 ). Selected representative classes are show in Figure 2—figure supplement 3E . Only monodispersed particles were pick for further processing.
Cryo-EM data acquisition
Cryo-EM grids of nucleosome-SNF2h or nucleosome alone samples were prepared following established protocol ( Liao et al., 2013 ). Specifically, 2.5 µl of nucleosome-SNF2h complexes (or 3 µl of samples of nucleosome alone) were applied to a glow discharged Quantifoil holey carbon grid (1.2 µm hole size, 400 mesh), blotted in a Vitrobot Mark I (FEI Company) using 6 s blotting at 100% humidity, and then plunge-frozen in liquid ethane cooled by liquid nitrogen. The scintillator-based camera dataset was collected at liquid nitrogen temperature on a Tecnai TF20 (Thermo Fisher Scientific) electron microscope equipped with field emission gun (FEG) electron source and operated at 200kV. Images were recorded on a TemF816 8k × 8 k CMOS camera (TVIPS GmbH) at a nominal magnification of 62,000X, corresponding to a pixel size of 1.2 Å/pixel on the specimen, with a defocus in the range from 1.8 to 2.9 µm. Data collection follows the low-dose procedure using UCSFImage4 ( Li et al., 2015 ). The K2 camera dataset of nucleosome-SNF2h complex was collected using UCSFImage4 on a TF30 Polara electron microscope (Thermo Fisher Scientific) equipped with a FEG source and operated at 300 kV. Specifically, images were recorded in super resolution counting mode using a K2 Summit direct electron detection camera (Gatan Inc) at a nominal magnification of 31,000X, corresponding to a calibrated physical pixel size of 1.22 Å/pixel. The dose rate on camera was set to 8.2 counts (corresponding to 9.9 electrons) per physical pixel per second. The total exposure time was 6 s, leading to a total accumulated dose of 41 electrons per Å 2 on the specimen. Each image was fractionated into 30 subframes, each with an accumulated exposure time of 0.2 s. Images were recorded with a defocus in the range from 1.5 to 3.0 um. The K2 dataset of nucleosome alone was collected in the same microscope under the identical imaging conditions, except SerialEM was used for automated acquisition ( Mastronarde, 2005 ).
Image processing
For dataset collected with scintillator based camera, there is no movie stack related image processing, such as motion correction and dose weighting. Otherwise, same software packages and procedures were used as for the K2 datasets. For K2 datasets, movie stacks were corrected for both global and local motions using MotionCor2 v1.0.0., which outputs both dose-weighted and un-weighted sum of corrected subframes ( Zheng et al., 2017 ). The output images were first visually inspected for particle distribution. The non-dose-weighted images were used for CTF parameter determination using GCTF ( Zhang, 2016 ). The estimated image resolution and quality of Thon ring fitting were inspected manually and images with poor quality were removed from further image processing. For the rest of image processing, only dose-weighted sums were used. For particle picking, an initial ~1000 particles were manually picked using e2boxer (EMAN2) ( Tang et al., 2007 ), followed by two-dimensional (2D) reference free alignment and classification by using Relion2 ( Scheres, 2012 ). Six unique 2D class averages were used as template reference for an automated particle picking using Gautomatch ( http://www.mrc-lmb.cam.ac.uk/kzhang/ ). Only monodispersed particles are picked. Particle aggregations, which are occasionally seen, are excluded. All picked particles were subject to reference free 2D classifications. Particles within 2D classes that show clear nucleosome features were selected and were further inspected visually to remove any remaining ‘junk’ particles. The total number of particles in each dataset is listed in Figure 2—figure supplement 2 and Tables 1 – 2 . For initial model generation and subsequent runs, cryoSPARC ‘Ab initio’, ‘Homogeneous refinement’ and ‘Heterogeneous refinement’ procedures were employed ( Punjani et al., 2017 ). For masked refinement and classification without alignment, we used RELION 2. The detailed scheme of classifications and refinements are shown in the Figure 2—figure supplement 2 . The refinement follows gold-standard refinement procedure ( Scheres and Chen, 2012 ), and the final resolutions were estimated using Fourier Shell Correlation (FSC) equals 0.143 criterion ( Rosenthal and Henderson, 2003 ). 10.7554/eLife.46057.026 Table 1. Summary table for data collection and refinement on TVIPS 816 scintillator-based camera Dataset Single-bound SNF2h-nucleosome complex at SHL + 2 Doubly-bound SNF2h-nucleosome at SHL ± 2 Microscope TF20 (FEI) TF20 (FEI) Voltage (kV) 200 200 Camera TemF816 8k × 8 k CMOS (TVIPS) TemF816 8k × 8 k CMOS (TVIPS) Magnification 62.000 62.000 Pixel size (Å) 1.2 1.2 Defocus range (µm) −1.8: −2.9 −1.8: −2.9 Number of images 766 766 Total electron dose (e - /Å 2 ) 25 25 Number of frames - - Initial number of particles 450322 450322 Particles selected after 2D cleanup 379540 379540 Particles in final reconstruction 32233 57060 Final resolution (Å) 8.4 8.4 10.7554/eLife.46057.027 Table 2. Summary table for data collection and refinement on Gatan K2-Summit direct electron detector camera. Dataset Single-bound SNF2h-nucleosome complex: SHL-2/SHL + 2 Single-bound SNF2h-nucleosome complex, SHL-2 Core nucleosome Microscope TF30 (FEI) TF30 (FEI) TF30 (FEI) Voltage (kV) 300 300 300 Camera K2 summit (Gatan) K2 summit (Gatan) K2 summit (Gatan) Magnification 31.000 31.000 31.000 Pixel size (Å) 1.22 1.22 1.22 Defocus range (µm) −1.5: −3.0 −1.5: −3.0 −1.5: −3.0 Number of images 720 720 720 Total electron dose (e - /Å 2 ) 42 42 42 Number of frames 30 30 30 Initial number of particles 120533 333430 24993 Particles selected after 2D cleanup 95879 no cleanup 19363 Particles in final reconstruction 27513/6241 43165 12130 Final resolution (Å) 3.9/6.9 3.4 7.4 The K2 dataset was used in two independent analyses. In the first analysis, we picked 120,533 particles and classified into 50 2D class averages. Particles within low quality 2D classes were removed. Through sequential classification and refinement, we obtained a 3.8 Å reconstruction of single SNF2h-bound nucleosome. To separate particles with SNF2h bound to SHL+2 and SHL-2, we first used volume subtraction procedure to subtract the SNF2h from all particles followed by unambiguously aligning all nucleosome particles using the flanking DNA as a fiducial mark. We then performed a focused classification on SNF2h, which lead to two main subclasses: one reconstruction at 3.9 Å resolution has SNF2h bound to the SHL-2 position. The other one at 6.9 Å resolution has SNF2h bound to the SHL + 2 position ( Figure 1—figure supplement 2 ). Both reconstructions show a 2 bp translocation of DNA ( Figure 1—figure supplement 3 ). Independently, we re-processed frame motion correction by using MotionCor2 v1.2.1, with option accounting for in-frame motion enabled (InFmMotion 1). The motion corrected images were subjected again to independent particle picking and CTF estimation. In this reprocess, we started with 333,430 initially picked particles ( Figure 2—figure supplement 2C ). We skipped 2D classification for cleaning up the dataset, instead using 3D classification for this purpose. Using cryoSPARC v2 ‘Ab initio reconstruction’ and ‘Heterogeneous refinement’, in subsequent rounds of subsorting, the final reconstruction contains 43,165 particles, which yielded 3.4 Å reconstruction using ‘Non-homogeneous refinement’. We also attempted to separate particles into SNF2h bound to SHL+2 and SHL-2 positions using focused classification and signal subtraction. We succeeded by obtaining a 3.6 Å SHL-2 reconstruction from 28500 particles and a 4.5 Å reconstruction from 14665 particles. The latter likely still contains a mix of SHL+2 and SHL-2 that we were unable to separate further. Validation of 2 base-pair translocated nucleosome We ruled out the possibility of nucleosome mis-assembly as described in the main text ( Figure 1—figure supplements 5 – 6 ). Furthermore, the following additional experiments were carried out to rule out the possibility of any computational artifacts, such as incomplete separation of particles with SNF2h bound to SHL+2 and SHL-2 positions. In addition to the fact that the 3.9 Å reconstruction shows that DNA has a sharp ending without any weak extension, we calculated 20 bootstrapped 3D reconstructions using a subset of particles bootstrapped from the particles that were used to calculate the 3.9 Å map ( Figure 1—figure supplement 6 ). These bootstrapped reconstructions show no significant variance at the location of this extra density. These observations demonstrate that this extra density is statistically significant and well defined, and cannot be contributed by misaligned particles. Furthermore, we calculated difference maps between all experimental maps determined from datasets recorded with K2-Summit and the map simulated from the atomic model of nucleosome without the two extra base-pairs at the exit side ( Figure 1—figure supplement 5 ). We also calculated difference maps between the reconstruction of nucleosome alone and the reconstructions of SNF2h bound to either SHL+2 or SHL-2 ( Figure 1—figure supplement 5A–B ). These difference maps confirm the existence of extra DNA density at the exit side of our SNF2h-nucleosome complex reconstructions. To calculate the variance map, we bootstrapped 5000 particles 20 times from the 3.9 Å SNF2h dataset and backprojected particles within these subsets to produce 20 reconstructions using relion_reconstruct in Relion2. The variance map between all reconstructions was then calculated. All scripts are included in PyEM ( https://github.com/asarnow/pyem ). The difference maps were calculated using program diffmap.exe ( http://grigoriefflab.janelia.org/diffmap ).
Model building and refinement
For the nucleosome 0/60 nucleosome, we used Widom 601 structure crystal structure ( Vasudevan et al., 2010 ) (PDBID: 3LZ1) and mutated the DNA to reflect the exact sequence used for the sample. We then used Coot ( Emsley et al., 2010 ) and Phenix (phenix.realspacerefine) ( Adams et al., 2010 ) to extend and fit the DNA into our structures, as well as ensure the correctness of the structure. SNF2h was constructed using homology modeling, based on an ISWI crystal structure from Myceliophthora thermophile (PDBID: 5JXR) ( Yan et al., 2016 ). We separated each of the domains and used rigid body fitting into the EM density. Subsequently, Coot and Phenix were used to adjust and modify parts of the model. For model cross-validation, the final structure was initially subjected to 0.1 Å random displacement and then refined against one of the two half-maps using Phenix. Subsequently, the refined pdb was converted to a density map and FSC curves were calculated between three maps: half map 1 (the refinement map, 'work'), half map 2 (not used for refinement, 'free') and the summed map. A very small difference between the 'work' and 'free' FSC curves indicates little-to-no effect of over-fitting of the atomic model. Figures were prepared using UCSF Chimera ( Pettersen et al., 2004 ).
Native gel remodeling assay
All remodeling reactions were performed under single turnover conditions (enzyme in excess of nucleosomes) using similar methods as described previously ( Zhou and Narlikar, 2016 ). Reactions with SNF2h were performed at 20°C with 15 nM cy3-labeled nucleosomes, 12.5 mM HEPES pH 7.5, 2 mM Tris pH 7.5, 70 mM KCl, 5 mM ATP-MgCl 2 , 3 mM MgCl 2 ,0.02% NP40, and ~3%(v/v) glycerol. 5 µL time points were quenched with equal volumes of stop buffer containing an excess of ADP and plasmid DNA. Nucleosomes were resolved on a 6% polyacrylamide 0.5X TBE native gel. Reactions were visualized by scanning on a Typhoon variable mode imager (GE Healthcare) and quantified using ImageJ.
Ensemble FRET assay
Steady state fluorescence measurements were performed on an ISS K2 fluorometer equipped with a 550 nm short pass and 535 nm long pass filter in front of excitation and emission monochromators respectively. Fluorescence emission spectra were collected by excitation at 515 nm and emission intensities measured between 550–750 nm in 5 nm wavelength increments. FRET efficiency was determined by the following equation: F R E T E f f i c i e n c y = E m 665 E m 665 + E m 565 Where Em 665 and Em 565 are the maximal acceptor and donor emission intensities at 665 nm and 565 nm respectively. Reactions were carried out with a final volume of 80 µL and with final concentrations of 8 nM labeled nucleosomes, 12.5 mM HEPES pH 7.5, 2 mM Tris pH 7.5, 0.5 mM MgCl 2 , 0.02% NP40,~4% glycerol at 20°C. Each reaction was incubated for ~10 min before an initial emission spectrum was obtained. Reactions were then initiated with 3 µL 2 µM of SNF2h and 0.5 mM ADP-BeF x -MgCl 2 (final concentration) or buffer and emission spectra were obtained at various time points after initiating the reactions. Kinetic measurements were normalized to the FRET efficiency of the initial measurement.
Single molecule FRET
Experiments were performed as in Gamarra et al. (2018) , except that the imaging buffer was 53 mM HEPES-KOH, pH 7.5 at 22°C, 9.1 mM Tris-acetate, pH 7.5 at 22°C, 140 mM KCl, 0.5 mM MgCl 2 , 10% glycerol, 0.02% NP-40, 1% glucose, 0.1 mg/mL acetylated BSA, 2 mM Trolox, 0.03 mM β–mercaptoethanol, 2 U/µL catalase, and 0.08 U/µL glucose oxidase. SNF2h and ADP-BeF x were added simultaneously to a final concentration of 2 µM and 0.5 mM respectively using an automated syringe pump. Nucleosomes were then imaged after a 10 min incubation to match the EM preparation conditions. 7 min movies were collected at a sufficiently high laser power that most nucleosomes photobleached before the end of the movie, enabling the exclusion of nucleosomes that did not exhibit single-step photobleaching in both channels. The reported FRET value for each nucleosome is the average over the portion of the movie prior to the first photobleaching event.
ATPase assays
DNA stimulated ATPase assays were performed using an NADH coupled assay ( Lindsley, 2001 ). Reactions were performed with 800 nM SNF2h, saturating concentrations of 207 bp DNA (208 nM) and ATP-MgCl 2 (4 mM) with 10 U/µL lactate dehydrogenase, 10 U/µL Pyruvate kinase, 180 µM NADH, 2 mM phosphoenol pyruvate, 12.5 mM HEPES pH 7.5, 70 mM KCl, 3 mM free MgCl 2 , and ~1.5% glycerol at 25°C. Reactions were incubated in a 384 well plate at 25°C prior to addition of enzyme to initiate the reaction. Absorbance was monitored at 340 nm in a SpectraMax M5e plate reader and the resulting data was background subtracted using absorbance at 420 nm. The linear phase of each reaction was then fit using linear regression using Prism to obtain hydrolysis rates. For nucleosome stimulated ATP hydrolysis, rates were measured using radioactivity as in Gamarra et al. (2018) under saturating concentrations of nucleosomes without flanking DNA and subsaturating concentrations of (20 µM) ATP-MgCl 2 . Reactions were performed in 12.5 mM HEPES pH 7.5, 70 mM KCl, 3 mM free MgCl 2 , 0.02% NP-40, and ~1.5% glycerol at 25°C, initiated by addition of enzyme, and time points quenched with an equal volume 50 mM Tris pH 7.5, 3% SDS, and 100 mM EDTA. Time points were resolved on a PEI-cellulose TLC plate (Select Scientific) using a 0.5M LiCl/1M Formic acid mobile phase, plates were dried and then exposed on a phosphorscreen overnight. The screen was imaged using a Typhoon variable mode imager. Fraction of ATP hydrolyzed was quantified using ImageJ and initial rates were determined by fitting a line through the first 10% of inorganic phosphate generated using Prism.
Additional files 10.7554/eLife.46057.029 Supplementary file 1. Key Resources Table. 10.7554/eLife.46057.030 Transparent reporting form
📊 Figures
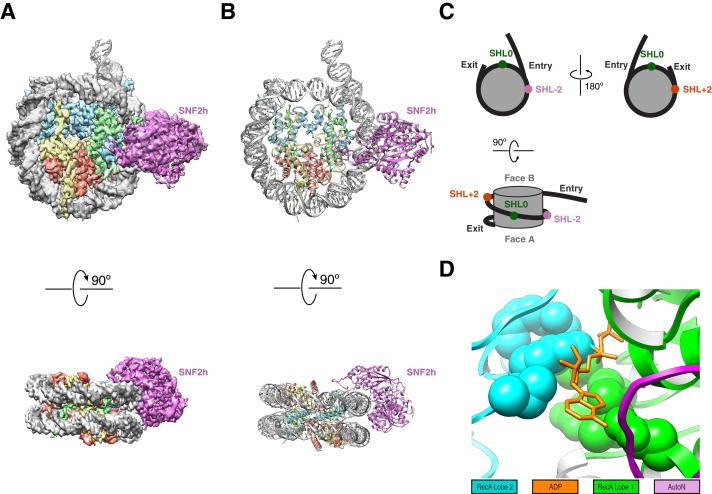
Figure 1.
High resolution structure of SNF2h bound to a nucleosome with 60 bp of flanking DNA in the presence of ADP-BeF x and 140 mM KCl.
( A ) Cryo-EM density map of SNF2h bound to the nucleosome at 3.4 u00c5 from data recorded with a K2-summit camera. ( B ) Model built using the density in ( A ). ( C ) Cartoon representation of a nucl...
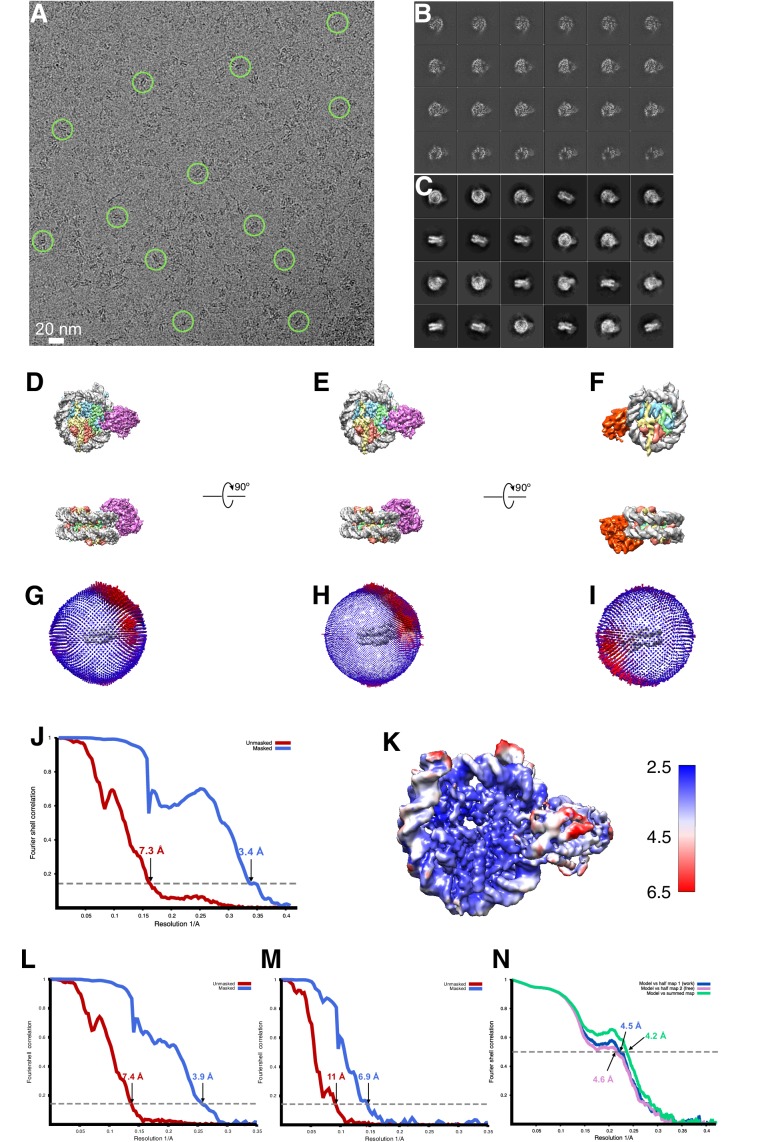
Figure 1u2014figure supplement 1.
Cryo-EM analysis of singly bound SNF2h-nucleosome complexes (140 mM KCl) .
( A ) A raw cryo-EM micrograph of single bound SNF2h-nucleosome complex recorded as described in Materials and methods.u00a0Examples of monodisperse particles are circled. ( B ) Slices through the uns...
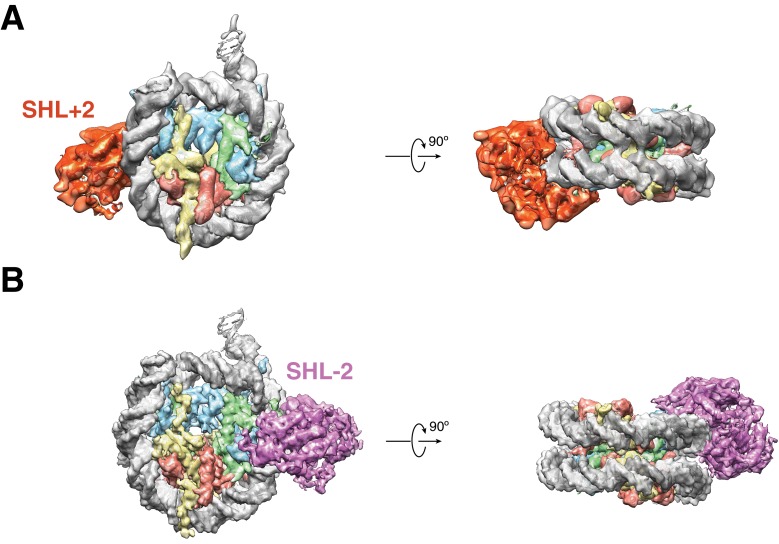
Figure 1u2014figure supplement 2.
Cryo-EM Densities of SHL+2 and SHL-2 SNF2h-Nucleosome complexes obtained at 140 mM.
KCl Cryo-EM reconstructions of single-SNF2h bound nucleosomes from data recorded on a K2-summit direct electron bound at ( A ) SHLu00a0+2 at 6.9 u00c5 resolution and ( B ) SHL-2 at 3.9 u00c5 resolutio...
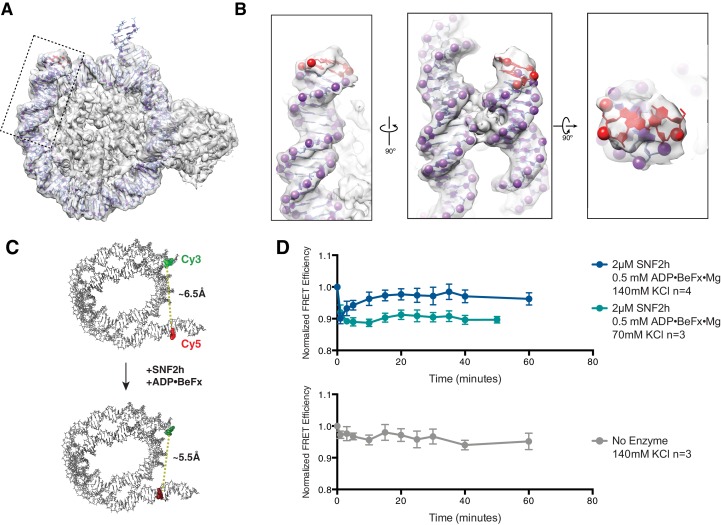
Figure 1u2014figure supplement 3.
Cryo-EM reconstructions of the SNF2h-Nucleosome complexes at 140 mM KCl are translocatedu00a0~2 bp.
( A ) High resolution structure from Figure 1u2014figure supplement 2B with Cryo-EM density fit with an atomic model.u00a0The additional 2 bp of DNA exiting the canonical nucleosome structure are high...
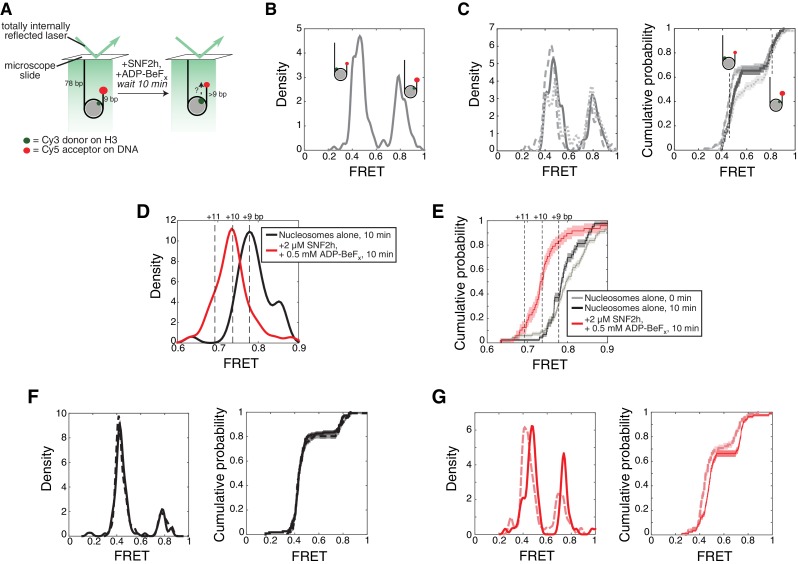
Figure 1u2014figure supplement 4.
By a single molecule assay, SNF2h induces a change in FRET under the 140 mM KCl conditions, consistent with a movement of the nucleosomal DNA.
( A ) Setup of the single molecule assay. Nucleosomes with 78 bp flanking DNA on one side are attached to the surface of a microscope slide and imaged using total internal reflection fluorescence micr...
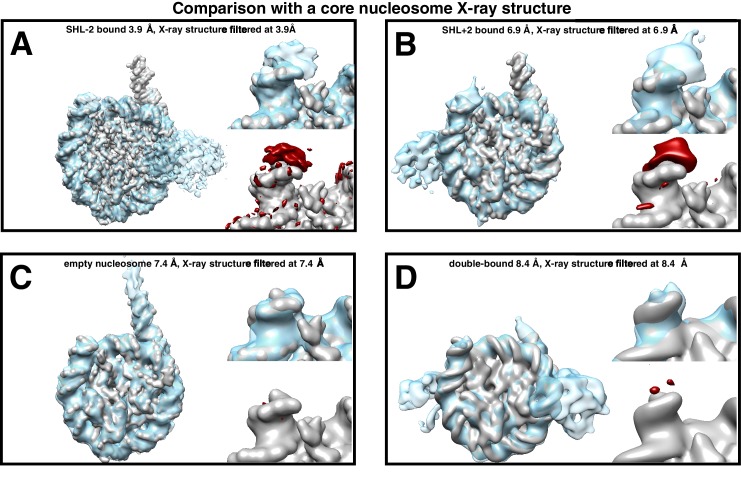
Figure 1u2014figure supplement 5.
Difference maps to test for extra density of DNA at exit side of SNF2h-nucleosome complexes.
( Au2013C ) Cryo-EM density map of the nucleosome either with SNF2h bound at ( A ) SHL-2 and ( B ) SHL+2 with 140 mM KCl with the simulated density map of nucleosome without two additional base-pairs ...
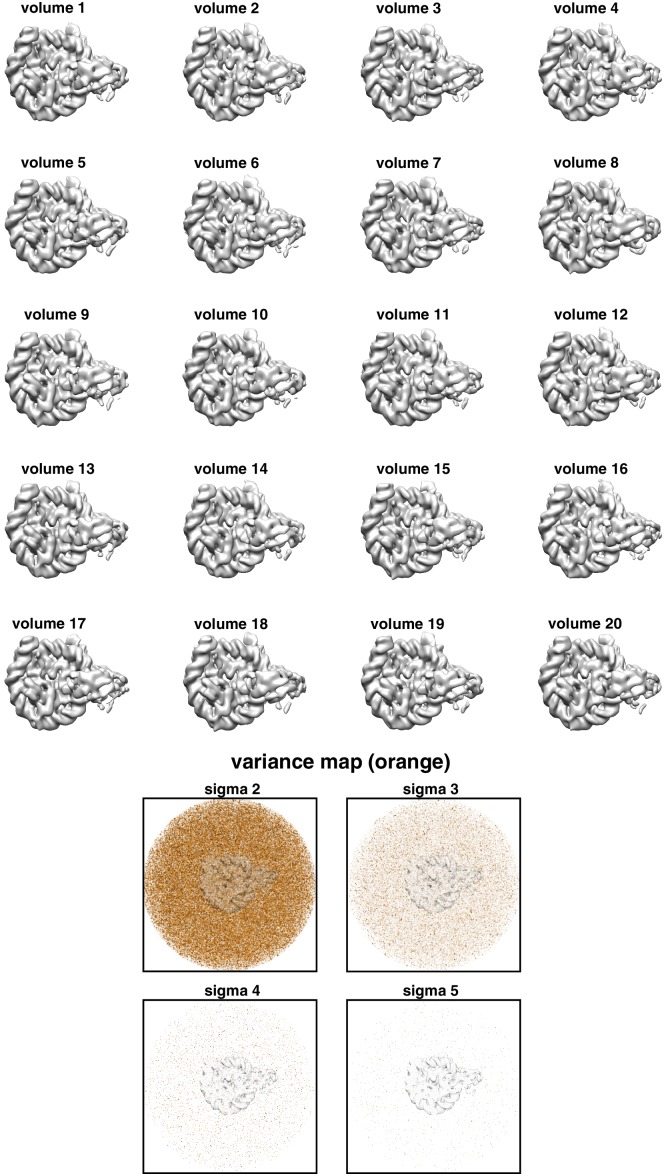
Figure 1u2014figure supplement 6.
Bootstrapped maps of SNF2h-nucleosome complex.
20 bootstrapped maps were calculated by using 20 subsets of 5000 particles bootstrapped from the particles that were used to calculate the 3.9 u00c5 reconstruction.u00a0Slices through the variance map...
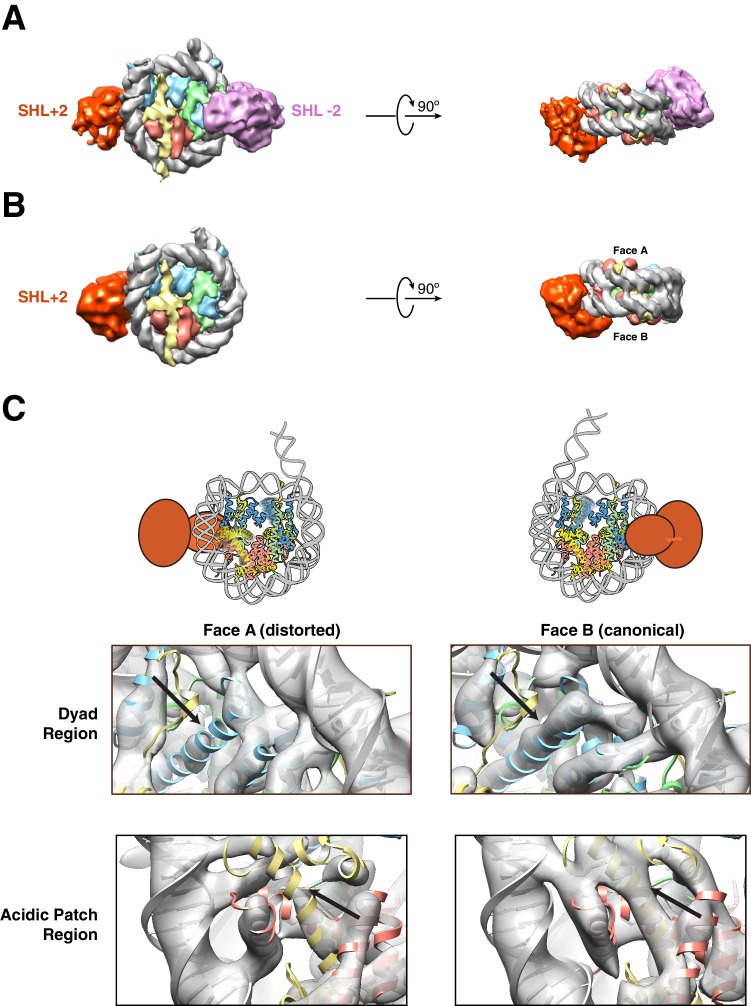
Figure 2.
Structures of SNF2h bound to a nucleosome with 60 bp of flanking DNA in the presence of ADP-BeF x and 70 mM KCl.
( Au2013C ) Cryo-EM density maps of SNF2h bound to the nucleosome recorded with a scintillator-based camera ( A ) Doubly bound SNF2h-nucleosome complex at 8.4 u00c5 resolution. ( B ) Singly bound SNF2...
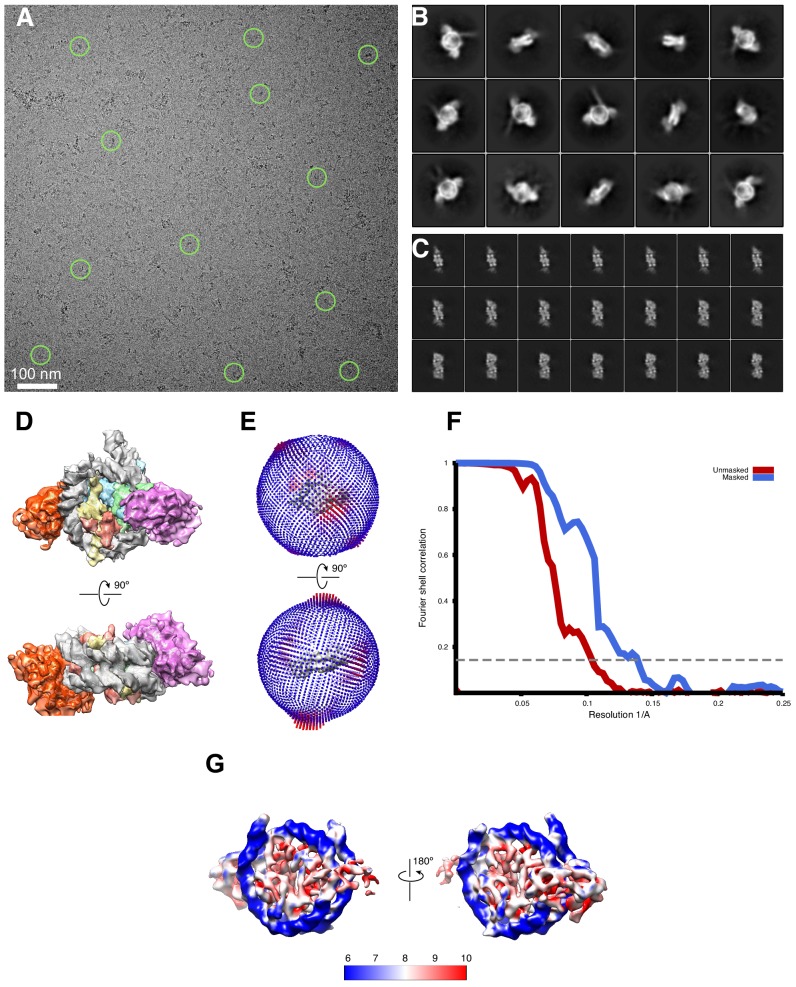
Figure 2u2014figure supplement 1.
Cryo-EM analysis of doubly bound SNF2h-nucleosome complexes obtained at 70 mM KCl.
( A ) A raw cryo-EM micrograph of doubly bound SNF2h-nucleosome complex recorded as described in Materials and Methods . ( B ) Typical 2D class averages of selected particles. The box size is 300 pixe...
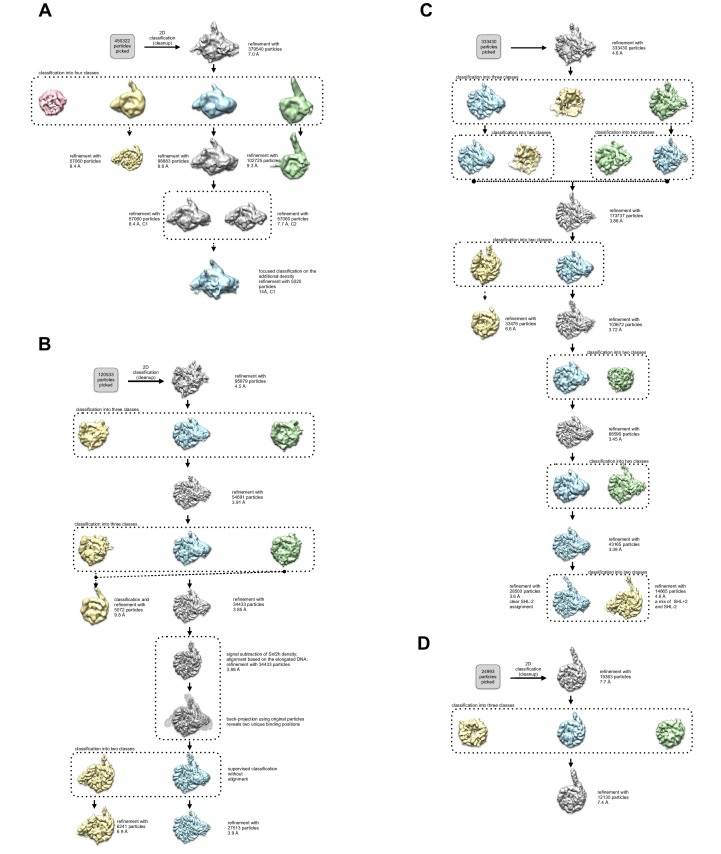
Figure 2u2014figure supplement 2.
3D Classification and refinement.
( Au2013B, D ). The flowchart of classification and refinement procedures using RELION and Cryosparc is shown.u00a0Following 1 round of 2D classification, each dataset was subjected to 3D refinement a...
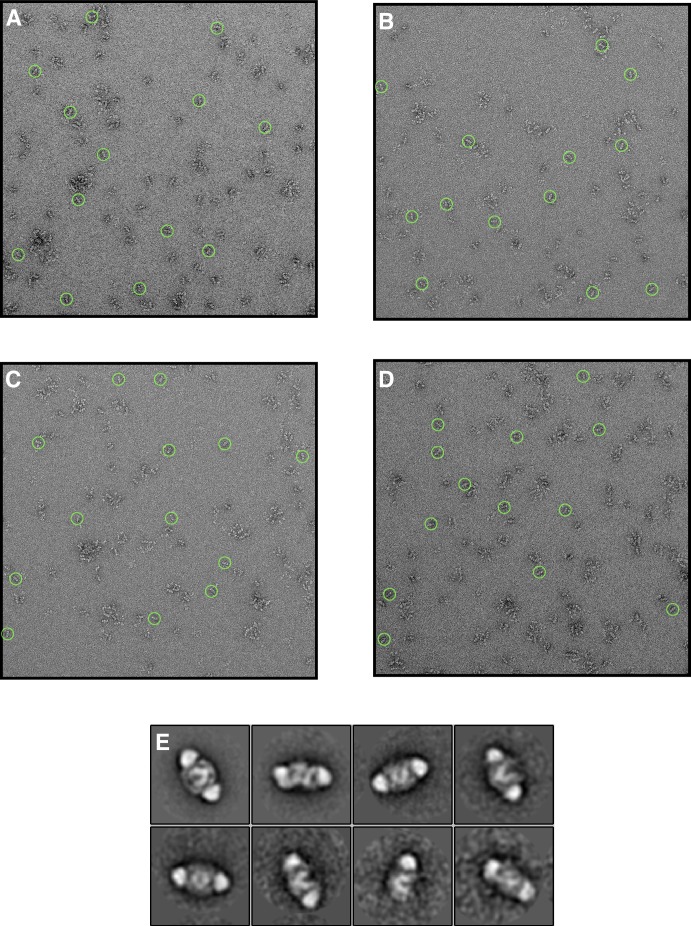
Figure 2u2014figure supplement 3.
Negative stain EM of SNF2h in the presence of ADP-BeF x and 140 mM KCl.
( Au2013D ) Raw micrographs of negatively stained sample performed under the same buffer conditions as the dataset in Figure 1 .u00a0Complexes were assembled identically to the high resolution EM cond...
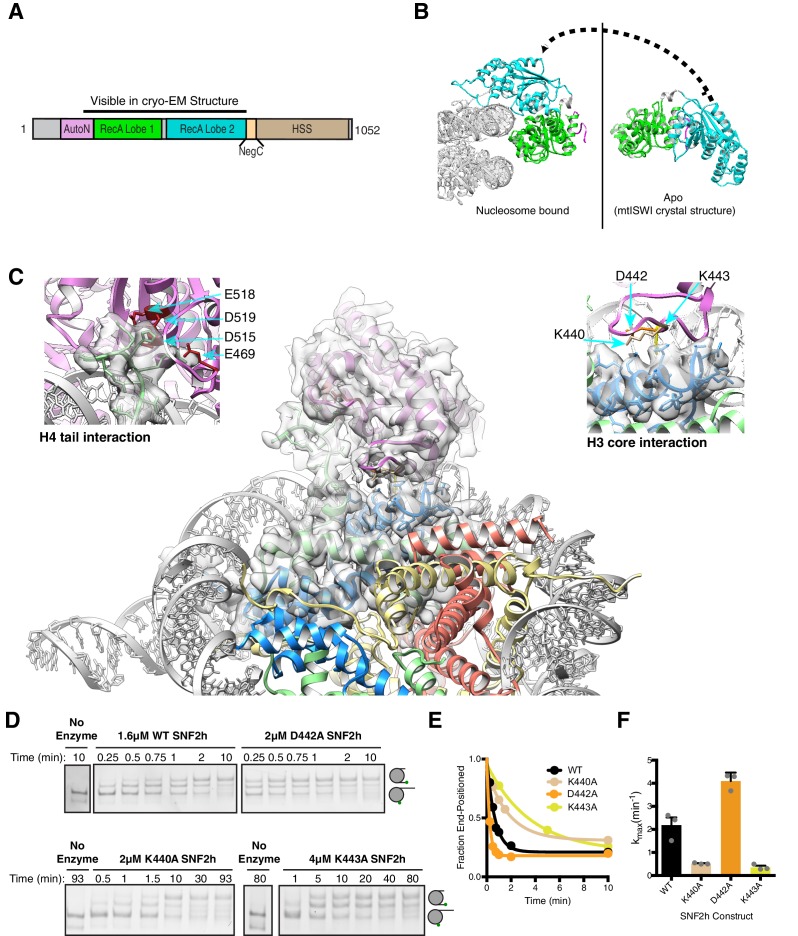
Figure 3.
Interactions of SNF2h with the histone proteins.
( A ) Domain diagram of SNF2h.u00a0( B ) Conformational changes in SNF2h associated with nucleosome binding. SNF2h is colored according to the domain diagram. The apo structure is the Myceliophtora th...
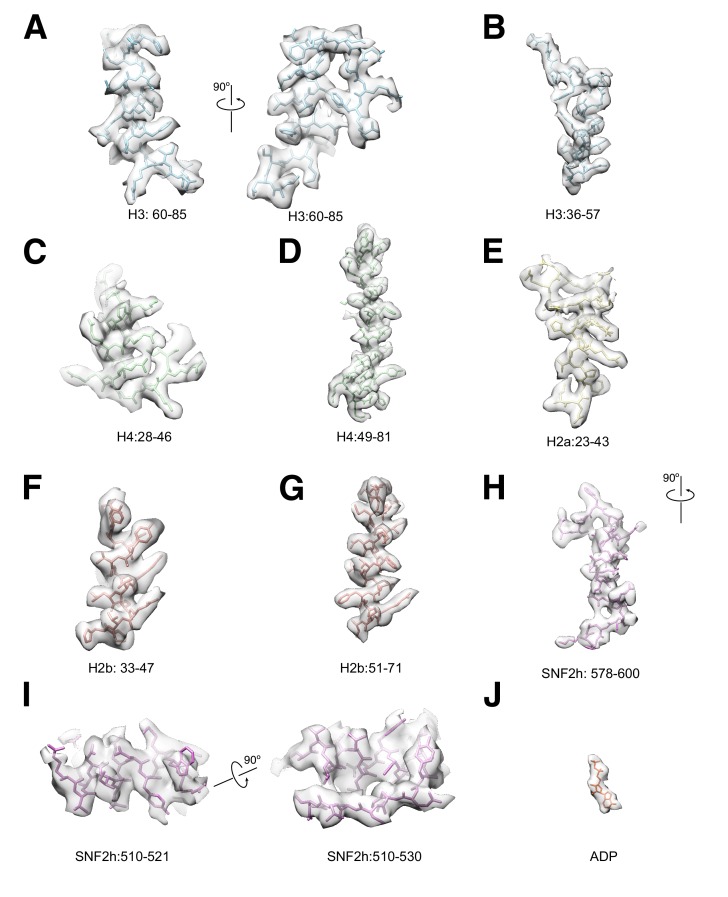
Figure 3u2014figure supplement 1.
Selected Cryo-EM protein densities.
Representative 3.4 u00c5 resolution cryo-EM densities of SNF2h and core histones superimposed on the atomic model.u00a0The density maps are shown as semi-transparent, and the model is colored accordin...
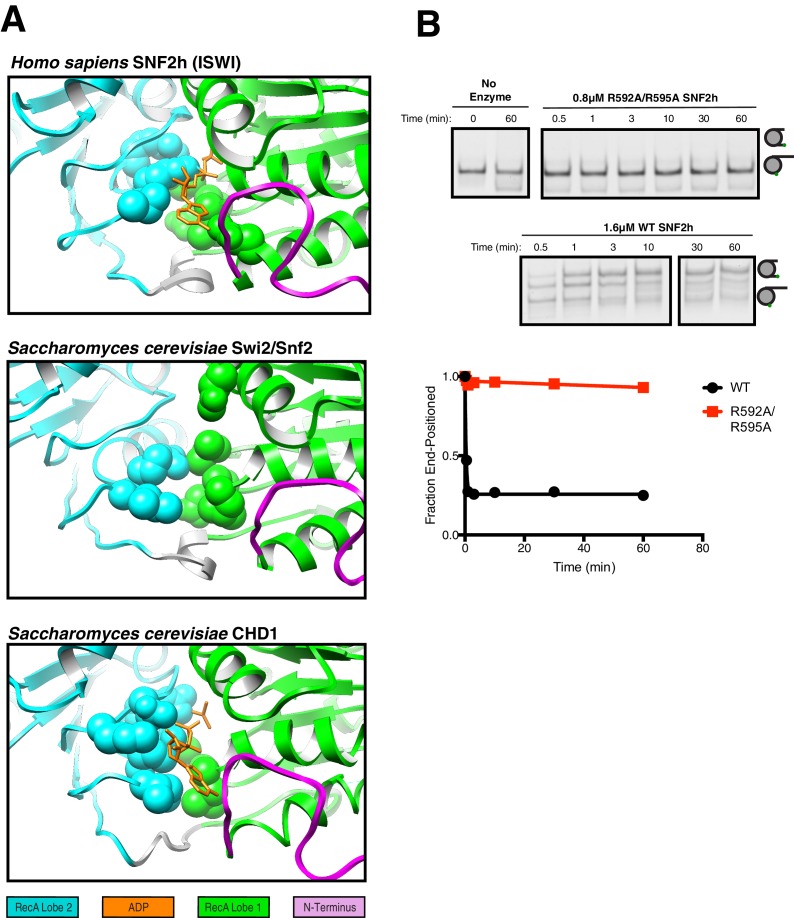
Figure 3u2014figure supplement 2.
Comparison of ATP-binding pockets of SNF2h with CHD1 and Swi2/Snf2 and functional validation of SNF2h ATP-binding pocket.
( A ) Top.u00a0Close up view of the SNF2h ATP-binding pocket from the 3.4 u00c5 structure with ADP fit in the canonical binding site. Middle. Close up view of the ATP-binding pocket from S. cerevisiae...
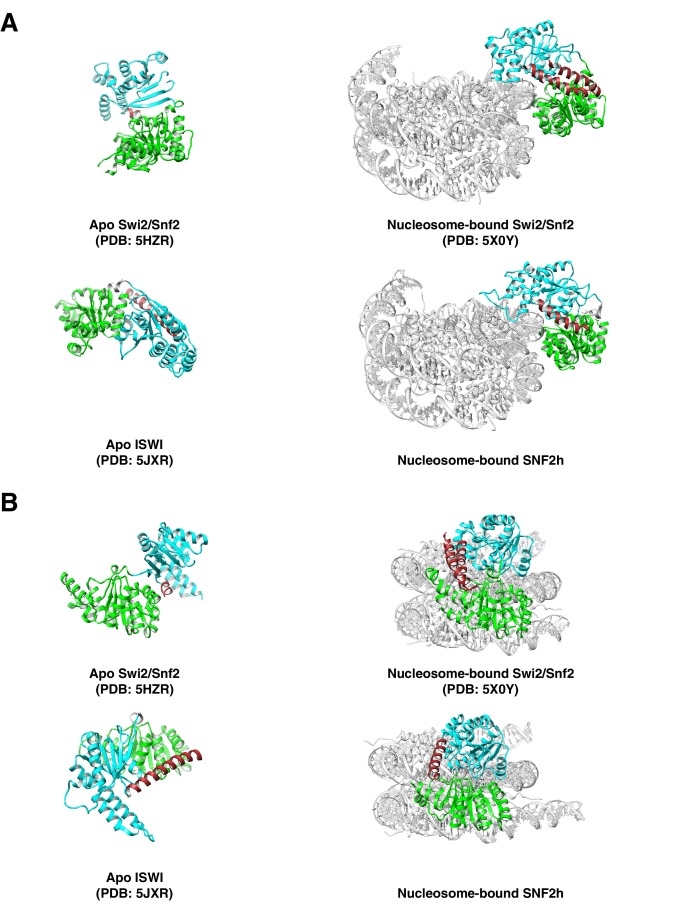
Figure 3u2014figure supplement 3.
Brace helix comparisons.
( A , B ).u00a0Comparison of bound and unbound conformations of Swi2/Snf2 (top A, ( B ) and ISWI (bottom A, ( B ) remodelers in two views.u00a0Left: Apo structures of Myceliophthora thermophila Swi2/S...
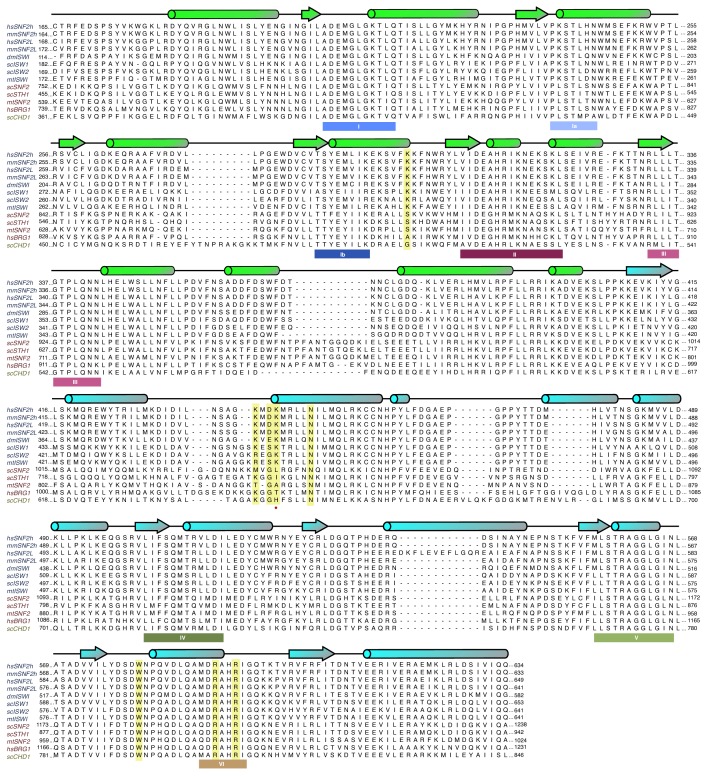
Figure 3u2014figure supplement 4.
Multiple sequence alignment of the ATPase domains of selected members of chromatin remodeling families.
Alignment of the ATPase domains of members of the ISWI (blue), SWI/SNF (red), and CHD families (yellow).u00a0Below the sequence, canonical SF2 nucleic acid helicase motifs are annotated ( Flaus et al....
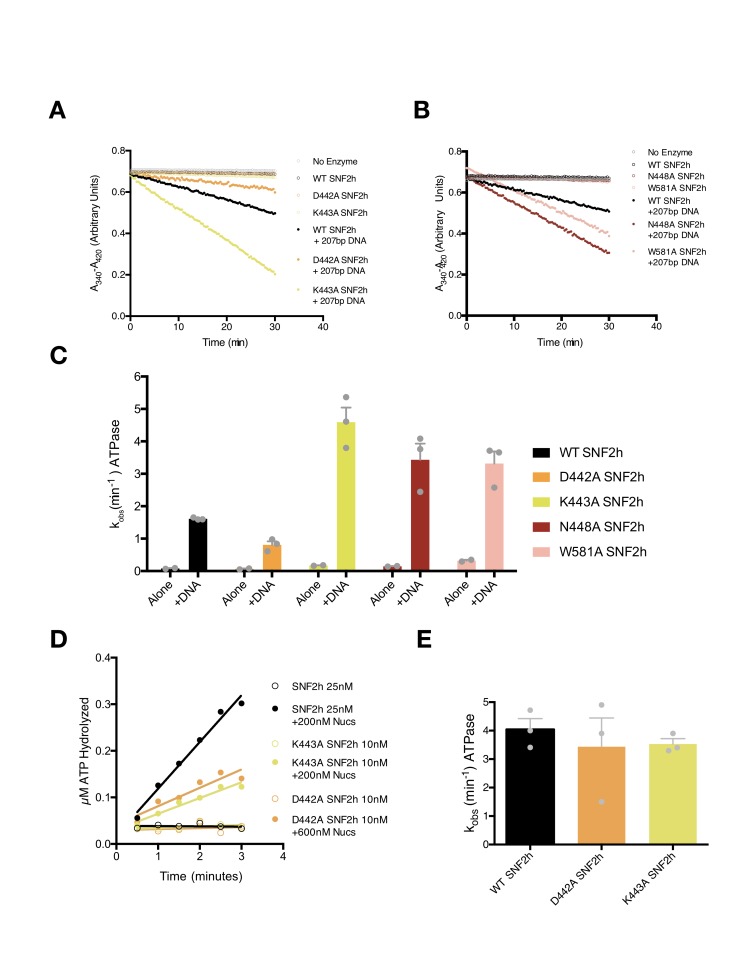
Figure 3u2014figure supplement 5.
ATPase activities of point mutants in this study.
( Au2013B ) Example absorbance plots of the NADH coupled ATPase assay to measure DNA-stimulated ATPase activity.u00a0Reactions were performed with 800 nM of the indicated SNF2h constructs either witho...
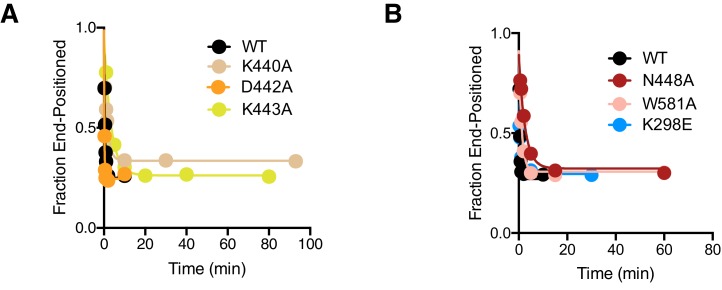
Figure 3u2014figure supplement 6.
Full fits of native gel remodeling assays.
Complete time courses from Figure 3D ( A ) and Figure 4B ( B ) shown with longer time points.
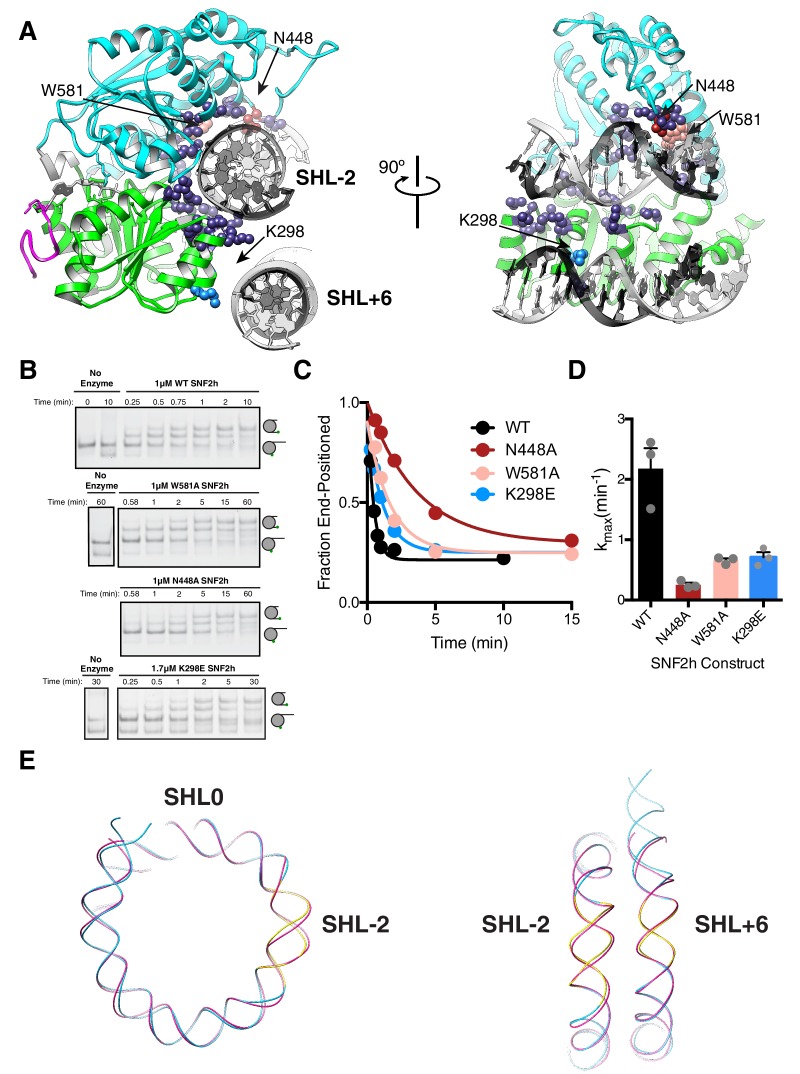
Figure 4.
DNA contacts in the SNF2h-Nucleosome structure.
( A ) SNF2h residues contacting the nucleosome are shown in spheres.u00a0In light blue is a contact with the second gyre near SHLu00a0+u00a06. In red, pink, and light blue are residues mutated in this...
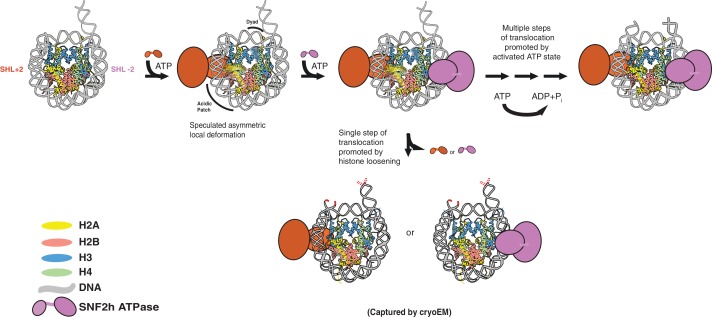
Figure 5.
Speculative model that places SNF2h-nucleosome Cryo-EM structures within SNF2h reaction cycle .
Two protomers of SNF2h bind to the nucleosome along with ATP.u00a0Based on previous work, the directionality of nucleosome sliding is determined by the motor that engages the longer flanking DNA ( Leo...
Figure images are served from the NIH/NLM PubMed Central Open Access Subset or Europe PMC; copyright remains with the publishers and authors.
💬 Discussion
0 commentsNo comments yet. Be the first to start a discussion!
Leave a Comment