Abstract
AbstractThe Cdc45-MCM-GINS (CMG) helicase unwinds DNA during the elongation step of eukaryotic genome duplication and this process depends on the MCM ATPase function. Whether CMG translocation occurs on single- or double-stranded DNA and how ATP hydrolysis drives DNA unwinding remain open questions. Here we use cryo-electron microscopy to describe two subnanometre resolution structures of the CMG helicase trapped on a DNA fork. In the predominant state, the ring-shaped C-terminal ATPase of MCM is compact and contacts single-stranded DNA, via a set of pre-sensor 1 hairpins that spiral around the translocation substrate. In the second state, the ATPase module is relaxed and apparently substrate free, while DNA intimately contacts the downstream amino-terminal tier of the MCM motor ring. These results, supported by single-molecule FRET measurements, lead us to suggest a replication fork unwinding mechanism whereby the N-terminal and AAA+ tiers of the MCM work in concert to translocate on single-stranded DNA.
🔬 Techniques
🧬 Organisms
💻 Software
✨ Fluorophores
🧪 Sample Preparation
🏭 Microscope Brands
🧪 Reagent Suppliers
💻 Software Details
💾 Data Repositories
🏛️ Research Organizations (ROR)
Affiliated research institutions:
📋 Methods
Purification of the CMG helicase pFastBac1 plasmids containing genes that encode the individual subunits of the CMG complex (a gift from Dr Michael R. Botchan) were used to produce bacmids, which were subsequently transfected into Sf9 cells using the Invitrogen Bac-to-Bac Baculovirus Expression System methods 6 . P3 baculoviruses used in protein expression experiments were freshly amplified from the P2 stocks for 5 days in 100 ml of Sf9 cells grown in 250 ml flasks in Graces medium supplemented with 10% FCS. The infections for protein purification were carried out by inoculating 4 l of Hi5 cells at 10 6 ml −1 with a multiplicity of infection of 5 by adding 200 ml of each virus stock at a titre 10 8 pfu ml −1 . Infected cells incubated for 72 h at 27 °C were harvested by centrifugation and washed with PBS+5 mM MgCl 2 . The following steps were performed either on ice or at 4 °C, unless indicated otherwise. The collected cells were resuspended in 200 ml of buffer C (25 mM Hepes pH 7.6, 0.02% Tween-20, 10% glycerol, 1 mM EDTA, 1 mM EGTA) supplemented with 15 mM KCl, 2 mM MgCl 2 , 0.4 mM phenylmethylsulfonyl fluoride, 2 mM 2-mercaptoethanol and the complete protease inhibitors cocktail from Roche Diagnostics. The cell suspension was snap frozen in 10 ml aliquots and stored at −80 °C. To purify CMG complexes from the extract, the infected cell suspension was thawed and cells were broken in a Dounce homogenizer. KCl was added to 100 mM and the extract was cleared by centrifugation at 14,000 r.p.m. in an Avanti J-26S XP centrifuge for 10 min. The cleared extract was incubated with 2 ml of anti-FLAG M2-agarose beads (Sigma-Aldrich) for 2–3 h with continuous end-over-end mixing. The beads were then collected in a 20-ml Poly-Prep disposable chromatography column (BioRad) and washed in 30 ml C-100 buffer (buffer C with 100 mM KCl and 1 mM dithiothreitol (DTT)) before transferring to a 10 ml column (BioRad). The column was washed twice with 5 ml C-100 buffer. Bound complexes were eluted with 200 μg ml −1 flag peptide in C-100 supplemented with complete protease inhibitor cocktail, the first elution step was performed in 5 ml of elution buffer for 15 min at room temperature with end-over-end mixing, then collecting the flowthrough and repeating the step with 4 ml of elution buffer for 10 min. Both fractions were pooled, cooled on ice and pumped through a Mono S HiTrap SP FF column equilibrated in C-100 buffer. The flowthrough and a further 4 ml of wash was collected and injected onto a MonoQ HR 5/5 column equilibrated in C-100 buffer 6 . The column was washed in 15 ml of C-100 and bound complexes were eluted with 20-ml 100–550 mM KCl gradient in buffer C supplemented with 1 mM DTT. Fractions (0.5 ml) were collected, the CMG peak fractions (eluted at 410–440 mM KCl) were diluted to 150 mM KCl in buffer C and injected onto a Mono Q PC 1.6/5 column connected to AKTAmicro purification system equilibrated in buffer D (25 mM Hepes pH 7.6, 1 mM EDTA, 1 mM EGTA, 1 mM DTT) supplemented with 150 mM KCl. Elution was performed using a 2-ml 150–550 mM KCl linear gradient in buffer D and 75 μl fractions were collected. The CMG peak fractions were pooled and dialysed for 16 h into buffer A (25 mM Hepes pH 7.6, 50 mM sodium acetate, 10 mM magnesium acetate, 1 mM DTT). The CMG preparation was supplemented with 1 mM ATP or treated as described in the ‘CMG–DNA complex reconstitution' section. Protein concentration was measured by using known MCM3 protein standards serving as a reference on a silver stain SDS–PAGE gel. A yield of 150 μl with a concentration of 1 μM was achieved.
Show full methods section
Purification of the CMG helicase pFastBac1 plasmids containing genes that encode the individual subunits of the CMG complex (a gift from Dr Michael R. Botchan) were used to produce bacmids, which were subsequently transfected into Sf9 cells using the Invitrogen Bac-to-Bac Baculovirus Expression System methods 6 . P3 baculoviruses used in protein expression experiments were freshly amplified from the P2 stocks for 5 days in 100 ml of Sf9 cells grown in 250 ml flasks in Graces medium supplemented with 10% FCS. The infections for protein purification were carried out by inoculating 4 l of Hi5 cells at 10 6 ml −1 with a multiplicity of infection of 5 by adding 200 ml of each virus stock at a titre 10 8 pfu ml −1 . Infected cells incubated for 72 h at 27 °C were harvested by centrifugation and washed with PBS+5 mM MgCl 2 . The following steps were performed either on ice or at 4 °C, unless indicated otherwise. The collected cells were resuspended in 200 ml of buffer C (25 mM Hepes pH 7.6, 0.02% Tween-20, 10% glycerol, 1 mM EDTA, 1 mM EGTA) supplemented with 15 mM KCl, 2 mM MgCl 2 , 0.4 mM phenylmethylsulfonyl fluoride, 2 mM 2-mercaptoethanol and the complete protease inhibitors cocktail from Roche Diagnostics. The cell suspension was snap frozen in 10 ml aliquots and stored at −80 °C. To purify CMG complexes from the extract, the infected cell suspension was thawed and cells were broken in a Dounce homogenizer. KCl was added to 100 mM and the extract was cleared by centrifugation at 14,000 r.p.m. in an Avanti J-26S XP centrifuge for 10 min. The cleared extract was incubated with 2 ml of anti-FLAG M2-agarose beads (Sigma-Aldrich) for 2–3 h with continuous end-over-end mixing. The beads were then collected in a 20-ml Poly-Prep disposable chromatography column (BioRad) and washed in 30 ml C-100 buffer (buffer C with 100 mM KCl and 1 mM dithiothreitol (DTT)) before transferring to a 10 ml column (BioRad). The column was washed twice with 5 ml C-100 buffer. Bound complexes were eluted with 200 μg ml −1 flag peptide in C-100 supplemented with complete protease inhibitor cocktail, the first elution step was performed in 5 ml of elution buffer for 15 min at room temperature with end-over-end mixing, then collecting the flowthrough and repeating the step with 4 ml of elution buffer for 10 min. Both fractions were pooled, cooled on ice and pumped through a Mono S HiTrap SP FF column equilibrated in C-100 buffer. The flowthrough and a further 4 ml of wash was collected and injected onto a MonoQ HR 5/5 column equilibrated in C-100 buffer 6 . The column was washed in 15 ml of C-100 and bound complexes were eluted with 20-ml 100–550 mM KCl gradient in buffer C supplemented with 1 mM DTT. Fractions (0.5 ml) were collected, the CMG peak fractions (eluted at 410–440 mM KCl) were diluted to 150 mM KCl in buffer C and injected onto a Mono Q PC 1.6/5 column connected to AKTAmicro purification system equilibrated in buffer D (25 mM Hepes pH 7.6, 1 mM EDTA, 1 mM EGTA, 1 mM DTT) supplemented with 150 mM KCl. Elution was performed using a 2-ml 150–550 mM KCl linear gradient in buffer D and 75 μl fractions were collected. The CMG peak fractions were pooled and dialysed for 16 h into buffer A (25 mM Hepes pH 7.6, 50 mM sodium acetate, 10 mM magnesium acetate, 1 mM DTT). The CMG preparation was supplemented with 1 mM ATP or treated as described in the ‘CMG–DNA complex reconstitution' section. Protein concentration was measured by using known MCM3 protein standards serving as a reference on a silver stain SDS–PAGE gel. A yield of 150 μl with a concentration of 1 μM was achieved.
Helicase assay
Assays were performed in 20 μl reactions contacting 25 mM Hepes pH 7.5, 75 mM NaCl, 0.5 mM ATP, 10 mM magnesium acetate, 1 mM DTT, 0.1 mg ml −1 BSA. Purified CMG (123 to 410 fmol) was incubated in the presence of 27 μM ATPγS and 1.8 pmol of [γ- 32 P]-ATP-labelled fork DNA substrate for 3 h at 30 °C, to allow for fork loading. Unwinding was induced by adding ATP to 7 mM for 5 min at 30 °C and stopped with 6 × stop buffer (150 mM Tris pH 8.0, 3% SDS, 120 mM EDTA). The unwinding product was separated using 8% PAGE in 0.1% SDS 1 × TBE. CMG–DNA complex reconstitution The oligonucleotides used for CMG–DNA reconstitution were synthesized by Integrated DNA Technology. Sequences of the two partially complementary oligos used are shown below: Leading strand template: 5′-CACTCGGGCTCGTTTTACAACGTCGTGACTGGGCACTTGATCGGCCAACCTTTTTTTTTTTTTTTTTTTTTTTTTTTTTTTTT TTTTTTT-3′ Lagging strand template: 5′-CTGGCGTCGGGTCGGCGGTTGGCCGAT CAAGTGCCCAGTCACGACGTTGTAA AACGAGCCCGAGTG-3′ When annealed together, this model replication fork contains a 50-bp double-stranded region with two single-stranded fork overhangs (16-nt on the 5′-end and 40-nt poly-T on the 3′-end, based on Petojevic et al. 12 ). Annealing of the two strands was performed by mixing each of the oligos in equimolar amounts, heating at 95 °C for 3 min and slow cooling to room temperature for 60 min. To reconstitute the nucleoprotein complex, forked DNA substrate was added to dialysed ∼300 nM CMG in a 2:1 molar ratio in the presence of 0.1 mM ATPγS (Sigma). The CMG–DNA–ATPγS mixture was left to incubate for 2 h at 30 °C, to allow for complex association before cryo-grid preparation.
Cryo-grid preparation and data collection for CMG–DNA
Four microlitres of reconstituted CMG–DNA assembly at 300 nM concentration were applied onto freshly glow-discharged Quantifoil 1.2/1.3 or C-flat 1/1 grids. After a 30-s incubation in 100% humidity, the Quantifoil grid was double-side blotted for 4 s using a Vitrobot (FEI) and plunged into liquid ethane. For the C-flat grid, the sample was incubated for 2 min and double-side blotted for 3 s in a Cp3 (Gatan, Inc.), operating at 90% humidity and plunged into liquid ethane. Cryo-grids were screened for ice quality using on a JEOL-2100 or a FEI Spirit LaB6 operated at 120 kV and equipped with an 4 k × 4 k or 2 k × 2 k Ultrascan charge-coupled device camera (Gatan, Inc.), respectively. Data were collected on a Tecnai F30 Polara electron microscope operated at 300 kV and equipped with a K2 Summit direct electron detector (Gatan, Inc.) and an energy filter in zero-loss mode (GIF Quantum, Gatan, Inc.). Twenty-five-frame movies (2,098) were manually collected, with a single frame duration of 0.4 ms. Movies were acquired using SerialEM, in single-electron counting mode with a total dose of 48 e − Å −2 and a −3.5 to 1.7 defocus range, at a constant nominal magnification of × 37,037, yielding a 1.35-Å pixel size. Cryo-grid preparation and data collection for ATP–CMG The ATP–CMG sample at 330 nM concentration was applied onto freshly glow-discharged open-holes Quantifoil 1.2/1.3. After 30 s incubation, grids were double-side blotted for 5 s in a Vitrobot (FEI) at 100% humidity and plunge frozen into liquefied ethane. Grids were loaded onto the LMB Cambridge Titan Krios electron microscope (FEI) operated at 300 kV for automated data collection with the EPU software (FEI). Images were recorded on a FEI Falcon II detector at a nominal magnification of × 47,000 (yielding a pixel size of 1.77 Å). An in-house built system described in ref. 51 was used to collect 17 frames per second. Five hundred and thirty-six movies of 51 frames were recorded using a −2 to −4 μm defocus range with an electron dose of 51 e − Å −2 .
CMG–DNA image processing
To correct for beam-induced drift, whole frame alignment and averaging was performed for each movie using MotionCorr ( http://cryoem.ucsf.edu/software/driftcorr.html ) 52 . Particles (340,573) were picked semi-automatically in EMAN2 (ref. 53 ). Contrast transfer function parameters were estimated using CTFFIND4 (ref. 54 ) and low-quality integrated movies were excluded. All further processing was performed in RELION 1.4 (ref. 55 ). Extracted particles were binned by 2, yielding a pixel size of 2.7 Å per pixel. Two-dimensional classification allowed for the isolation of a set of 60,287 high-quality CMG particles ( Supplementary Fig. 2 ). A first 3D refinement was performed using a 50-Å low-pass filtered compact ATP–CMG structure as a starting model, resulting in an initial 8.1 Å structure. Postprocessing (using automatically estimated B factor and an arbitrarily chosen mask) improved the resolution to 7.2 Å but resulted in a poorly defined ATPase tier ( Supplementary Fig. 2 ). To separate various ATPase conformers in the data set, the refined 3D volume was filtered to 50 Å and used as a model for 3D classification without particle alignment (ten classes). After excluding poor-quality classes, 2 structures were isolated, referred to as ‘compact ATPase' (38,792 particles; Supplementary Fig. 6 ) and ‘relaxed ATPase' (13,692 particles; Supplementary Fig. 7 , also refer to Figs 2 and 4 , and Supplementary Fig. 2 for comparisons). Each particle subset was separately refined and postprocessed, resulting in a 7.4-Å resolution structure (compact ATPase) and 9.8 Å (relaxed ATPase).
ATP–CMG image processing
Similar to the CMG–DNA data set, beam-induced drift was corrected and averaging was performed for each movie as described in ref. 52 . Contrast transfer function parameters were estimated using CTFFIND3 (ref. 56 ) and the best 471 out of 536 integrated movies were selected for particle picking in XMIPP3 (ref. 57 ) and subsequent processing in RELION 1.3 (ref. 55 ). Semi-manually picked particles (160,401) were 2D-classified, to get rid of bad particles, resulting in a clean data set containing 78,601 particles. A first ATP–CMG 3D volume was determined to 9.5 Å, using a 50-Å-filtered version of EMDB entry 2,772 as an initial model ( Supplementary Fig. 8 ). Using the 9.5-Å structure filtered to 50 Å, 3D classification was performed to identify four recognizable CMG classes 58 as the new, ‘3D-cleaned' data set. Using statistical movie processing 59 , an 8.3-Å reconstruction ( Supplementary Fig. 8 ) was then obtained from these merged (29,772) particles. As the resulting structure showed a disordered AAA+ motor domain, further focused 3D classification 55 58 was performed to identify different motor conformers. This resulted in two classes (compact ATPase, 5,111 particles and relaxed ATPase, 13,182 particles), which were independently refined and postprocessed as described above ( Supplementary Figs 8–10 ). Resolution estimation and model building Resolution of the obtained cryo-EM maps was estimated using the ‘gold-standard' Fourier Shell Correlation (FSC) method, using the 0.143 FSC criterion. Local resolution was estimated using ResMap 60 and visualized using UCSF Chimera 61 . Automated atomic docking was performed using UCSF Chimera and further model manipulation performed using The PyMOL Molecular Graphics System. The A and B–C domains of the NTD tier of the yeast Mcm2-7 structure (PDB entry 3JA8 (ref. 4 )) were docked as isolated rigid bodies. GINS (PDB entry 2Q9Q 18 ) and RecJ (PDB entry 1IR6 (ref. 20 )) were docked as rigid bodies. The C-terminal Psf1 domain GINS was modelled as described in ref. 19 . The AAA+–MCM domains were docked as six individual rigid bodies after docking of the cryo-EM MCM AAA+ tier (PDB entry 3JA8 (ref. 4 )). FSC to compare the CMG atomic models and the cryo-EM maps were computed using RELION 1.4 and visualized with the PDBe FSC server. Figures and Movies were generated using UCSF Chimera 61 .
Single-molecule FRET
DNA oligonucleotides were purchased from Operon and labelled with fluorescent dyes Cy3 and Cy5. Reactions were carried out using an amino-modified C6-dT oligonucleotide and a mono-reactive Cy3 or Cy5 dye (GE Healthcare). Labelling reactions were performed with 1 nmol of DNA in 44 μl of 100 mM sodium carbonate buffer pH 8.5 and 10 nmol of Cy3 or Cy5 dye dissolved in 7 μl of dimethyl sulfoxide. Reactions were performed overnight at room temperature. Reverse-phase HPLC purification was performed on an analytical C8-column (Sigma-Aldrich Supelco Discovery BIO wide pore C8, 25 cm × 4.6 mm × 5 μm), to separate labelled and unlabelled DNA; fractions containing labelled DNA were collected and stored at −20 °C in 10 mM Tris-HCl pH 8.0. DNA sequences are as follows; for the Cy3 strand 5′-Cy3-CGCGAGGAATGGATGTAGGG-biotin-3′ and for the Cy5 strand 5′-CCCTACATCCATTCCTCGCGTTTTTT (Cy5-T)(T) 65 -3′. Quartz slides and cover slips were prepared following established protocols 62 . Briefly, quartz slides and coverslips were passivated with methoxy-PEG-SVA ( M r =5,000, Laysan Bio, Inc.) containing 10% biotin-PEG-SVA ( M r =3,400, Laysan Bio, Inc.) in 100 mM sodium bicarbonate. Reaction chambers were first incubated with 0.2 mg ml −1 BSA (Sigma-Aldrich) in T50 buffer (10 mM Tris-HCl pH 7.0 and 50 mM NaCl) for 10 min. Next, BSA was washed with T50 buffer and neutravidin (0.2 mg ml −1 in T50 buffer) was injected and incubated for 10 min. Excess neutravidin was removed by washing with buffer E (25 mM Hepes pH 7.6, 50 mM sodium acetate, 10 mM magnesium acetate, 10% glycerol, 1 mM DTT and 2 mM Trolox). DNA was surface-immobilized by incubation for 10 min with an annealed biotinylated DNA duplex (25 pM). Excess DNA was then washed with imaging buffer containing the CMG protein (Buffer E supplemented with 50 μM ATPγS (Sigma-Aldrich) or ATP (Sigma-Aldrich), 7 nM CMG protein and an oxygen scavenging system containing 10 mM 3,4-dihydroxybenzoic acid (Sigma-Aldrich) and 120 nM protocatechuate dioxygenase (Sigma-Aldrich; the final concentration of protocatechuate dioxygenase is corrected for the presence of 40% stabilizer), to minimize dye photobleaching). DNA molecules were imaged on a home-built, prism-based total internal reflection fluorescence microscope. All single-molecule measurements were recorded at room temperature using continuous green excitation (532 nM laser) at ∼1.0 mW and 30 ms time resolution. Apparent FRET efficiencies were calculated as FRET= I A /( I D + I A ), where I A and I D are the acceptor and donor intensities, respectively. Acceptor intensity ( I A ) was corrected for donor emission in the acceptor channel (11%), no direct excitation of the acceptor was observed.
Supplementary Material Supplementary Figures Supplementary Figures 1-14 Supplementary Movie 1 N-terminal view of the DNA interacting collar as it transitions from the Mcm2-7 to the CMG configuration. Supplementary Movie 2 Cross sections through the relaxed and compact ATP-CMG and ATPγS-CMG-DNA maps. Supplementary Movie 3 Cut-through views of the relaxed and compact ATP-CMG and ATPγS-CMG-DNA structures. Structures are viewed from the AAA+ (top) to the N-terminal domain (bottom). Supplementary Movie 4 Interpolation between the two relaxed and compact ATP-CMG states.
📊 Figures
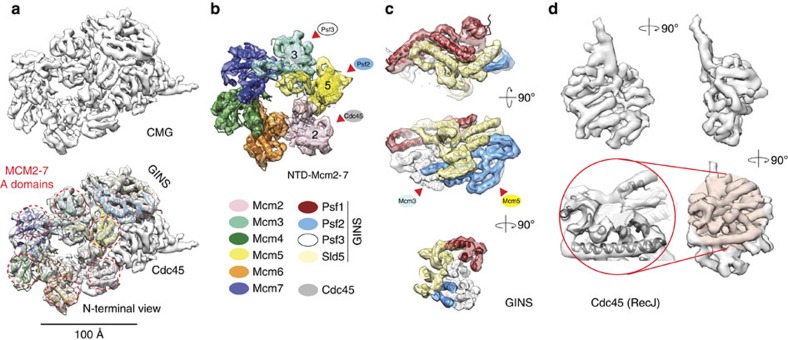
Figure 1
CMG helicase structure at subnanometre resolution.
( a ) Resolution density (7.4u2009u00c5) map of the CMG viewed from the MCM N-terminal face, without or with docked MCM and GINS atomic structures. ( b ) Detailed view of the MCM N-terminal DNA-intera...
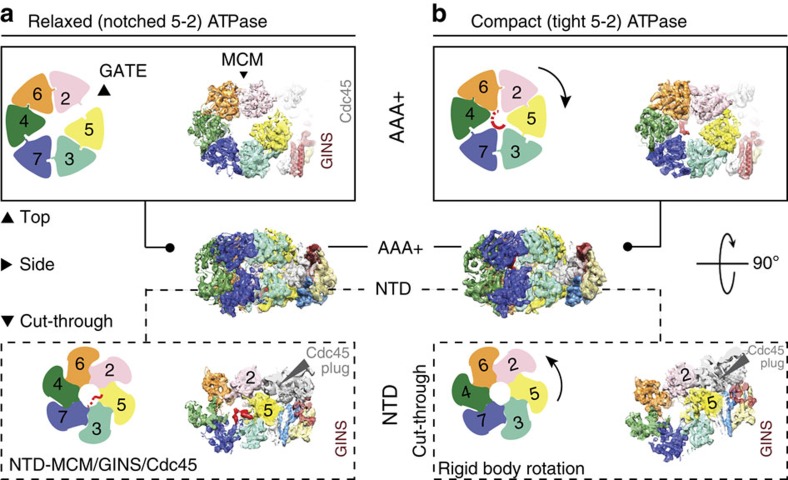
Figure 2
Two configurations in the ATPu03b3Su2013CMGu2013DNA complex.
( a ) AAA+, side and cut-through view of the CMG in a relaxed ATPase configuration. Cdc45 topologically locks the Mcm5-2 gate. ( b ) AAA+, side and cut-through N-terminal view of the CMG in a compact ...
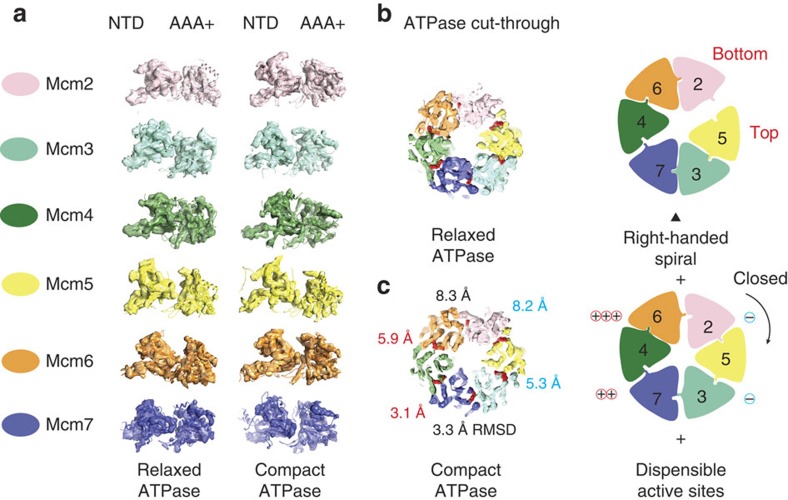
Figure 3
The MCM ATPase centres.
( a ) Segmented density and docked atomic structures of the six Mcm2-7 protomers in the two conformers. The NTD and AAA+ domains tilt and rock with respect to one another. ( b ) ATPase sites in the re...
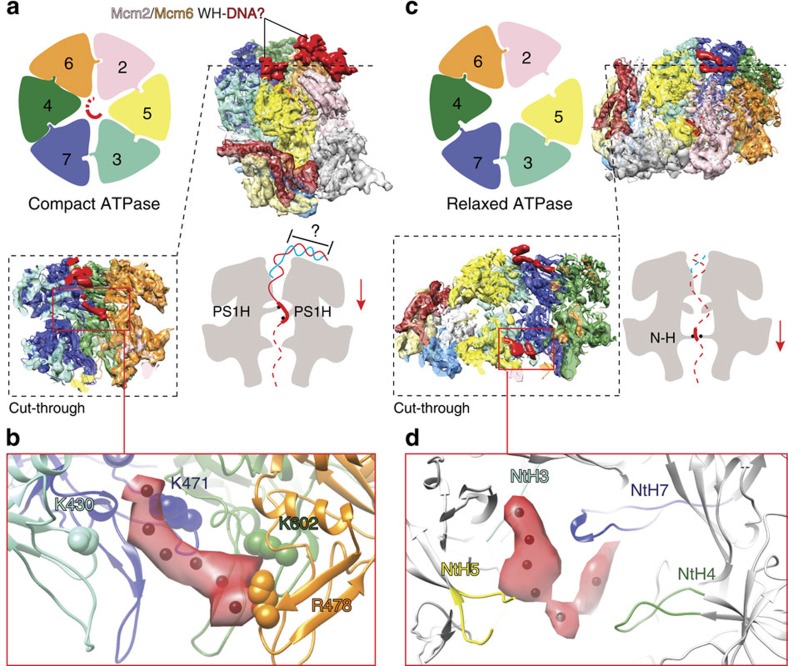
Figure 4
DNA-bound form of the CMG helicase.
( a ) The compact ATPase form contains rod-shaped, bent density features surmounting the ATPase face tentatively assigned to duplex DNA engaged by the MCM winged helix (WH) C-terminal extensions. An M...
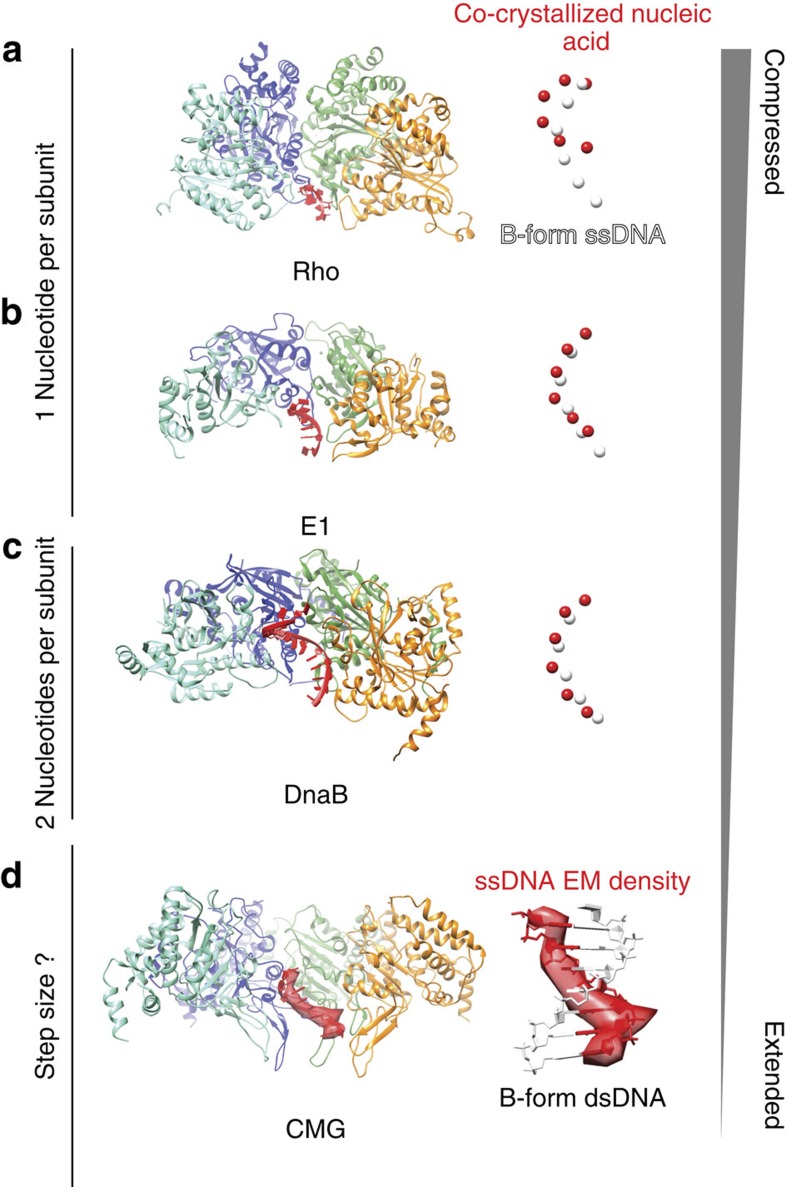
Figure 5
Comparison of the ATPu03b3Su2013CMGu2013DNA structure with available helicaseu2013nucleic acid assemblies.
( a ) The Rho termination factor (PDB entry 3ICE) contacts and compresses single-stranded RNA. The RNA structure is compared with one single DNA strand extracted from a B-form double helix. Spheres re...
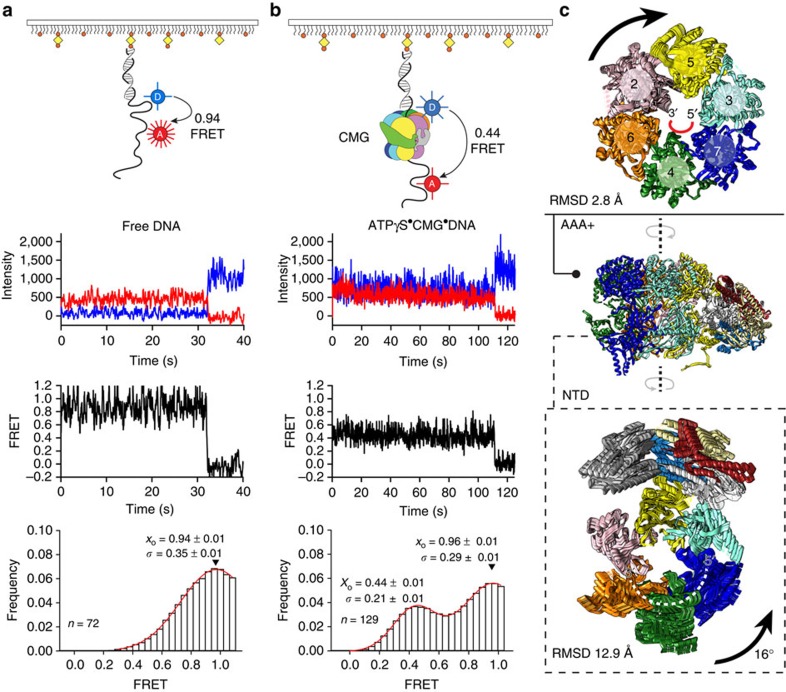
Figure 6
DNA engagement and deformation by the CMG helicase.
Single-molecule FRET analysis of ( a ) isolated DNA and ( b ) DNA+ATPu03b3S CMG. Top to bottom: cartoon schematic of the single-molecule FRET experiment indicating FRET between Cy3 (Donor, blue sphere...
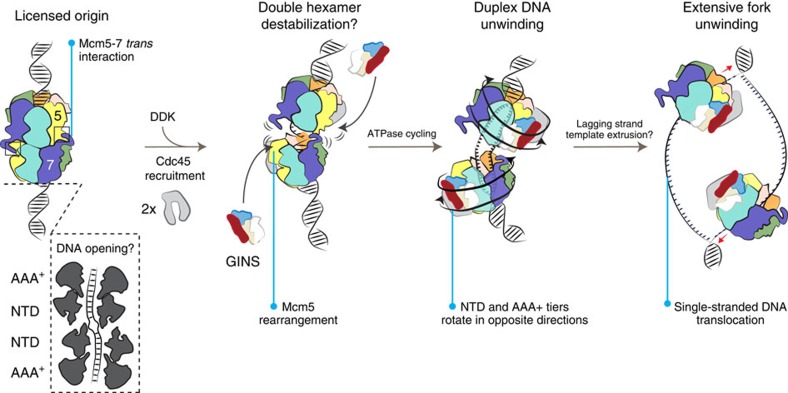
Figure 7
Origin activation and replication fork unwinding by the CMG helicase.
Origin licensing involves the loading of a head-to-head double hexameric ring that encircles duplex DNA, which might become partially deformed. Cdc45 is loaded onto the double hexamer, in a process th...
Figure images are served from the NIH/NLM PubMed Central Open Access Subset or Europe PMC; copyright remains with the publishers and authors.
💬 Discussion
0 commentsNo comments yet. Be the first to start a discussion!
Leave a Comment