Abstract
The RNA-guided Cas9 endonuclease from Streptococcus pyogenes is a single-turnover enzyme that displays a stable product state after double-stranded-DNA cleavage. Here, we present cryo-EM structures of precatalytic, postcatalytic and product states of the active Cas9-sgRNA-DNA complex in the presence of Mg2+. In the precatalytic state, Cas9 adopts the 'checkpoint' conformation with the HNH nuclease domain positioned far away from the DNA. Transition to the postcatalytic state involves a dramatic ~34-Å swing of the HNH domain and disorder of the REC2 recognition domain. The postcatalytic state captures the cleaved substrate bound to the catalytically competent HNH active site. In the product state, the HNH domain is disordered, REC2 returns to the precatalytic conformation, and additional interactions of REC3 and RuvC with nucleic acids are formed. The coupled domain motions and interactions between the enzyme and the RNA-DNA hybrid provide new insights into the mechanism of genome editing by Cas9.
🔬 Techniques
🔭 Microscopes
🧬 Organisms
💻 Software
🧪 Sample Preparation
🔬 Cell Lines
🏭 Microscope Brands
🧪 Reagent Suppliers
💻 Software Details
💾 Data Repositories
🏛️ Research Organizations (ROR)
Affiliated research institutions:
📋 Methods
On-line Methods
Substrate preparation. The 40 base-pair double-stranded DNA (dsDNA) substrate was constructed from two single-stranded DNA (ssDNA) oligonucleotides ordered from IDT: Target strand 5’-CCAGTGCGTAGGCGCATAAAGATGAGACGCTGGCGATTAG-3’ Non-target strand 5’-CTAATCGCCAGCGTCTCATCTTTATGCGCCTACGCACTGG-3’ Oligonucleotides were hydrated in water to a final concentration of 100 mM and mixed at a 1:1 ratio. After heating to +95 °C, the dsDNA sample was cooled to +25 °C in 1 °C/min intervals. RNA preparation. The sgRNA spacer sequence containing BsmBI compatible ends (lower case nucleotide letters) was cloned into the DR274 (Addgene #57048) plasmid upstream of the 80 nucleotide sgRNA scaffold using the following primers ordered from IDT: Forward 5’-taggGGCGCATAAAGATGAGACGC-3’ Reverse 5’-aaacGCGTCTCATCTTTATGCGCC-3’ To generate the template DNA for in vitro transcription, a large-scale PCR amplification starting from the T7 promoter to the end of the sgRNA scaffold was performed on the sgRNA containing plasmid using the following set of PCR primers: Forward 5’-TAATACGACTCACTATAGG-3’ Reverse 5’-GCAAGCACCGACTCGGT-3’ PCR reactions were completed using Phusion DNA polymerase, Phusion HF buffer (NEB) and the following thermocycling conditions: initial denaturation at +98 °C for 30 s; 30 cycles of denaturation at +98 °C for 5 s, annealing at +64 °C for 10 s and elongation at +72 °C for 15 s; the final elongation at +72 °C for 5 min. The PCR products were column purified (Zymo DNA clean and concentrator) and eluted to a final volume of 100 μL. To generate the RNA transcript, a 20 mL transcription reaction was performed in the presence of 100 μL of purified PCR product, 5.0 μg/mL purified recombinant T7 RNA Polymerase, and 1x transcription buffer (40mM Tris-HCl pH 8.0, 2mM spermidine, 10mM MgCl 2 , 5mM dithiothreitol (DTT), 2.5mM rNTPs). Following incubation at +37 °C for 4 h, reactions were spun at 5,000 × g for 20 min to pellet and remove the pyrophosphate precipitate. The filtered transcription reaction was loaded onto a Resource-Q column (HiLoad 16/60 Superdex 200, GE Healthcare) and purified over a linear NaCl gradient (0.4-0.7 M) in 20 mM Tris-HCl, pH 8.0. The sgRNA was then separated by gel filtration on a S200 Superdex size-exclusion column (GE Healthcare) equilibrated with 20 mM Tris-HCl, pH 8.0, and 150 mM NaCl. The eluted sgRNA was concentrated to ~2 mg/mL, flash-frozen, and stored at −80 °C until use. Cas9 expression and purification. Recombinant wild-type Streptococcus pyogenes Cas9 (Cas9) possessing an N-terminal His 6 -MBP tag (Addgene #39312) was expressed in Escherichia coli strain Rosetta2 (DE3) (Novagen) and purified as described previously 27 . Briefly, when cells reached an OD 600 of ~0.6, isopropyl β-D-1-thiogalactopyranoside (IPTG) was added to a final concentration of 0.2 mM to induce protein expression. Cells were then grown for an additional 18-20 h at +18 °C. Harvested cells were resuspended in 5 mL/g pellet of lysis buffer (20 mM Tris pH 8.0, 250 mM NaCl, 10% (v/v) glycerol, and 3 mM β-mercaptoethanol) containing an EDTA-free protease inhibitor tablet (Roche). The cell suspension was sonicated on ice and clarified by centrifugation at 27,000 × g for 45 min. The soluble lysate fraction was loaded onto a nickel-charged His-Trap FF crude column (GE Healthcare). The His 6 -MBP-Cas9 eluted from the column with lysis buffer supplemented with 250 mM imidazole. The His 6 -MBP tag was removed by overnight TEV cleavage (1 mg of TEV protease was added per 50 mg of protein). For cleavage, the Ni 2+ eluate was diluted to ~1 mg/mL in dialysis buffer (20 mM HEPES-KOH, pH 7.5, 150 mM KCl, 10% (v/v) glycerol, and 1 mM DTT) and dialyzed against dialysis buffer overnight at +4 °C. Following the His 6 -tag removal, Cas9 was loaded onto a SP Sepharose High Performance cation exchange column (HiTrap SP HP, GE Healthcare) and eluted in 100-500 mM gradient of KCl. Finally, the Cas9 protein storage buffer was exchanged by dialysis into 30 mM Tris-HCl pH 8.0, 200 mM NaCl, 20 mM EDTA, 10% (v/v) glycerol and 5 mM DTT. The final Cas9 sample was concentrated to ~10 mg/mL, filtered through 0.22 μm filter, aliquoted, flash-frozen in liquid nitrogen, and stored at −80 °C. Reconstitution of the Cas9-sgRNA-DNA ternary complex. Reconstitution of the Cas9-sgRNA-DNA was carried out by adding substrate dsDNA to a pre-formed the Cas9-sgRNA binary complex. Purified sgRNA was heated to +94 °C for 4 min and then cooled at room temperature to promote proper secondary structure formation. Cas9 and sgRNA were mixed in a 1:1.5 molar ratio and incubated for 10 min at room temperature before adding substrate dsDNA to bring the final molar ratio of ternary complex components Cas9, sgRNA, and dsDNA to 1:1.5:2.0. The ternary complex was diluted in Cas9 complex ‘storage’ buffer (30 mM Tris-HCl pH 7.5, 200 mM NaCl, 20 mM EDTA, 10% glycerol and 5 mM DTT) to final concentration of ~0.5 mg/mL. To initiate nuclease activity, MgCl 2 was added to the ternary complex to a final concentration of 40 mM. Following incubation at +37 °C for 30 min, samples were flash-frozen in liquid nitrogen. Electromobility shift assays, SDS-PAGE, and TBE-urea analyses of Cas9 activity and stability. To assess Cas9 activity and the stability of the ternary complex in the complex storage buffer over time, the ternary complex was formed using 1:1.5:1.5 molar ratio of Cas9-sgRNA-DNA. Aliquots of the ternary complex were taken at 0, 1, 5, 30, 240 and 960 min after DNA addition and subjected to several analyses. Briefly, 2.6 mL of the master mix (i.e. the complex storage buffer containing 40mM MgCl 2 ) was prepared and kept on ice. The sgRNA was heated at +94 °C for 3 min, allowed to cool to room temperature, and then added to the master mix to a final concentration of 600 nM. Cas9 was then added to a final concentration of 400 nM and incubated for 5 min before the addition of the substrate DNA to a final concentration of 600 nM. Subsequently, 12 150 μl aliquots (i.e. 6 duplicate timepoints) were distributed into a 96-well plate that was pre-chilled on ice. 25 μl of 0.5 M EDTA was added to the first 2 reactions to inhibit DNA cleavage for the 0 min timepoint. The plate was then transferred to a +37 °C heated block and EDTA was simultaneously added to two samples corresponding to each timepoint. To assess stability of the Cas9 protein over time, 22.5 μL of the ternary complex from each timepoint was mixed with 7.5 μL of 4x SDS-polyacrylamide gel electrophoresis (PAGE) loading buffer, heated for 5 min at +95 °C, and loaded onto a 4-20% precast SDS-PA gel (Bio-Rad). The gel was stained with Coomassie Brilliant Blue R-250 to visualize Cas9. After the addition of EDTA, one of the samples was subjected to RNase A (Invitrogen) and proteinase K (Life Technologies) treatments for 60 and for 30 min, respectively, at +37 °C. After treatments, samples were flash-frozen and kept at −80 °C until further use. RNase A and proteinase K treatments allow for analysis of free and Cas9-bound DNA at each timepoint and ensure the visualization of cleaved DNA products. To visualize the ternary complex stability and DNA cleavage levels, samples were subjected to electromobility shift assays (EMSA) on a native TBE-PA gel. Briefly, 18 μl of both untreated and RNaseA/proteinase K-treated samples corresponding to each time point was mixed with 2 μl of 5x Novex Hi-Density TBE sample buffer (Thermo Fisher) and then immediately loaded onto an 8% 0.5x TBE-PA gel. To prevent cleaved DNA from running off the gel, electrophoresis was run until the bromophenol dye front reached 3/4 of the gel. The gel was first stained in ethidium bromide (0.05 μg/mL) and then in Coomassie Brilliant Blue R-250 to visualize nucleic acids (i.e. DNA and sgRNA) and Cas9 on the same gel. To assess kinetics of DNA cleavage, 20 μL of untreated and RNaseA/proteinase K-treated sample corresponding to each time point was mixed with 20 μL of 2x Novex TBE-urea sample buffer (Thermo Fisher), heated at +95 °C for 3 min, and loaded onto a 15% TBE-urea PA gel. To visualize the nucleic acid species, the gels were stained with 0.05 μg/mL ethidium bromide solution for 10 min. Control samples contained 400 nM Cas9, 600 nM sgRNA, or 600 nM DNA only in the complex storage buffer. All gels were imaged on the GL212 Pro Imager (Carestream) using UV transillumination for ethidium bromide staining and white light trans-illumination for Coomassie staining. Cryo-EM grid preparation and data collection. The Cas9-sgRNA-DNA ternary complex sample (0.5 mg/mL) was concentrated to a volume of ~ 1.8 mL and then vitrified. A volume of 2.8 μl of the sample was applied to Cu R1.2/1.3, 300 mesh holey carbon grids (Quantifoil) plasma cleaned using H 2 /O 2 gas mixture for 5 s in a Solarus plasma cleaner (Gatan Inc.) operating at 50 W. The sample was allowed to adsorb for 2 s prior to blotting for 6 s, followed by plunge freezing into liquid ethane cooled at liquid N 2 temperature with a Leica EM GP (Leica Microsystems Inc.) and operating at +20 °C and 90% humidity. Cryo-EM grids were imaged using a Titan Krios transmission electron microscope (FEI Company), operated at 300 kV and aligned for parallel illumination, with the specimen maintained at liquid nitrogen temperatures ( Table 1 ). Images were recorded on a K2 Summit camera equipped with the XP sensor (Gatan Inc., Pleasanton, CA) operated in super-resolution counting mode, placed at the end of a GIF Quantum Energy Filter (Gatan Inc., Pleasanton, CA), operating in zero-energy-loss mode with a slit width of 20 eV. Images were typically collected with a defocus range between −0.7 to −3.0 μm at a nominal magnification of 165,000x corresponding to a super-resolution pixel size of 0.418 Å. A total of 2405 micrographs were collected using automated data acquisition in Latitude software (Gatan Inc., Pleasanton, CA) as a 70-frame movie with intermediate frames recorded every 0.2 s. The dose rate used was ~5.2 e − /Å 2 ·s (at the specimen plane) with a total exposure time of 14 s, giving an accumulated dose of ~73 e − /Å 2 ·s per micrograph. Image processing. All image processing was performed within RELION 3.0-beta-2 28 unless stated otherwise. Two batches of movies were first motion-corrected and dose-weighted separately using MotionCor2 29 . Then all aligned micrographs were merged and processed together. About 1.3 million particles were picked by Gautomatch and cleaned by 2D classification. An initial model was generated from cleaned particle stack and used as reference in 3D classification. Particles corresponding to the best class showing high-resolution features were then re-extracted with a box size of 608 and a binning factor of 2. Local 3D refinement was performed, followed by CTF refinement and Bayesian polishing. The refined particles were further classified into 6 classes with mask. For the final reconstruction, particles of each class were subjected to homogeneous refinement in cryoSPARC 30 . The overall resolutions were estimated based on the gold-standard criterion of Fourier shell correlation (FSC) = 0.143. Local resolutions were estimated from two half maps in cryoSPARC. Fourier shell correlation was calculated with Mtriage in Phenix 31 . Model building and refinement. Initial models for all three states were derived from the high-resolution crystal structures of Cas9-sgRNA-DNA complexes (PDB ID 5B2R, 5F9R and 4UN3). Each domain was fitted into electron density maps and adjusted manually in Coot 32 . For the active site of state II, corresponding residues from the homing endonuclease I-HmuI (PDB ID 1U3E) were used as starting point. For the additional PAM-distal DNA duplex in state II and III, an ideal B-form DNA duplex was docked into the density. Final structures were refined using crystal structures as reference in Phenix 31 . Final models were validated with statistics from Ramachandran plots, MolProbity scores, and EMRinger scores ( Table 1 ). Reporting Summary Statement: Further information on experimental design is available in the Nature Research Reporting Summary linked to this article. Data Availability Statement: All data needed to assess and evaluate the conclusions in the paper are available in the main text and Supplementary Information. The coordinates and electron density maps are deposited in the Protein Data Bank and EMDB with the following accession numbers: 6O0Z and 0585 for pre-catalytic complex (state I), 6O0Y and 0584 for post-catalytic complex (state II), and 6O0X and 0583 for product complex (state III). Source data for Supplementary Fig. 3 are available with the paper on-line. All other data are available upon request.
Show full methods section
On-line Methods
Substrate preparation. The 40 base-pair double-stranded DNA (dsDNA) substrate was constructed from two single-stranded DNA (ssDNA) oligonucleotides ordered from IDT: Target strand 5’-CCAGTGCGTAGGCGCATAAAGATGAGACGCTGGCGATTAG-3’ Non-target strand 5’-CTAATCGCCAGCGTCTCATCTTTATGCGCCTACGCACTGG-3’ Oligonucleotides were hydrated in water to a final concentration of 100 mM and mixed at a 1:1 ratio. After heating to +95 °C, the dsDNA sample was cooled to +25 °C in 1 °C/min intervals. RNA preparation. The sgRNA spacer sequence containing BsmBI compatible ends (lower case nucleotide letters) was cloned into the DR274 (Addgene #57048) plasmid upstream of the 80 nucleotide sgRNA scaffold using the following primers ordered from IDT: Forward 5’-taggGGCGCATAAAGATGAGACGC-3’ Reverse 5’-aaacGCGTCTCATCTTTATGCGCC-3’ To generate the template DNA for in vitro transcription, a large-scale PCR amplification starting from the T7 promoter to the end of the sgRNA scaffold was performed on the sgRNA containing plasmid using the following set of PCR primers: Forward 5’-TAATACGACTCACTATAGG-3’ Reverse 5’-GCAAGCACCGACTCGGT-3’ PCR reactions were completed using Phusion DNA polymerase, Phusion HF buffer (NEB) and the following thermocycling conditions: initial denaturation at +98 °C for 30 s; 30 cycles of denaturation at +98 °C for 5 s, annealing at +64 °C for 10 s and elongation at +72 °C for 15 s; the final elongation at +72 °C for 5 min. The PCR products were column purified (Zymo DNA clean and concentrator) and eluted to a final volume of 100 μL. To generate the RNA transcript, a 20 mL transcription reaction was performed in the presence of 100 μL of purified PCR product, 5.0 μg/mL purified recombinant T7 RNA Polymerase, and 1x transcription buffer (40mM Tris-HCl pH 8.0, 2mM spermidine, 10mM MgCl 2 , 5mM dithiothreitol (DTT), 2.5mM rNTPs). Following incubation at +37 °C for 4 h, reactions were spun at 5,000 × g for 20 min to pellet and remove the pyrophosphate precipitate. The filtered transcription reaction was loaded onto a Resource-Q column (HiLoad 16/60 Superdex 200, GE Healthcare) and purified over a linear NaCl gradient (0.4-0.7 M) in 20 mM Tris-HCl, pH 8.0. The sgRNA was then separated by gel filtration on a S200 Superdex size-exclusion column (GE Healthcare) equilibrated with 20 mM Tris-HCl, pH 8.0, and 150 mM NaCl. The eluted sgRNA was concentrated to ~2 mg/mL, flash-frozen, and stored at −80 °C until use. Cas9 expression and purification. Recombinant wild-type Streptococcus pyogenes Cas9 (Cas9) possessing an N-terminal His 6 -MBP tag (Addgene #39312) was expressed in Escherichia coli strain Rosetta2 (DE3) (Novagen) and purified as described previously 27 . Briefly, when cells reached an OD 600 of ~0.6, isopropyl β-D-1-thiogalactopyranoside (IPTG) was added to a final concentration of 0.2 mM to induce protein expression. Cells were then grown for an additional 18-20 h at +18 °C. Harvested cells were resuspended in 5 mL/g pellet of lysis buffer (20 mM Tris pH 8.0, 250 mM NaCl, 10% (v/v) glycerol, and 3 mM β-mercaptoethanol) containing an EDTA-free protease inhibitor tablet (Roche). The cell suspension was sonicated on ice and clarified by centrifugation at 27,000 × g for 45 min. The soluble lysate fraction was loaded onto a nickel-charged His-Trap FF crude column (GE Healthcare). The His 6 -MBP-Cas9 eluted from the column with lysis buffer supplemented with 250 mM imidazole. The His 6 -MBP tag was removed by overnight TEV cleavage (1 mg of TEV protease was added per 50 mg of protein). For cleavage, the Ni 2+ eluate was diluted to ~1 mg/mL in dialysis buffer (20 mM HEPES-KOH, pH 7.5, 150 mM KCl, 10% (v/v) glycerol, and 1 mM DTT) and dialyzed against dialysis buffer overnight at +4 °C. Following the His 6 -tag removal, Cas9 was loaded onto a SP Sepharose High Performance cation exchange column (HiTrap SP HP, GE Healthcare) and eluted in 100-500 mM gradient of KCl. Finally, the Cas9 protein storage buffer was exchanged by dialysis into 30 mM Tris-HCl pH 8.0, 200 mM NaCl, 20 mM EDTA, 10% (v/v) glycerol and 5 mM DTT. The final Cas9 sample was concentrated to ~10 mg/mL, filtered through 0.22 μm filter, aliquoted, flash-frozen in liquid nitrogen, and stored at −80 °C. Reconstitution of the Cas9-sgRNA-DNA ternary complex. Reconstitution of the Cas9-sgRNA-DNA was carried out by adding substrate dsDNA to a pre-formed the Cas9-sgRNA binary complex. Purified sgRNA was heated to +94 °C for 4 min and then cooled at room temperature to promote proper secondary structure formation. Cas9 and sgRNA were mixed in a 1:1.5 molar ratio and incubated for 10 min at room temperature before adding substrate dsDNA to bring the final molar ratio of ternary complex components Cas9, sgRNA, and dsDNA to 1:1.5:2.0. The ternary complex was diluted in Cas9 complex ‘storage’ buffer (30 mM Tris-HCl pH 7.5, 200 mM NaCl, 20 mM EDTA, 10% glycerol and 5 mM DTT) to final concentration of ~0.5 mg/mL. To initiate nuclease activity, MgCl 2 was added to the ternary complex to a final concentration of 40 mM. Following incubation at +37 °C for 30 min, samples were flash-frozen in liquid nitrogen. Electromobility shift assays, SDS-PAGE, and TBE-urea analyses of Cas9 activity and stability. To assess Cas9 activity and the stability of the ternary complex in the complex storage buffer over time, the ternary complex was formed using 1:1.5:1.5 molar ratio of Cas9-sgRNA-DNA. Aliquots of the ternary complex were taken at 0, 1, 5, 30, 240 and 960 min after DNA addition and subjected to several analyses. Briefly, 2.6 mL of the master mix (i.e. the complex storage buffer containing 40mM MgCl 2 ) was prepared and kept on ice. The sgRNA was heated at +94 °C for 3 min, allowed to cool to room temperature, and then added to the master mix to a final concentration of 600 nM. Cas9 was then added to a final concentration of 400 nM and incubated for 5 min before the addition of the substrate DNA to a final concentration of 600 nM. Subsequently, 12 150 μl aliquots (i.e. 6 duplicate timepoints) were distributed into a 96-well plate that was pre-chilled on ice. 25 μl of 0.5 M EDTA was added to the first 2 reactions to inhibit DNA cleavage for the 0 min timepoint. The plate was then transferred to a +37 °C heated block and EDTA was simultaneously added to two samples corresponding to each timepoint. To assess stability of the Cas9 protein over time, 22.5 μL of the ternary complex from each timepoint was mixed with 7.5 μL of 4x SDS-polyacrylamide gel electrophoresis (PAGE) loading buffer, heated for 5 min at +95 °C, and loaded onto a 4-20% precast SDS-PA gel (Bio-Rad). The gel was stained with Coomassie Brilliant Blue R-250 to visualize Cas9. After the addition of EDTA, one of the samples was subjected to RNase A (Invitrogen) and proteinase K (Life Technologies) treatments for 60 and for 30 min, respectively, at +37 °C. After treatments, samples were flash-frozen and kept at −80 °C until further use. RNase A and proteinase K treatments allow for analysis of free and Cas9-bound DNA at each timepoint and ensure the visualization of cleaved DNA products. To visualize the ternary complex stability and DNA cleavage levels, samples were subjected to electromobility shift assays (EMSA) on a native TBE-PA gel. Briefly, 18 μl of both untreated and RNaseA/proteinase K-treated samples corresponding to each time point was mixed with 2 μl of 5x Novex Hi-Density TBE sample buffer (Thermo Fisher) and then immediately loaded onto an 8% 0.5x TBE-PA gel. To prevent cleaved DNA from running off the gel, electrophoresis was run until the bromophenol dye front reached 3/4 of the gel. The gel was first stained in ethidium bromide (0.05 μg/mL) and then in Coomassie Brilliant Blue R-250 to visualize nucleic acids (i.e. DNA and sgRNA) and Cas9 on the same gel. To assess kinetics of DNA cleavage, 20 μL of untreated and RNaseA/proteinase K-treated sample corresponding to each time point was mixed with 20 μL of 2x Novex TBE-urea sample buffer (Thermo Fisher), heated at +95 °C for 3 min, and loaded onto a 15% TBE-urea PA gel. To visualize the nucleic acid species, the gels were stained with 0.05 μg/mL ethidium bromide solution for 10 min. Control samples contained 400 nM Cas9, 600 nM sgRNA, or 600 nM DNA only in the complex storage buffer. All gels were imaged on the GL212 Pro Imager (Carestream) using UV transillumination for ethidium bromide staining and white light trans-illumination for Coomassie staining. Cryo-EM grid preparation and data collection. The Cas9-sgRNA-DNA ternary complex sample (0.5 mg/mL) was concentrated to a volume of ~ 1.8 mL and then vitrified. A volume of 2.8 μl of the sample was applied to Cu R1.2/1.3, 300 mesh holey carbon grids (Quantifoil) plasma cleaned using H 2 /O 2 gas mixture for 5 s in a Solarus plasma cleaner (Gatan Inc.) operating at 50 W. The sample was allowed to adsorb for 2 s prior to blotting for 6 s, followed by plunge freezing into liquid ethane cooled at liquid N 2 temperature with a Leica EM GP (Leica Microsystems Inc.) and operating at +20 °C and 90% humidity. Cryo-EM grids were imaged using a Titan Krios transmission electron microscope (FEI Company), operated at 300 kV and aligned for parallel illumination, with the specimen maintained at liquid nitrogen temperatures ( Table 1 ). Images were recorded on a K2 Summit camera equipped with the XP sensor (Gatan Inc., Pleasanton, CA) operated in super-resolution counting mode, placed at the end of a GIF Quantum Energy Filter (Gatan Inc., Pleasanton, CA), operating in zero-energy-loss mode with a slit width of 20 eV. Images were typically collected with a defocus range between −0.7 to −3.0 μm at a nominal magnification of 165,000x corresponding to a super-resolution pixel size of 0.418 Å. A total of 2405 micrographs were collected using automated data acquisition in Latitude software (Gatan Inc., Pleasanton, CA) as a 70-frame movie with intermediate frames recorded every 0.2 s. The dose rate used was ~5.2 e − /Å 2 ·s (at the specimen plane) with a total exposure time of 14 s, giving an accumulated dose of ~73 e − /Å 2 ·s per micrograph. Image processing. All image processing was performed within RELION 3.0-beta-2 28 unless stated otherwise. Two batches of movies were first motion-corrected and dose-weighted separately using MotionCor2 29 . Then all aligned micrographs were merged and processed together. About 1.3 million particles were picked by Gautomatch and cleaned by 2D classification. An initial model was generated from cleaned particle stack and used as reference in 3D classification. Particles corresponding to the best class showing high-resolution features were then re-extracted with a box size of 608 and a binning factor of 2. Local 3D refinement was performed, followed by CTF refinement and Bayesian polishing. The refined particles were further classified into 6 classes with mask. For the final reconstruction, particles of each class were subjected to homogeneous refinement in cryoSPARC 30 . The overall resolutions were estimated based on the gold-standard criterion of Fourier shell correlation (FSC) = 0.143. Local resolutions were estimated from two half maps in cryoSPARC. Fourier shell correlation was calculated with Mtriage in Phenix 31 . Model building and refinement. Initial models for all three states were derived from the high-resolution crystal structures of Cas9-sgRNA-DNA complexes (PDB ID 5B2R, 5F9R and 4UN3). Each domain was fitted into electron density maps and adjusted manually in Coot 32 . For the active site of state II, corresponding residues from the homing endonuclease I-HmuI (PDB ID 1U3E) were used as starting point. For the additional PAM-distal DNA duplex in state II and III, an ideal B-form DNA duplex was docked into the density. Final structures were refined using crystal structures as reference in Phenix 31 . Final models were validated with statistics from Ramachandran plots, MolProbity scores, and EMRinger scores ( Table 1 ). Reporting Summary Statement: Further information on experimental design is available in the Nature Research Reporting Summary linked to this article. Data Availability Statement: All data needed to assess and evaluate the conclusions in the paper are available in the main text and Supplementary Information. The coordinates and electron density maps are deposited in the Protein Data Bank and EMDB with the following accession numbers: 6O0Z and 0585 for pre-catalytic complex (state I), 6O0Y and 0584 for post-catalytic complex (state II), and 6O0X and 0583 for product complex (state III). Source data for Supplementary Fig. 3 are available with the paper on-line. All other data are available upon request.
Supplementary Material 1 2 3 4 5 6 7 8 9
📊 Figures
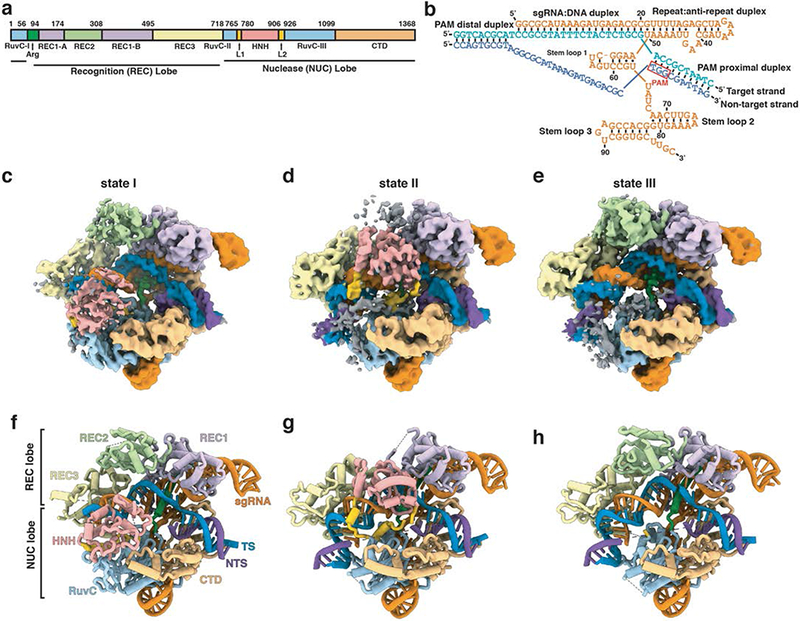
Fig. 1.
Cryo-EM structures of three states of Cas9-sgRNA-dsDNA complex.
(a) Domain organization of S. pyogenes Cas9. (b) Schematic diagram of the nucleic acids used in the study. The sgRNA is orange, and the target (TS) and non-target strands (NTS) of the dsDNA are blue a...
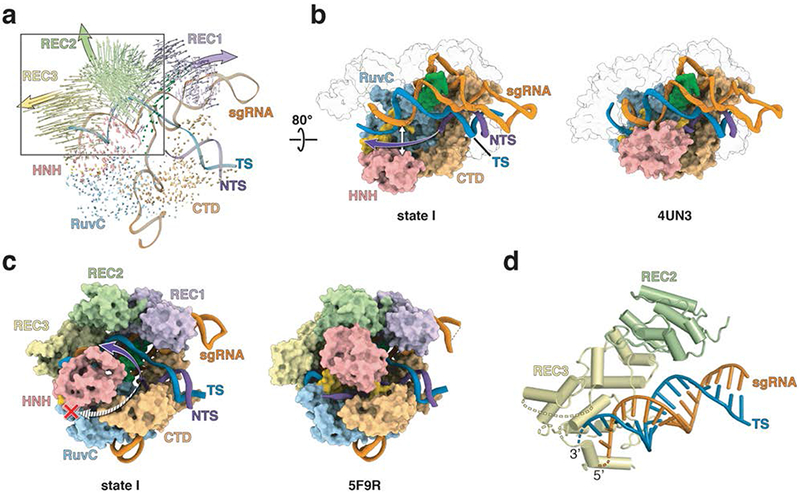
Fig. 2.
The central channel of Cas9 accommodates the R-loop structure in state I.
(a) Superposition of Cas9-sgRNA (PDB ID 4ZT0) onto state I, with RuvC as the common reference, reveals the extent of Cas9 domain movements upon dsDNA and Mg 2+ binding. Arrow lengths correspond to the...
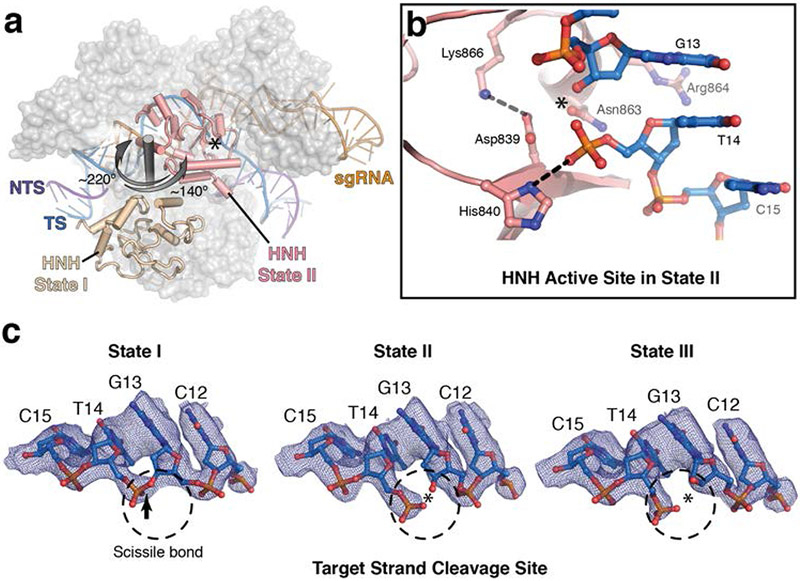
Fig. 3.
HNH domain adopts catalytic conformation in state II.
(a) A conformational change of the HNH domain during transition from state I to state II. The HNH domain in state I (beige cartoon) rotates around a central axis (grey rod) and translates ~34 u00c5 to...
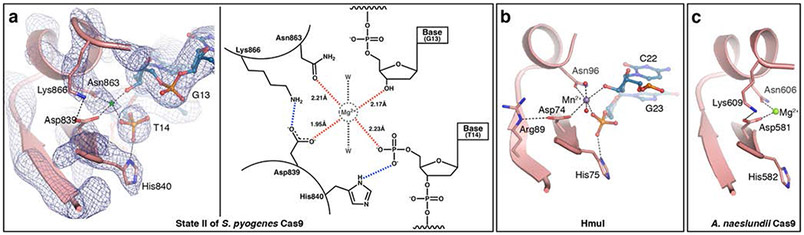
Fig. 4.
The HNH active site conformation in state II.
(a) Left: Close-up view of the active site of the HNH domain in state II (pink) with the corresponding cryo-EM map (blue mesh) superposed. A putative metal ion position is marked with green asterisk. ...
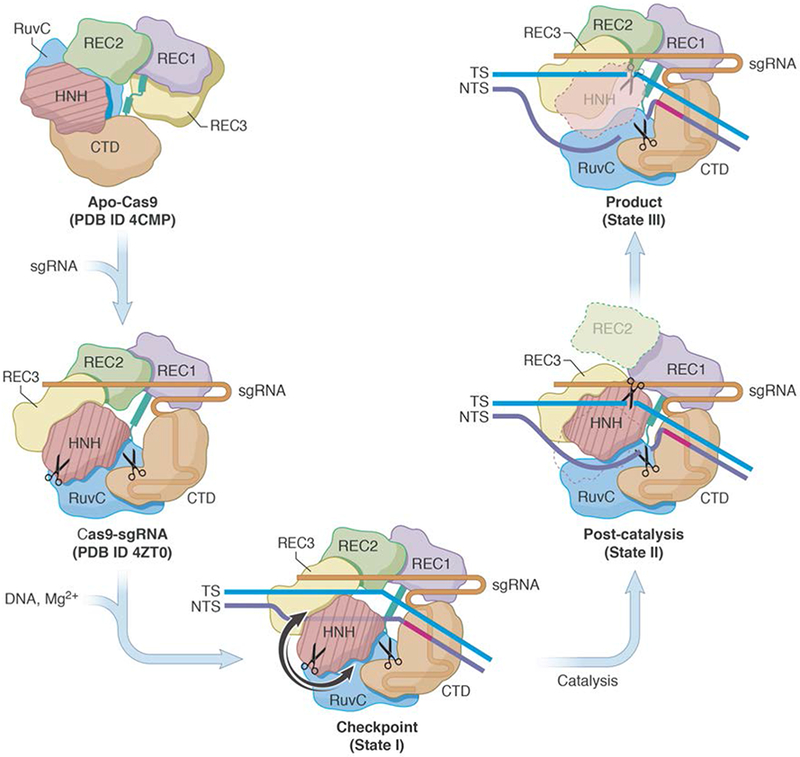
Fig. 5.
Proposed mechanism for the concerted series of domain movements involved in Cas9-mediated DNA cleavage.
The binding of sgRNA to apo-Cas9 induces major domain rearrangements and formation of the binary complex. In the presence of dsDNA and Mg 2+ , the u201ccheckpointu201d conformation (State I) is formed...
Figure images are served from the NIH/NLM PubMed Central Open Access Subset or Europe PMC; copyright remains with the publishers and authors.
💬 Discussion
0 commentsNo comments yet. Be the first to start a discussion!
Leave a Comment