Abstract
Abstract Whereas extracellular vesicle (EV) research has become commonplace in different biomedical fields, this field of research is still in its infancy in mycology. Here we provide a robust set of data regarding the structural and compositional aspects of EVs isolated from the fungal pathogenic species Cryptococcus neoformans, C. deneoformans and C. deuterogattii . Using cutting‐edge methodological approaches including cryogenic electron microscopy and cryogenic electron tomography, proteomics, and flow cytometry, we revisited cryptococcal EV features and suggest a new EV structural model, in which the vesicular lipid bilayer is covered by mannoprotein‐based fibrillar decoration, bearing the capsule polysaccharide as its outer layer. About 10% of the EV population is devoid of fibrillar decoration, adding another aspect to EV diversity. By analysing EV protein cargo from the three species, we characterized the typical Cryptococcus EV proteome. It contains several membrane‐bound protein families, including some Tsh proteins bearing a SUR7/PalI motif. The presence of known protective antigens on the surface of Cryptococcus EVs, resembling the morphology of encapsulated virus structures, suggested their potential as a vaccine. Indeed, mice immunized with EVs obtained from an acapsular C. neoformans mutant strain rendered a strong antibody response in mice and significantly prolonged their survival upon C. neoformans infection.
🔬 Techniques
🧬 Organisms
💻 Software
✨ Fluorophores
🧪 Sample Preparation
🏭 Microscope Brands
🧪 Reagent Suppliers
📷 Detectors
💻 Software Details
💾 Data Repositories
🏛️ Research Organizations (ROR)
Affiliated research institutions:
📋 Methods
Strains and media
The wild type strains used in the study were C. neoformans strain KN99α, C. deneoformans strain JEC21, C. deuterogattii strain R265, C. albicans strain SC5314, and S. cerevisiae strain S288C. The C. neoformans strain NE367 ( MATα cap59Δ::NAT) has been previously described (Moyrand et al., 2007 ). The strains MATα vep1Δ::NAT (CNAG_03223), MATα hoc3Δ::NAT (CNAG_00158), MATα alg3Δ::NAT (CNAG_05142), MATα ktr3Δ::NAT (CNAG_03832) have been constructed in the Hiten Madhani lab (UCSF, USA) and obtained from the Fungal Genetic Stock Center. To construct the strains NE1281 ( MATα mp88Δ::NEO ) and NE1469 ( MATα vep1Δ::NAT mp88Δ::NEO ), we replaced the entire CNAG_00776 ( MP88 ) CDS by the NEO marker in the strains KN99α and MATα vep1Δ::NAT , respectively. We here followed the previously described CRISPR CAS9 method (Fan & Lin, 2018 ). The plasmid pPZP‐NEO1 used to amplify the NEO selective marker was kindly provided by Dr. Joseph Heitman (Duke University). The deletion cassettes were constructed using a strategy previously applied to Neurospora crassa (Collopy et al., 2010 ). The transformants were then screened for homologous integration, as previously described (Moyrand et al., 2007 ). Two representatives independently obtained mutant strains were stocked at ‐80°C. All primer sequences used are provided in Table S1 . All strains were taken from the G. Janbon laboratory collection at ‐80°C, plated on yeast extract‐peptone‐dextrose (YPD) and incubated at 30°C for 48h before each experiment. EV isolation, labelling and proteinase K treatment EV purification was based on the previously published protocol (Reis et al., 2019 ) with some modifications. One loop of cells was inoculated into 10 ml of liquid YPD and incubated at 30°C for 24 h with shaking (180 rpm). Cells were washed twice with 10 ml of sterile water, counted and diluted to a density of 3.5 × 10 7 cells/ml in water. Aliquots of 300 μl of cell suspension were spread onto synthetic dextrose (SD) solid medium plates and incubated for 24 h at 30°C. Cells were carefully recovered from each plate with a 10 μl inoculation loop (without damaging the agar medium), gently resuspended in 10 ml of 0.22 μm‐filter sterile 0.01 M PBS, and pelleted by centrifugation at 5,000 × g for 15 min at 4⁰C. The supernatant was collected and centrifuged again at 15,000 × g for 15 min at 4⁰C. The supernatant was then filtered through 0.45 μm syringe filters and ultracentrifuged at 100,000 × g for 1h at 4°C (SW41 Ti swinging‐bucket rotor, Beckman Coulter) in an open‐top thinwall ultra‐clear tube. The supernatant was discarded and the pellet suspended in adjusted volumes of 0.22 μm‐pore filtered or 0.02 μm‐pore filtered (for Flow Cytometry analysis) PBS for immediately use or stored at ‐80°C for further experiments. The amount of total sterol in the EV samples was measured by the Amplex™ Red Cholesterol Assay Kit (ThermoFisher, A12216) and adjusted for the subsequent experiments. EVs were labelled either with the Concanavalin A (ConA) ‐ Alexa Fluor™ 488 conjugated, or with the Alexa 488 labelled anti‐GXM monoclonal antibody 18B7 (Casadevall et al., 1992 ), a kind gift of Oscar Zaragoza. The ConA stock solution (5 mg/ml in 0.1 M sodium bicarbonate, pH 8.3) was previously centrifuged at 13.000 x rpm for 2 min, in order to eliminate possible aggregates, and diluted to 500 μg/ml in filtered PBS. In 1.5 ml Eppendorf tubes, 5 μl of ConA (500 μg/ml), together with 5 μl of the EV suspension were added to a final volume of 100 μl filtered PBS. The tubes were incubated for 1 h at 30°C, under agitation and protected from light. After incubation, 10 ml of 0.02 μm‐pore filtered PBS were added to the EV suspension and then submitted to ultracentrifugation for 1 h at 100,000 × g at 4°C. The supernatant was again discarded, and pellets suspended in 300 μl of 0.02 μm‐pore filtered before being transferred to BD Trucount™ Tubes (BD Biosciences) for Flow Cytometry analysis. A similar protocol was applied for the EV labelling with the Alexa 488 labelled anti‐GXM monoclonal antibody 18B7, which was diluted 20 times from the stock solution (680 μg/ml) before adding to EV suspension. EV proteinase K treatment was performed following the previously described protocol (Yang et al., 2021 ) with some modifications. Briefly, proteinase K was added to the EV suspension (0.17 μg of sterol) to a final concentration of 2 mg/ml in 0.02 μm‐pore filtered PBS. After proteolysis for 1 h at 55°C under agitation (300 rpm), the enzymatic reaction was stopped by the addition of the proteinase inhibitor PMSF (1 mM), followed by incubation for 20 min at RT. Proteinase K‐treated EVs were finally submitted to ConA labelling, ultracentrifuge washed as described before and analysed by flow cytometry. Control conditions included untreated EVs and EVs incubated only with PMSF.
Show full methods section
Strains and media
The wild type strains used in the study were C. neoformans strain KN99α, C. deneoformans strain JEC21, C. deuterogattii strain R265, C. albicans strain SC5314, and S. cerevisiae strain S288C. The C. neoformans strain NE367 ( MATα cap59Δ::NAT) has been previously described (Moyrand et al., 2007 ). The strains MATα vep1Δ::NAT (CNAG_03223), MATα hoc3Δ::NAT (CNAG_00158), MATα alg3Δ::NAT (CNAG_05142), MATα ktr3Δ::NAT (CNAG_03832) have been constructed in the Hiten Madhani lab (UCSF, USA) and obtained from the Fungal Genetic Stock Center. To construct the strains NE1281 ( MATα mp88Δ::NEO ) and NE1469 ( MATα vep1Δ::NAT mp88Δ::NEO ), we replaced the entire CNAG_00776 ( MP88 ) CDS by the NEO marker in the strains KN99α and MATα vep1Δ::NAT , respectively. We here followed the previously described CRISPR CAS9 method (Fan & Lin, 2018 ). The plasmid pPZP‐NEO1 used to amplify the NEO selective marker was kindly provided by Dr. Joseph Heitman (Duke University). The deletion cassettes were constructed using a strategy previously applied to Neurospora crassa (Collopy et al., 2010 ). The transformants were then screened for homologous integration, as previously described (Moyrand et al., 2007 ). Two representatives independently obtained mutant strains were stocked at ‐80°C. All primer sequences used are provided in Table S1 . All strains were taken from the G. Janbon laboratory collection at ‐80°C, plated on yeast extract‐peptone‐dextrose (YPD) and incubated at 30°C for 48h before each experiment. EV isolation, labelling and proteinase K treatment EV purification was based on the previously published protocol (Reis et al., 2019 ) with some modifications. One loop of cells was inoculated into 10 ml of liquid YPD and incubated at 30°C for 24 h with shaking (180 rpm). Cells were washed twice with 10 ml of sterile water, counted and diluted to a density of 3.5 × 10 7 cells/ml in water. Aliquots of 300 μl of cell suspension were spread onto synthetic dextrose (SD) solid medium plates and incubated for 24 h at 30°C. Cells were carefully recovered from each plate with a 10 μl inoculation loop (without damaging the agar medium), gently resuspended in 10 ml of 0.22 μm‐filter sterile 0.01 M PBS, and pelleted by centrifugation at 5,000 × g for 15 min at 4⁰C. The supernatant was collected and centrifuged again at 15,000 × g for 15 min at 4⁰C. The supernatant was then filtered through 0.45 μm syringe filters and ultracentrifuged at 100,000 × g for 1h at 4°C (SW41 Ti swinging‐bucket rotor, Beckman Coulter) in an open‐top thinwall ultra‐clear tube. The supernatant was discarded and the pellet suspended in adjusted volumes of 0.22 μm‐pore filtered or 0.02 μm‐pore filtered (for Flow Cytometry analysis) PBS for immediately use or stored at ‐80°C for further experiments. The amount of total sterol in the EV samples was measured by the Amplex™ Red Cholesterol Assay Kit (ThermoFisher, A12216) and adjusted for the subsequent experiments. EVs were labelled either with the Concanavalin A (ConA) ‐ Alexa Fluor™ 488 conjugated, or with the Alexa 488 labelled anti‐GXM monoclonal antibody 18B7 (Casadevall et al., 1992 ), a kind gift of Oscar Zaragoza. The ConA stock solution (5 mg/ml in 0.1 M sodium bicarbonate, pH 8.3) was previously centrifuged at 13.000 x rpm for 2 min, in order to eliminate possible aggregates, and diluted to 500 μg/ml in filtered PBS. In 1.5 ml Eppendorf tubes, 5 μl of ConA (500 μg/ml), together with 5 μl of the EV suspension were added to a final volume of 100 μl filtered PBS. The tubes were incubated for 1 h at 30°C, under agitation and protected from light. After incubation, 10 ml of 0.02 μm‐pore filtered PBS were added to the EV suspension and then submitted to ultracentrifugation for 1 h at 100,000 × g at 4°C. The supernatant was again discarded, and pellets suspended in 300 μl of 0.02 μm‐pore filtered before being transferred to BD Trucount™ Tubes (BD Biosciences) for Flow Cytometry analysis. A similar protocol was applied for the EV labelling with the Alexa 488 labelled anti‐GXM monoclonal antibody 18B7, which was diluted 20 times from the stock solution (680 μg/ml) before adding to EV suspension. EV proteinase K treatment was performed following the previously described protocol (Yang et al., 2021 ) with some modifications. Briefly, proteinase K was added to the EV suspension (0.17 μg of sterol) to a final concentration of 2 mg/ml in 0.02 μm‐pore filtered PBS. After proteolysis for 1 h at 55°C under agitation (300 rpm), the enzymatic reaction was stopped by the addition of the proteinase inhibitor PMSF (1 mM), followed by incubation for 20 min at RT. Proteinase K‐treated EVs were finally submitted to ConA labelling, ultracentrifuge washed as described before and analysed by flow cytometry. Control conditions included untreated EVs and EVs incubated only with PMSF.
Flow cytometry
EVs were analysed and sorted on a cell sorter MoFlo Astrios (Beckman Coulter) equipped with an EQ module specifically developed to detect nanoparticles and with 488 nm and 561 nm lasers at 200 mW. The sorting was carried out with a 70 μm nozzle at a pressure of 60 PSI and a differential pressure with the sample of 0.3‐0.4 PSI. The sheath liquid NaCl 0.9% (REVOL, France) was filtered on a 0.04 μm filter. The analyses were on the SSC parameter of laser 561, with threshold set to 0.012% in order to have maximum 300 eps. An M2 mask was added in front of the FSC. All SSC and FSC parameters are viewed in logarithmic mode. The calibration of the machine was carried out using Megamix‐Plus SSC beads from BioCytex. We used the Trucount™ Tubes to normalize the EV counting for ConA labelling, and the fluorescence of the Mab18B7 and alexa 488 conjugated, and beads Trucount™ was measured on parameter 488–513/26. Control conditions including ultracentrifuge washed PBS, previously incubated with ConA were used to evaluate the PBS associated noise and to normalize labelling percentages. Flow Cytometry data were analysed by FlowJo V10 Software. Nanoparticle tracking analysis (NTA) Quantitative determination of EV size distribution was performed by NTA, in addition to microscopic methods. Protocols that were recently established for the analysis of cryptococcal EVs were used (Reis et al., 2019 ). Briefly, ultracentrifugated pellets were 20‐ to 50‐fold diluted in filtered PBS and measured within the optimal dilution range of 9 × 10 7 to 2.9 × 10 9 particles/ml on an LM10 nanoparticle analysis system, coupled with a 488‐nm laser and equipped with an SCMOS camera and a syringe pump (Malvern Panalytical, Malvern, United Kingdom). The data were acquired and analysed using the NTA 3.0 software (Malvern Panalytical). Cryo‐EM and cryo‐ET EVs (4 μl) were spotted on glow‐discharged lacey grids (S166‐3, EMS) and cryo‐fixed by plunge freezing at ‐180°C in liquid ethane using a Leica EMGP (Leica, Austria). Grids were observed either with Tecnai F20, or Titan Krios (Thermo Fisher Scientific). The Tecnai F20 (Thermo Fisher Scientific) was operating at 200 kV and images were acquired under low‐dose conditions using the software EPU (Thermo Fisher Scientific) and a direct detector Falcon II (Thermo Fisher Scientific). Cryo‐electron tomography was performed using 5 nm protein‐A gold particles (UMC, Utrecht). These were mixed with the sample to serve as fiducial markers for subsequent image alignment. EV sample (4 μl) was applied to glow discharged Lacey grids (S166‐3, EMS) prior plunge‐freezing (EMGP, Leica). Initial bi‐directional tilt series acquired using a TECNAI F20 transmission electron microscope (FEI) operated at 200 kV under parallel beam conditions using a Gatan 626 side entry cryoholder. The SerialEM software (Mastronarde, 2005 ; Schorb et al., 2019 ) was used to automatically acquire images every 2° over a ±45° range using a Falcon II direct detector with a pixel size of 2 Å, using a total dose of 180 electrons per Å2. At least 100 EV cryo‐EM images obtained from TECNAI F20 were used for measuring EV diameter and decoration thickness in wild type (WT) and mutant strains. For each EV, an average of three different measurements was used to calculate the diameter (delimited by the lipid bilayer) and the decoration thickness. Dose‐symmetric tilt series were collected on a 300 kV Titan Krios (Thermo Scientific) transmission electron microscope equipped with a Quantum LS imaging filter (Gatan, slit with 20 eV), single‐tilt axis holder and K3 direct electron detector (Gatan). Tilt series with an angular increment of 2° and an angular range of ±60° were acquired with the Tomography software (Thermo Scientific). The total electron dose was between 120 and 150 electrons per Å2 and the pixel size at 3.38 Å. Dose symmetric tilt series were saved as separate stacks of frames and subsequently motion‐corrected and re‐stacked from −60° to +60° using IMOD's function align frames (Mastronarde & Held, 2017 ) with the help of a homemade bash script. Initial image shifts were estimated using IMOD's function tiltxcorr. Alignments were further optimized in IMOD using the tracing of 30–40 gold fiducials across the tilt series. The fiducial models gave an overall of a fiducial error around 6 ± 2.7 Å. In cases of a higher error, local alignments were taken into consideration, to further correct the sample's beam induced motion observed. Three‐dimensional reconstructions were calculated in IMOD by weighted back projection using the SIRT‐like radial filter to enhance contrast and facilitate subsequent segmentation analysis.
EV‐modelling and analysis of tomographic data
Tomograms were displayed and analysed using the 3dmod interface of IMOD (Kremer et al., 1996 ). EVs were modelled with manual tracing of their great circle prior the use of the spherical interpolator of IMOD. If the elliptical contours calculated could not follow the vesicular membrane adequately, further manual tracing was used before re‐applying the interpolator. This involved tracing of membranes near the poles of the vesicles where the membrane information could still be followed. To evaluate and assign diameters to a total of 434 C. neoformans regular vesicles, located in 39 tomograms, the value of the perimeter of the spheroid's great circle was extracted using the imodinfo function of IMOD, from the same initial manually traced contours used for modelling. To display in 3D the vesicle contour data were meshed using the imodmesh function of IMOD. The projections of the 3D spheroidal models were displayed and rotated to study their 3D geometry. For the evaluation of the decoration thickness, regular vesicles were analysed by manually measuring the outer EV diameter (delimited by the fibrillar decoration) and the inner diameter (delimited by the lipid bilayer), across the longest axis of the vesicle. The final calculation of the decoration thickness was the subtraction of the inner diameter from the outer diameter, divided by two. For the modelling of the fibrillar decoration, the IMOD surface models were imported to UCSF Chimera (Pettersen et al., 2004 ). The models were used as masks to extract a slab of data around their outer surface, corresponding to the decoration. The thickness of the slab used refers to the mean value provided by the aforementioned manual analysis. Iso‐surface representation of the decoration and final 3D data visualization of the models performed with UCSF Chimera (Pettersen et al., 2004 ).
Immunization assays
The animal experiments were approved by the ethical committee for animal experimentation Comité d’Éthique en Experimentation Animale (CETEA Project license number 2013‐0055). Six‐week old female BALB/c mice (Janvier Labs) were used for immunization study. The amount of EVs, in protein concentration, was determined by BCA method prior to immunization. Following, three intraperitoneal injections (fixing protein concentration in the EVs to either 1 or 10 μg and suspending in 100 μl PBS) at 15‐day intervals were given to the mice. The control group of mice was injected only with PBS. Blood was collected from the submandibular veins of the mice 3 days after the last immunization and just before the fungal infection and tested for antibody response by Western blot. Briefly, the EVs‐associated proteins were separated on 12% SDS‐PAGE, and electroblotted to nitrocellulose membrane. By Western blotting, using the mouse sera at dilution 1:1000 and anti‐mouse IgG antibody conjugated to peroxidase (Sigma Aldrich), the antibody response specific to the EV‐associated proteins was examined. Once the antibody response was confirmed, all the immunized and control mice were challenged intranasally, around 1 month from the last immunization, with 1 × 10 4 cells of C. neoformans wild‐type strain, and their body weights and survival were monitored until all mice succumbed to the infection. The immunization assay was performed in two biological replicates.
Vesicle denaturation and protein digestion
EVs proteins were solubilized in urea 8 M, Tris 100 mM pH 7.5, 5 mM tris (2‐carboxyethyl) phosphine (TCEP) for 20 min at 23°C. Samples were sonicated using a Vibracell 75186 and a miniprobe 2 mm (Amp 80% // Pulse 10 off 0.8, 3 cycles). Proteins were then alkylated with 20 mM iodoacetamide for 30 min at room temperature in the dark. Subsequently, LysC (Promega) was added for the first digestion step (protein to Lys‐C ratio = 80:1) for 3 h at 30°C. Then samples were diluted down to 1 M urea with 100 mM Tris pH 7.5, and trypsin (Promega) was added to the sample at a ratio of 50:1 for 16 h at 37°C. Proteolysis was stopped by adding Formic acid (FA) to a final concentration of 1 % (vol/vol). Resulting peptides were desalted using Sep‐Pak SPE cartridge (Waters) according to manufactures instructions. LC‐MS/MS of tryptic digest LC‐MS/SM analysis of trypsin‐digested proteins (peptides) was performed on an Orbitrap Q Exactive Plus mass spectrometer (Thermo Fisher Scientific, Bremen) coupled to an EASY‐nLC 1200 (Thermo Fisher Scientific). A home‐made column was used for peptide separation [C 18 40 cm capillary column picotip silica emitter tip (75 μm diameter filled with 1.9 μm Reprosil‐Pur Basic C 18 ‐HD resin, (Dr. Maisch GmbH, Ammerbuch‐Entringen, Germany)]. It was equilibrated and peptide was loaded in solvent A (0.1 % FA) at 900 bars. Peptides were separated at 250 nL.min –1 . Peptides were eluted using a gradient of solvent B (ACN, 0.1% FA) from 3% to 22 % in 160 min, 22% to 50% in 70 min, 50% to 90% in 5 min (total length of the chromatographic run was 250 min including high ACN level step and column regeneration). Mass spectra were acquired in data‐dependent acquisition mode with the XCalibur 2.2 software (Thermo Fisher Scientific, Bremen) with automatic switching between MS and MS/MS scans using a top‐10 method. MS spectra were acquired at a resolution of 70000 (at m/z 400) with a target value of 3 × 10 6 ions. The scan range was limited from 300 to 1700 m/z . Peptide fragmentation was performed using higher‐energy collision dissociation (HCD) with the energy set at 27 NCE. Intensity threshold for ions selection was set at 1 × 10 6 ions with charge exclusion of z = 1 and z > 7. The MS/MS spectra were acquired at a resolution of 17500 (at m/z 400). Isolation window was set at 1.6 Th. Dynamic exclusion was employed within 45 s.
Data processing
Data were searched using MaxQuant (version 1.5.3.8 and 1.6.6.0) (Cox & Mann, 2008 ; Tyanova et al., 2016 ) using the Andromeda search engine (Cox et al., 2011 ) against home‐made databases. The following databases were used. For C. neoformans KN99α, C. deneoformans JEC21 and C. deuterogattii R265 we used the recently updated proteomes (Gröhs Ferrareze et al., 2021 ; Wallace et al., 2020 ). The following search parameters were applied: carbamidomethylation of cysteines was set as a fixed modification, oxidation of methionine and protein N‐terminal acetylation were set as variable modifications. The mass tolerances in MS and MS/MS were set to 5 ppm and 20 ppm respectively. Maximum peptide charge was set to 7 and 7 amino acids were required as minimum peptide length. A false discovery rate of 1% was set up for both protein and peptide levels. The iBAQ intensity was used to estimate the protein abundance within a sample (Schwanhäusser et al., 2011 ).
Statistical analysis
All statistical analyses were performed using GraphPad Prism 9 software (GraphPad Software Inc.). Data sets were tested for normal distribution using Shapiro‐Wilk or Kolmogorov‐Smirnov normality tests. In the cases in which the data passed the normality test, they were further analysed using the unpaired Student's t test or ordinary one‐way ANOVA. When at least one data set was nonnormally distributed, we used the nonparametric Kolmogorov‐Smirnov or Kruskal‐Wallis test. For the comparison of the survival curves, we used the Logrank (Mantel‐Cox) test.
Supporting information Supporting Information Click here for additional data file. Supporting Information Click here for additional data file. Supporting Information Click here for additional data file. Supporting Information Click here for additional data file. Supporting Information Click here for additional data file. Supporting Information Click here for additional data file. Supporting Information Click here for additional data file. Supporting Information Click here for additional data file.
📊 Figures
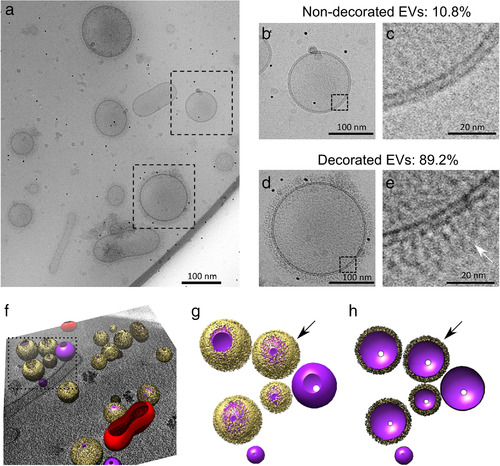
FIGURE 1
Cryou2010electron microscopy analysis of C. neoformans extracellular vesicles (EVs). Cryou2010EM analysis revealed a heterogeneous population of vesicles with diverse structural aspects, previously un...
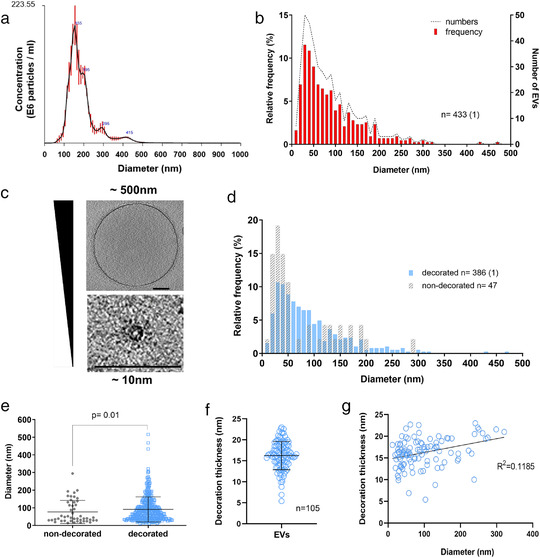
FIGURE 2
Analysis of size and structural diversity of C. neoformans EVs. NTA analysis of purified EVs revealed a size diameter ranging from 80 to 500u00a0nm, with the highest distribution around 150u00a0nm (a)...
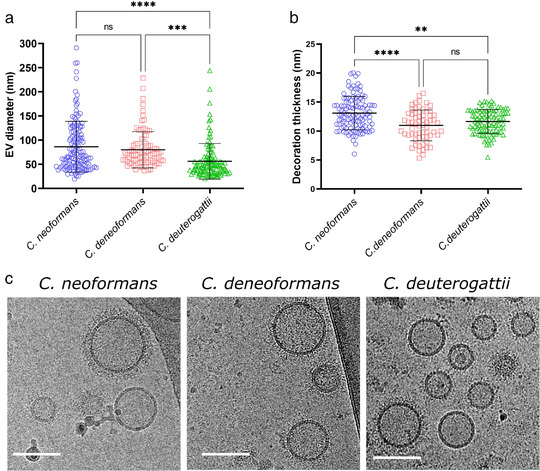
FIGURE 3
Comparative analysis of size and structural diversity of EVs in C. neoformans , C. deneoformans and C. deuterogattii . Analysis of EV diameters revealed a smaller size distribution in C. deuterogattii...
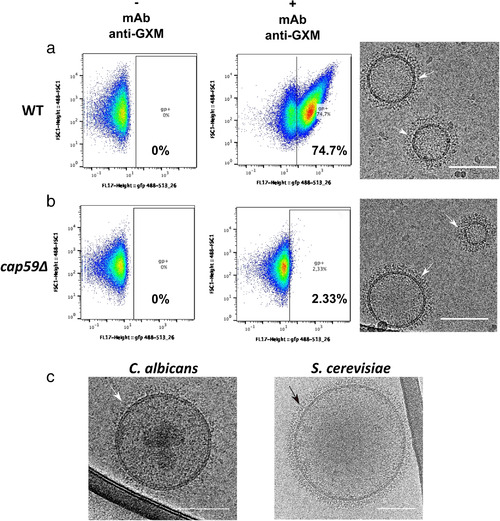
FIGURE 4
Flow cytometry analysis of C. neoformans EVs incubated with monoclonal antiu2010GXM antibody. FACS analysis of wild type (WT) and the acapsular cap59u0394 EVs in PBS (u2010 mAb antiu2010GXM) or in the...
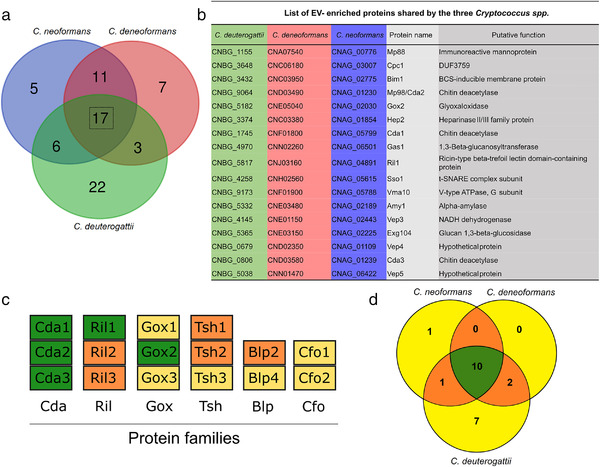
FIGURE 5
Analysis of Cryptococcus spp protein cargo. Venn diagram revealing shared and unique EVu2010associated proteins in C. neoformans , C. deneoformans , and C. deuterogattii . Seventeen proteins were iden...
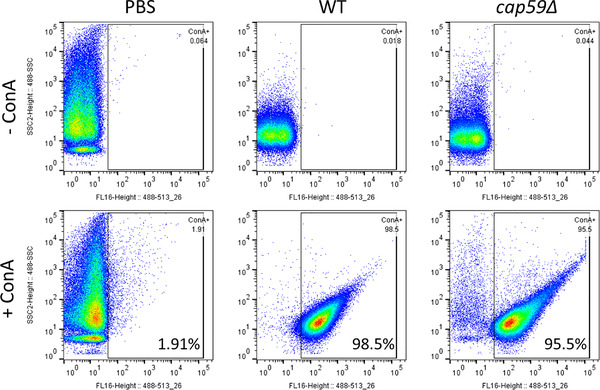
FIGURE 6
Flow cytometry analysis of C. neoformans EVs incubated with GFPu2010labelled ConA. FACS analysis of EVs obtained from C. neoformans wild type and cap59u0394 cells. EVs were incubated with GFPu2010labe...
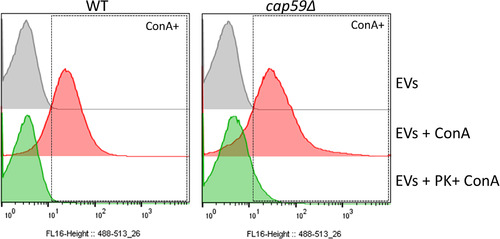
FIGURE 7
EV proteinase K treatment reduces ConA binding. FACS analysis of EVs obtained from C. neoformans WT and cap59u0394 cells after proteinase K treatment. Proteinase Ku2010treated EVs were submitted to Co...
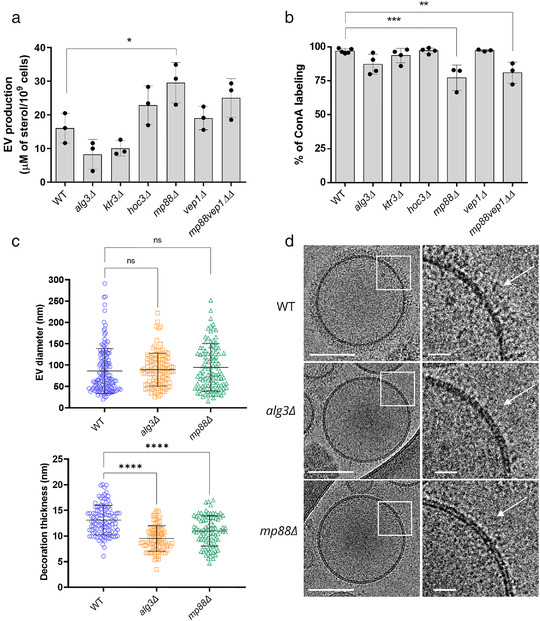
FIGURE 8
Analysis of C. neoformans mutant strain EVs. Evaluation of EV production by the different mutant strains as estimated by the measure of the sterol concentration using the Amplexu2122 Red Cholesterol A...
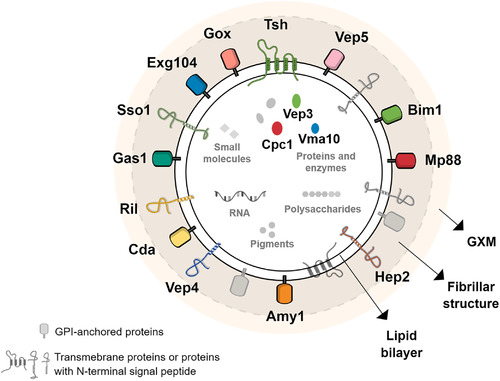
FIGURE 9
Model of simplified molecular structure and composition of Cryptococcus EVs. In accordance with previous reports and in the light of our data, a new model of Cryptococcus EVs is suggested, where the o...
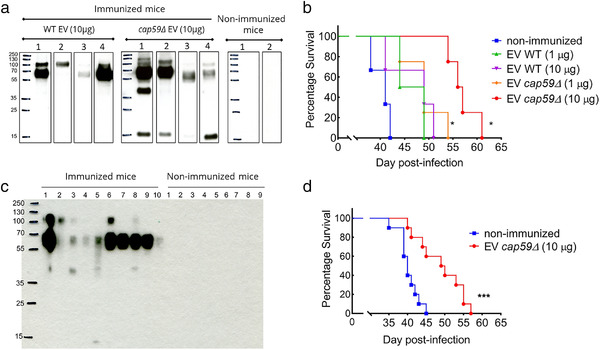
FIGURE 10
Vaccination assays using C. neoformans EVs. Female 6u2010weeks old BALB/c mice were immunized with C. neoformans EVs via intraperitoneal injection, followed by intranasal infection with 1u00a0u00d7u00...
Figure images are served from the NIH/NLM PubMed Central Open Access Subset or Europe PMC; copyright remains with the publishers and authors.
💬 Discussion
0 commentsNo comments yet. Be the first to start a discussion!
Leave a Comment