Abstract
Conventional two-photon microscopy (TPM) is capable of imaging neural dynamics with subcellular resolution, but it is limited to a field-of-view (FOV) diameter [Formula: see text]. Although there has been recent progress in extending the FOV in TPM, a principled design approach for developing large FOV TPM (LF-TPM) with off-the-shelf components has yet to be established. Therefore, we present a design strategy that depends on analyzing the optical invariant of commercially available objectives, relay lenses, mirror scanners, and emission collection systems in isolation. Components are then selected to maximize the space-bandwidth product of the integrated microscope. In comparison with other LF-TPM systems, our strategy simplifies the sequence of design decisions and is applicable to extending the FOV in any microscope with an optical relay. The microscope we constructed with this design approach can image [Formula: see text] lateral and [Formula: see text] axial resolution over a 7-mm diameter FOV, which is a 100-fold increase in FOV compared with conventional TPM. As a demonstration of the potential that LF-TPM has on understanding the microarchitecture of the mouse brain across interhemispheric regions, we performed in vivo imaging of both the cerebral vasculature and microglia cell bodies over the mouse cortex.
🔬 Techniques
✨ Fluorophores
🔬 Cell Lines
🏭 Microscope Brands
📷 Detectors
🔎 Objectives
🏛️ Research Organizations (ROR)
Affiliated research institutions:
📋 Methods
3 Experimental Results 3.1 Experimental Validation with Fluorescein and Fluorescent Microspheres We tested the performance of our system experimentally by placing fluorescein at the sample plane and measuring the fluorescence signal over the FOV with the Olympus XLFLUOR4X underfilled to either NA 0.22 (i.e., input beam diameter to galvo of 10 mm) or NA 0.11 (i.e., input beam diameter to galvo of 5 mm) [ Figs. 8(b) and 8(c) ]. For reference, we also measured the fluorescence signal using a 20 × objective with the same high-throughput relay system [ Fig. 8(a) ]. The fluorescence signal remained above 0.4 times the maximum over FOV diameters of 1.4, 7, and 9 mm with the Olympus XLUMPLFLN ( 20 × , NA 1.0), Olympus XLFLUOR4X underfilled to NA 0.22, and XLFLUOR4X underfilled to NA 0.11, respectively. Fig. 8 Experimental FOV and resolution measurements. (a) Normalized fluorescence signal measured across the FOV using the high-throughput relay shown in Fig. 6 – 7 and the Olympus XLUMPLFLN (20X, NA 1.0). (b) Same as (a), but for Olympus XLFLUOR4X with rear aperture underfilled to an effective NA of 0.22 (10 mm input beam diameter to microscope). (c) Same as (a)-(b), but for Olympus XLFLUOR4X with rear aperture underfilled to an effective NA of 0.11 (5 mm input beam diameter to microscope). (d) Lateral and axial cross section of PSF measured experimentally by imaging 0.5 - μ m diameter fluorescent beads embedded in agarose. Results are for high-throughput relay and NA 1.0 (Olympus XLUMPLFLN). Beads were imaged both on and off axis as specified underneath cross sections. (e) Same as (d), but with the Olympus XLFLUOR4X and effective NA of 0.22. (f) Same as (d)-(e), but with rear aperture underfilled to an effective NA of 0.11. (g) Estimation of lateral resolution measured as FWHM of PSF shown in (d)-(f). (h) Same as (g), but for axial resolution. (i) Profile of lateral and axial PSF for beads imaged on axis shown in (d)–(f). (j) Same as (i), but for beads imaged off axis in the x-direction. (k) Same as (i), but for beads imaged off axis in the y-direction. The resolution was measured over the FOV by imaging 0.5 - μ m fluorescent microspheres [18859-1, Polysciences, Warrington; Figs. 8(d) – 8(h) ] embedded in a thick agarose gel. The FWHM, lateral profiles, and axial profiles of the PSF are also shown in [ Figs. 8(d) – 8(k) ]. As expected, underfilling the objective enables larger field imaging but worsens the resolution, especially axially in comparison with the Olympus XLUMPLFLN. However, our optimal design (XLFLUOR4X underfilled to NA 0.22) can achieve a SBP of 35MP, which is 3.2 times more than what can be achieved with a conventional TPM system ( Table 1 ). The lateral and axial resolutions of the LF-TPM system over the 7-mm-diameter FOV are < 1.7 and < 28 μ m , respectively. This demonstrates the performance and range of imaging fields achievable with these relay lenses, galvanometer, and objective. Table 1 Imaging capabilities of isolated objectives, conventional TPM, and LF-TPM. Lateral resolution for conventional TPM with pixel averaging is effective resolution, not optical resolution. For LF-TPM, the theoretical and experimental lateral resolution are included.
Show full methods section
3 Experimental Results 3.1 Experimental Validation with Fluorescein and Fluorescent Microspheres We tested the performance of our system experimentally by placing fluorescein at the sample plane and measuring the fluorescence signal over the FOV with the Olympus XLFLUOR4X underfilled to either NA 0.22 (i.e., input beam diameter to galvo of 10 mm) or NA 0.11 (i.e., input beam diameter to galvo of 5 mm) [ Figs. 8(b) and 8(c) ]. For reference, we also measured the fluorescence signal using a 20 × objective with the same high-throughput relay system [ Fig. 8(a) ]. The fluorescence signal remained above 0.4 times the maximum over FOV diameters of 1.4, 7, and 9 mm with the Olympus XLUMPLFLN ( 20 × , NA 1.0), Olympus XLFLUOR4X underfilled to NA 0.22, and XLFLUOR4X underfilled to NA 0.11, respectively. Fig. 8 Experimental FOV and resolution measurements. (a) Normalized fluorescence signal measured across the FOV using the high-throughput relay shown in Fig. 6 – 7 and the Olympus XLUMPLFLN (20X, NA 1.0). (b) Same as (a), but for Olympus XLFLUOR4X with rear aperture underfilled to an effective NA of 0.22 (10 mm input beam diameter to microscope). (c) Same as (a)-(b), but for Olympus XLFLUOR4X with rear aperture underfilled to an effective NA of 0.11 (5 mm input beam diameter to microscope). (d) Lateral and axial cross section of PSF measured experimentally by imaging 0.5 - μ m diameter fluorescent beads embedded in agarose. Results are for high-throughput relay and NA 1.0 (Olympus XLUMPLFLN). Beads were imaged both on and off axis as specified underneath cross sections. (e) Same as (d), but with the Olympus XLFLUOR4X and effective NA of 0.22. (f) Same as (d)-(e), but with rear aperture underfilled to an effective NA of 0.11. (g) Estimation of lateral resolution measured as FWHM of PSF shown in (d)-(f). (h) Same as (g), but for axial resolution. (i) Profile of lateral and axial PSF for beads imaged on axis shown in (d)–(f). (j) Same as (i), but for beads imaged off axis in the x-direction. (k) Same as (i), but for beads imaged off axis in the y-direction. The resolution was measured over the FOV by imaging 0.5 - μ m fluorescent microspheres [18859-1, Polysciences, Warrington; Figs. 8(d) – 8(h) ] embedded in a thick agarose gel. The FWHM, lateral profiles, and axial profiles of the PSF are also shown in [ Figs. 8(d) – 8(k) ]. As expected, underfilling the objective enables larger field imaging but worsens the resolution, especially axially in comparison with the Olympus XLUMPLFLN. However, our optimal design (XLFLUOR4X underfilled to NA 0.22) can achieve a SBP of 35MP, which is 3.2 times more than what can be achieved with a conventional TPM system ( Table 1 ). The lateral and axial resolutions of the LF-TPM system over the 7-mm-diameter FOV are < 1.7 and < 28 μ m , respectively. This demonstrates the performance and range of imaging fields achievable with these relay lenses, galvanometer, and objective. Table 1 Imaging capabilities of isolated objectives, conventional TPM, and LF-TPM. Lateral resolution for conventional TPM with pixel averaging is effective resolution, not optical resolution. For LF-TPM, the theoretical and experimental lateral resolution are included.
Objective or system NA
Lateral resolution ( μ m ) FOV diameter ( Ø mm ) Rectangular FOV ( mm × mm ) Pixels for rectangular FOV FOV area ( mm 2 ) SBP (MP) Olympus XLFLUOR4X 0.28 1.08 6.63 4.69 × 4.69 8709 × 8709 21.98 75.85 Olympus XLUMPLFLN 20X 1 0.31 1.10 0.78 × 0.78 5081 × 5081 0.61 25.82 Conventional TPM 1 0.31 0.71 0.50 × 0.50 3280 × 3280 0.25 10.76 Conventional TPM (pixel averaging) 1 1.96 0.71 0.50 × 0.50 512 × 512 0.25 0.26 LF-TPM system 0.22 1.37/1.68 7.00 4.95 × 4.95 5893 × 5893 24.50 34.72 For completeness, we also conducted fluorescein and microsphere imaging with the Olympus MVPLAPO 2XC but measured worse resolution off axis than what was achieved with the Olympus XLFLUOR4X (Appendix D ). In Vivo Applications of LF-TPM: Imaging the Cerebral Vasculature and Microglia Cell Bodies After experimental validation of the system, we performed in vivo imaging of the mouse cerebral vasculature and microglia ( Fig. 9 ). To image the cerebral micro-architecture, we removed an ∼ 9 - mm -diameter portion of the mouse skull. 29 , 30 The full surgical procedure is described in Appendix E . We then imaged the cerebral vasculature in male C57BL6 mice after tail vein injection of fluorescein-dextran and the microglia in mice with GFP knocked-in to the Cx3Cr1 locus ( Cx 3 Cr 1 GFP + / − ). Fig. 9 Cerebral vasculature and microglia imaged over the mouse cortex with LF-TPM. (a) Maximum projection image of cerebral vessels imaged with LF-TPM after tail vein injection of fluorescein-dextran. Dimensions of the box are 8 × 8 mm 2 . (b) 1 × 1 mm 2 FOV imaged 3-mm off axis at orange box shown in (a). (c) 1 × 1 mm 2 FOV imaged 3-mm off axis at blue box in (a). (d) 500 × 500 μ m 2 FOV highlighted by dashed blue box in (c). (e) 1 × 1 mm 2 FOV imaged 3-mm off axis at green box shown in (a). (f) 1 × 1 mm 2 FOV imaged 3-mm off axis at red box shown in (a). (g) 500 × 500 μ m 2 FOV highlighted by dashed red box in (f). (h)–(n) Same as (a)–(g), but for microglia imaged in Cx 3 Cr 1 GFP + / − mice . To maximize the information transmitted by our system, we imaged the mouse cortex under optimal system conditions (i.e., XLFLUOR4X underfilled to NA 0.22, SBP approximately 35MP). Due to the large relatively flat field and axial sectioning of the microscope, the curvature of the mouse brain poses a challenge: the image plane is not perpendicular to the surface of the mouse brain over the FOV. Thus, fluorescence signal measured in a single frame is only over an elliptic region of the brain that depends on how the objective front focal plane intersects with the mouse brain. To image over the entire FOV, the brain was scanned axially by moving the mouse on a motorized stage (MLJ050, Thorlabs). Each image was scanned at a 50-Hz line rate. Most of the images were scanned with 1000 lines for a slice acquisition time of ∼ 20 s . The translation time between axial positions was ∼ 1 s and therefore did not contribute significantly to total acquisition time. To demonstrate the capabilities of the system, we scanned both low-resolution scans of the full FOV [ Figs. 9(a) and 9(h) ; 8 × 8 mm 2 , 1000 × 1000 pixels ] and high-resolution scans of smaller fields 3 mm off axis [ Figs. 9(b) – 9(e) and 9(i) – 9(l) ; 1 × 1 mm 2 , 1000 × 1000 pixels ]. Also included are images with a FOV similar to conventional TPM [ Figs. 9(f) and 9(g) and 9(m) – 9(n) ; 500 × 500 μ m 2 , 500 × 500 pixels ]. For all imaging, the mouse remained in the same lateral ( x , y ) position relative to the objective without tracking motion. We also calculated the FWHM of capillary vessel diameters to determine resolution capabilities of our system for in vivo applications. The system was able to image vessel diameters as small as 3 μ m over the entire FOV, as well as ∼ 22,500 microglia with a cell body diameter of ∼ 5 μ m over the cortex of Cx 3 Cr 1 GFP + / − mice .
Experimental Validation with Fluorescein and Fluorescent Microspheres
We tested the performance of our system experimentally by placing fluorescein at the sample plane and measuring the fluorescence signal over the FOV with the Olympus XLFLUOR4X underfilled to either NA 0.22 (i.e., input beam diameter to galvo of 10 mm) or NA 0.11 (i.e., input beam diameter to galvo of 5 mm) [ Figs. 8(b) and 8(c) ]. For reference, we also measured the fluorescence signal using a 20 × objective with the same high-throughput relay system [ Fig. 8(a) ]. The fluorescence signal remained above 0.4 times the maximum over FOV diameters of 1.4, 7, and 9 mm with the Olympus XLUMPLFLN ( 20 × , NA 1.0), Olympus XLFLUOR4X underfilled to NA 0.22, and XLFLUOR4X underfilled to NA 0.11, respectively. Fig. 8 Experimental FOV and resolution measurements. (a) Normalized fluorescence signal measured across the FOV using the high-throughput relay shown in Fig. 6 – 7 and the Olympus XLUMPLFLN (20X, NA 1.0). (b) Same as (a), but for Olympus XLFLUOR4X with rear aperture underfilled to an effective NA of 0.22 (10 mm input beam diameter to microscope). (c) Same as (a)-(b), but for Olympus XLFLUOR4X with rear aperture underfilled to an effective NA of 0.11 (5 mm input beam diameter to microscope). (d) Lateral and axial cross section of PSF measured experimentally by imaging 0.5 - μ m diameter fluorescent beads embedded in agarose. Results are for high-throughput relay and NA 1.0 (Olympus XLUMPLFLN). Beads were imaged both on and off axis as specified underneath cross sections. (e) Same as (d), but with the Olympus XLFLUOR4X and effective NA of 0.22. (f) Same as (d)-(e), but with rear aperture underfilled to an effective NA of 0.11. (g) Estimation of lateral resolution measured as FWHM of PSF shown in (d)-(f). (h) Same as (g), but for axial resolution. (i) Profile of lateral and axial PSF for beads imaged on axis shown in (d)–(f). (j) Same as (i), but for beads imaged off axis in the x-direction. (k) Same as (i), but for beads imaged off axis in the y-direction. The resolution was measured over the FOV by imaging 0.5 - μ m fluorescent microspheres [18859-1, Polysciences, Warrington; Figs. 8(d) – 8(h) ] embedded in a thick agarose gel. The FWHM, lateral profiles, and axial profiles of the PSF are also shown in [ Figs. 8(d) – 8(k) ]. As expected, underfilling the objective enables larger field imaging but worsens the resolution, especially axially in comparison with the Olympus XLUMPLFLN. However, our optimal design (XLFLUOR4X underfilled to NA 0.22) can achieve a SBP of 35MP, which is 3.2 times more than what can be achieved with a conventional TPM system ( Table 1 ). The lateral and axial resolutions of the LF-TPM system over the 7-mm-diameter FOV are < 1.7 and < 28 μ m , respectively. This demonstrates the performance and range of imaging fields achievable with these relay lenses, galvanometer, and objective. Table 1 Imaging capabilities of isolated objectives, conventional TPM, and LF-TPM. Lateral resolution for conventional TPM with pixel averaging is effective resolution, not optical resolution. For LF-TPM, the theoretical and experimental lateral resolution are included.
Objective or system NA
Lateral resolution ( μ m ) FOV diameter ( Ø mm ) Rectangular FOV ( mm × mm ) Pixels for rectangular FOV FOV area ( mm 2 ) SBP (MP) Olympus XLFLUOR4X 0.28 1.08 6.63 4.69 × 4.69 8709 × 8709 21.98 75.85 Olympus XLUMPLFLN 20X 1 0.31 1.10 0.78 × 0.78 5081 × 5081 0.61 25.82 Conventional TPM 1 0.31 0.71 0.50 × 0.50 3280 × 3280 0.25 10.76 Conventional TPM (pixel averaging) 1 1.96 0.71 0.50 × 0.50 512 × 512 0.25 0.26 LF-TPM system 0.22 1.37/1.68 7.00 4.95 × 4.95 5893 × 5893 24.50 34.72 For completeness, we also conducted fluorescein and microsphere imaging with the Olympus MVPLAPO 2XC but measured worse resolution off axis than what was achieved with the Olympus XLFLUOR4X (Appendix D ).
📊 Figures
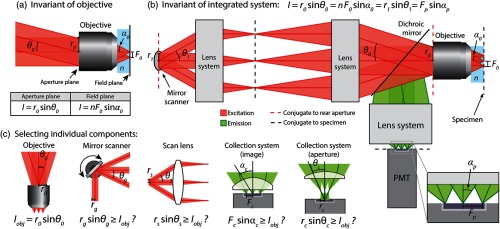
Fig. 1
Optical invariant in laser scanning two-photon microscopy. (a)u00a0Optical invariant defined at aperture plane and field plane of isolated objective lens. A collimated beam with radius r o is directed...
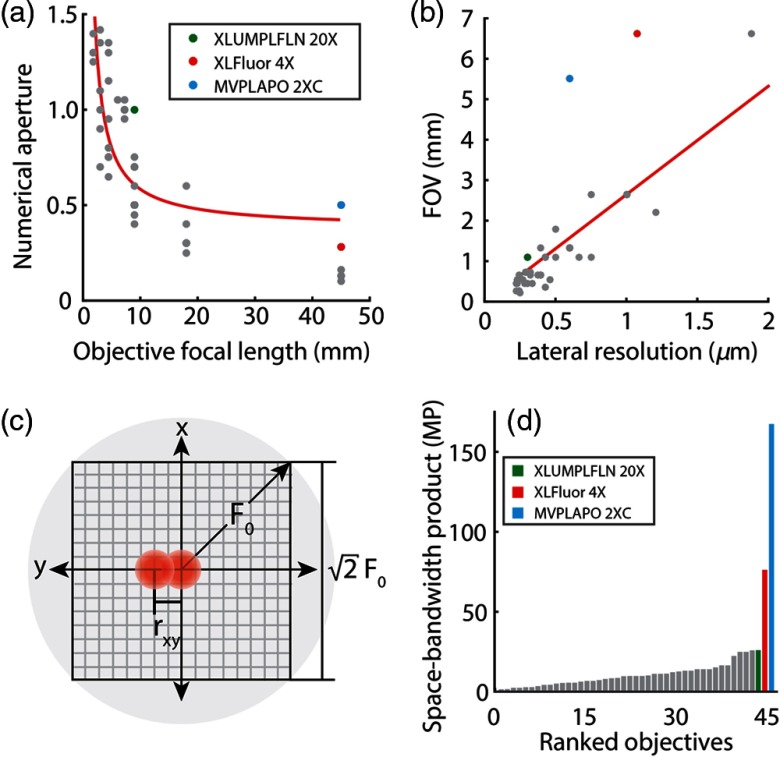
Fig. 2
Selecting objective lenses for LF-TPM. (a)u00a0Numerical aperture plotted against objective focal length for 45 commercially available Olympus objectives. Red curve is the best fit for the NAu2019s in...
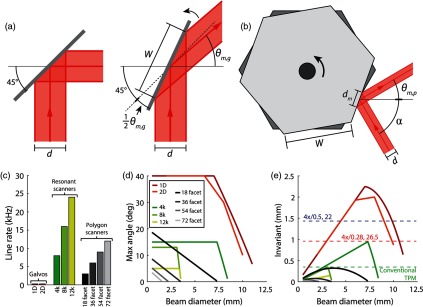
Fig. 3
Evaluating performance of mirror scanners. (a)u00a0Diagram of galvanometer or resonant scanner with input beam diameter d . Given d and the clear aperture of the galvanometer W , the maximum scan angl...
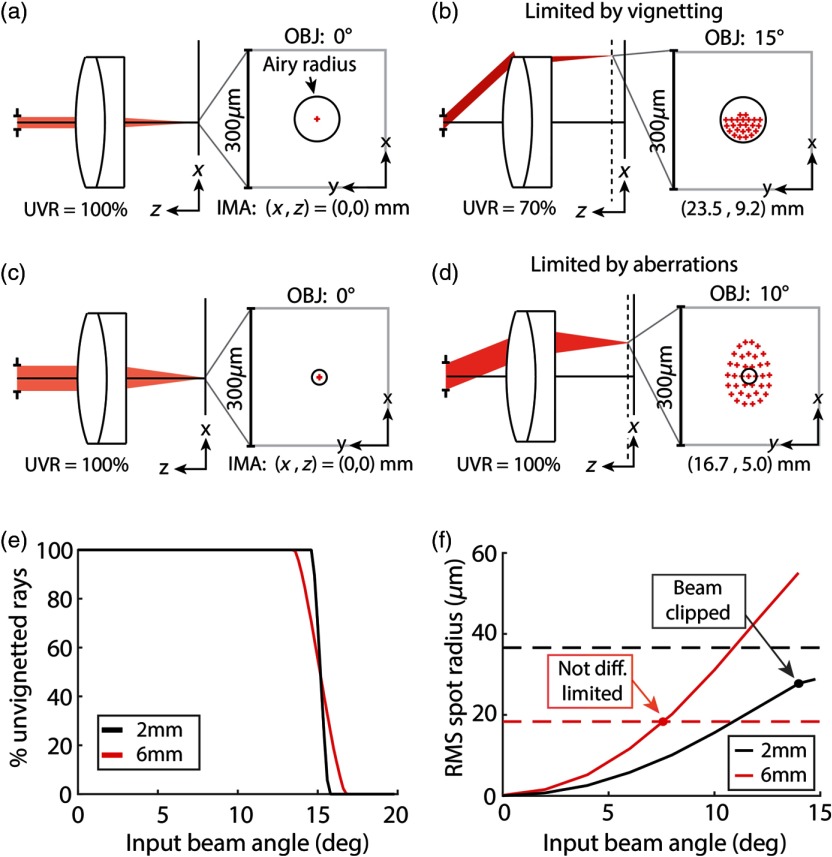
Fig. 4
Optical aberrations or vignetting limit the optical throughput of relay lenses. (a)u00a0Layout and spot diagram of achromatic doublet (AC508-100-B, Thorlabs) modeled in Zemax. The 2-mm-diameter beam i...
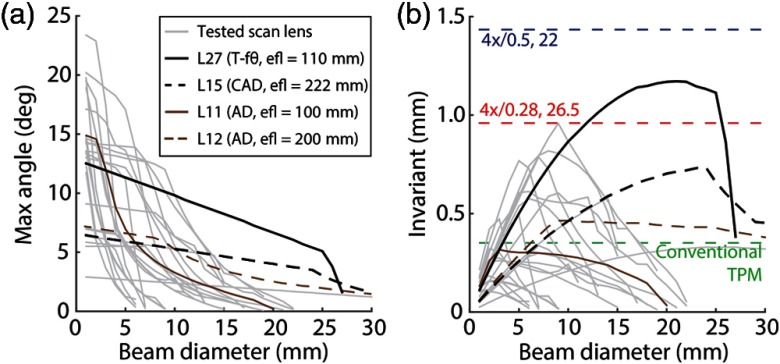
Fig. 5
Performance of commercially available relay lenses. (a)u00a0Max scan angle as a function of input beam diameter for 27 relay lenses modeled in Zemax. Max scan angle is limited by either vignetting or ...
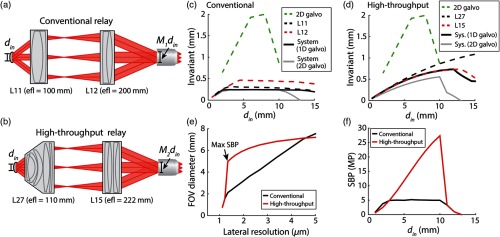
Fig. 6
Comparison of integrated scanning systems for conventional TPM and LF-TPM. (a)u00a0Schematic of conventional scanning system consisting of two achromatic doublets with effective focal length equal to ...
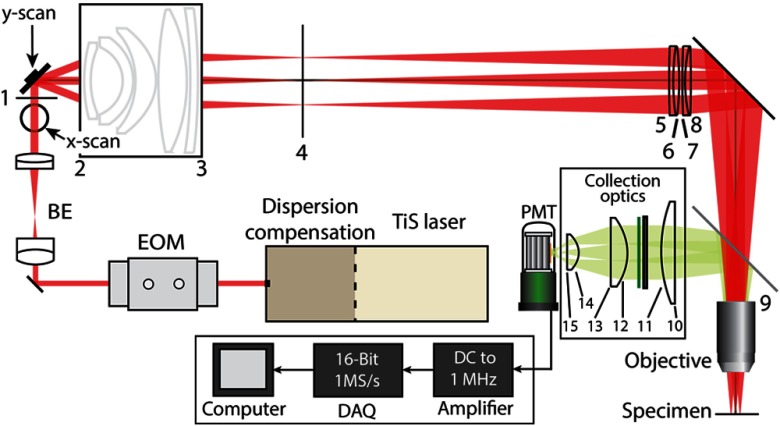
Fig. 7
LF-TPM system schematic. Pulsed light from TiSapphire (TiS) laser is directed to the input of the microscope. Laser intensity and dispersion are controlled with an electro-optic modulator (EOM) and di...
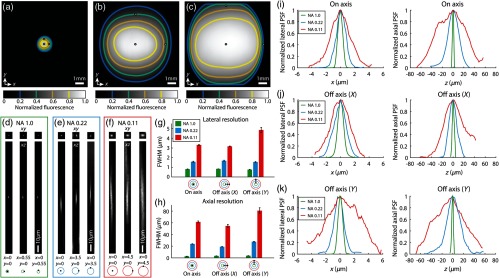
Fig. 8
Experimental FOV and resolution measurements. (a)u00a0Normalized fluorescence signal measured across the FOV using the high-throughput relay shown in Fig.u00a06 u2013 7 and the Olympus XLUMPLFLN (20X,...
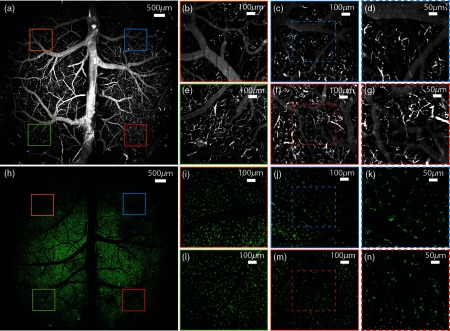
Fig. 9
Cerebral vasculature and microglia imaged over the mouse cortex with LF-TPM. (a)u00a0Maximum projection image of cerebral vessels imaged with LF-TPM after tail vein injection of fluorescein-dextran. D...
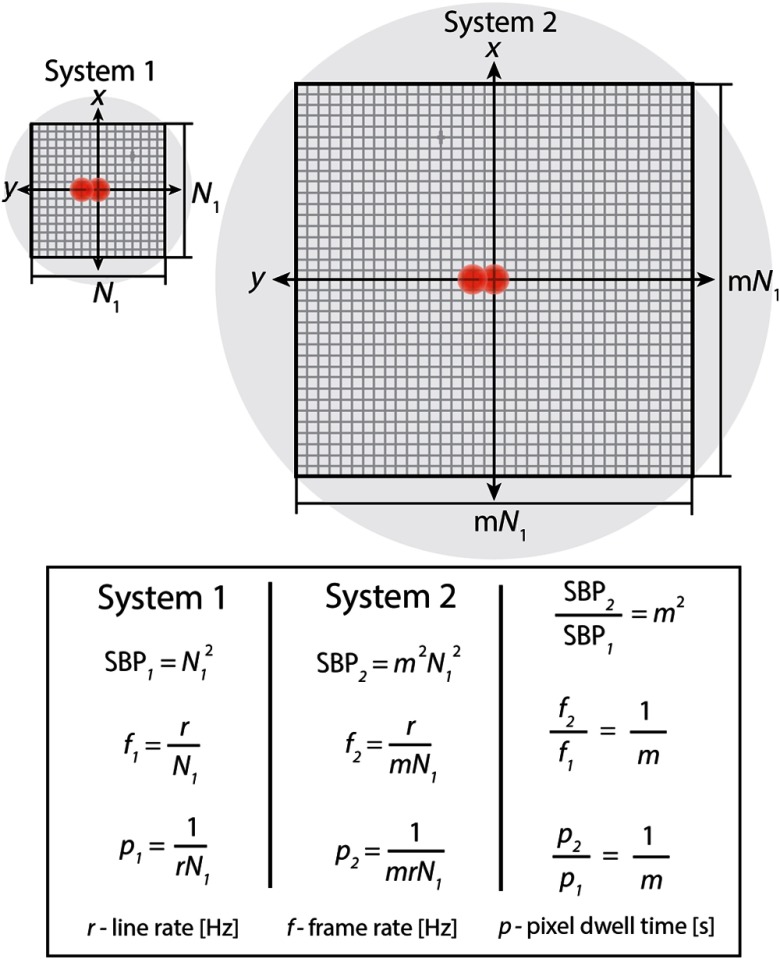
Fig. 10
Differences in frame rate and pixel dwell time for systems with different SBP. System 1 resolution and FOV require N 1 lines to sufficiently sample FOV. System 2 resolution and FOV require a factor of...
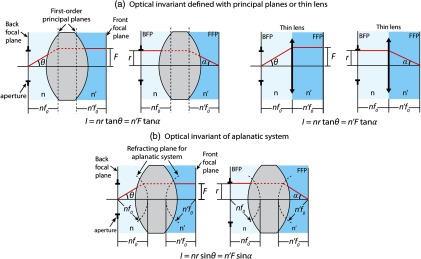
Fig. 11
Definition of optical invariant. (a)u00a0Optical system with effective focal length f 0 modeled with first-order principal planes. The refractive indices in image and object space are labeled as n and...
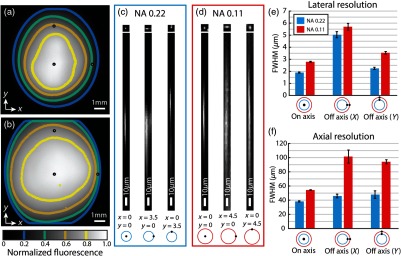
Fig. 12
Experimental FOV and resolution measurements for MVPLAPO 2XC. (a)u00a0Normalized fluorescence measured with high-throughput relay shown in Figs.u00a06 and 7 and the MVPLAPO 2XC with rear aperture unde...
Figure images are served from the NIH/NLM PubMed Central Open Access Subset or Europe PMC; copyright remains with the publishers and authors.
💬 Discussion
0 commentsNo comments yet. Be the first to start a discussion!
Leave a Comment