Abstract
Neuroinflammation plays a central role in the neuropathogenesis of a wide-spectrum of neurologic and psychiatric disease, but current neuroimaging methods to detect and characterize neuroinflammation are limited. We explored the sensitivity of quantitative multi-compartment diffusion MRI, and specifically neurite orientation dispersion and density imaging (NODDI), to detect changes in microglial density in the brain. Monte Carlo simulations of water diffusion using a NODDI acquisition scheme were performed to measure changes in a virtual MRI signal following modeled cellular changes within the extra-neurite space. 12-week-old C57BL/6J male mice (n = 48; 24 control, 24 treated with colony stimulating factor 1 receptor (CSF1R) inhibitor, PLX5622) were sacrificed at 0, 1, 3, and 7 days following withdrawal of CSF1R inhibition and were imaged ex-vivo to obtain measures of the orientation dispersion index (ODI). Following imaging, all brains were immunostained with Iba-1, NeuN, and GFAP for quantitative fluorescence microscopy. Cell populations were calculated with the ImageJ particle analyzer tool; correlation between microglial density and mean ODI values were calculated with Kendall's tau. Monte Carlo simulations demonstrate the sensitivity and positive correlation of ODI to increased occupancy in the extra-neurite space. Commensurate with our simulation data, ex-vivo NODDI imaging demonstrates an increase in ODI as microglia repopulate the brain following the withdrawal of CSF1R inhibition. Quantitative immunofluorescence of microglial density reveals that microglial density is positively correlated with ODI and greater hindered diffusion in the extra-neurite space (τ = 0.386, p < 0.05). Our results demonstrate that clinically feasible multi-compartment diffusion weighted imaging techniques such as NODDI are sensitive to microglial density and the cellular changes associated with microglial activation and highlights its potential to improve clinical diagnostic accuracy, patient risk stratification, and therapeutic monitoring of neuroinflammation in neurologic and psychiatric disease.
🔬 Techniques
🔭 Microscopes
✨ Fluorophores
🧪 Sample Preparation
🔬 Cell Lines
🏭 Microscope Brands
🧪 Reagent Suppliers
💻 Software Details
🏛️ Research Organizations (ROR)
Affiliated research institutions:
📋 Methods
Theory and in silico Simulation
Multi-compartment diffusion models biophysically model the total DWI signal as a sum of the diffusion weighted signal arising from a combination of biophysical compartments with different underlying cellular microstructures: (1) S = S 0 ∑ i = 0 n w i S i where S 0 is the signal for the non-diffusion weighted (or b 0) acquisitions, w i the volume fraction and S i the signal function for the ith of n total compartments (Harms et al., 2017 ). In the NODDI model, the diffusion MRI signal is described as a sum of three non-exchanging biophysical compartments: (2) S = ( 1 - v i s o ) ( v i c S i c + ( 1 - v i c ) S e c ) + v i s o S i s o where S is the entire normalized signal; S ic , S ec , and S iso are the normalized signals of the intracellular, extracellular, and CSF compartments, respectively, and ν ic and ν iso are the normalized volume fractions of the intracellular and CSF compartments (Zhang H. et al., 2012 ). To test how cellular changes in the extra-neurite space (microglial density) impacts the measured diffusion signal from the extra-neurite space (ODI, orientation dispersion index), an in silico diffusion experiment using multiple Monte Carlo random walk simulations as implemented in Camino 1 (Hall and Alexander, 2009 ) was performed by varying the number of modeled cells in the extra-neurite space. To generate the components of the multi-compartment diffusion model, basic geometrical components representing white matter axons and microglia were constructed in Blender (Blender Foundation, Amsterdam, Netherlands). We constructed a series of 6 undulating cylinders (with no dispersion) modeling axons in a similar manner as previously described (Kamiya et al., 2017 ) with radius = 1 μm, length = 40 μm, undulation amplitude A = 2, to yield a final λ = 1.024 to simulate a voxel in a white matter tract. Icospheres were next modeled as simplified microglia in the extra-neurite space and were generated with a radius = 5 μm (Kozlowski and Weimer, 2012 ). The cylinders were then hexagonally packed without touching within the simulated volume (40 × 40 × 40 μm) with all components placed within the model in MatLab (version 2015a, MathWorks, Natick, MA, USA). 10 simulations of 0, 5, 15, and 25 spheres were performed with spheres randomly distributed throughout the extra-neurite space of the modeled volume. The volume fraction of the bundled axons is 2.7%; the volume fraction of the spheres is 6.3%, 18.9%, and 31.5% for 5, 15, and 25 spheres, respectively. Each simulation comprised of 100,000 spins and 5,000 time steps. The free diffusivity was set at 0.6 × 10 −9 m 2 /s per recommendations in Camino (Cook et al., 2006 ). From the simulated random walks of particles, a virtual MRI signal was obtained using the NODDI acquisition scheme used in our ex-vivo samples with the addition of Gaussian noise to the simulated signal with SNR = 50 of the b = 0 signal for each run. The mean ODI was calculated for each simulation. Diffusion tensor indices of fractional anisotropy (FA) and mean diffusivity (MD) were also calculated.
Show full methods section
Theory and in silico Simulation
Multi-compartment diffusion models biophysically model the total DWI signal as a sum of the diffusion weighted signal arising from a combination of biophysical compartments with different underlying cellular microstructures: (1) S = S 0 ∑ i = 0 n w i S i where S 0 is the signal for the non-diffusion weighted (or b 0) acquisitions, w i the volume fraction and S i the signal function for the ith of n total compartments (Harms et al., 2017 ). In the NODDI model, the diffusion MRI signal is described as a sum of three non-exchanging biophysical compartments: (2) S = ( 1 - v i s o ) ( v i c S i c + ( 1 - v i c ) S e c ) + v i s o S i s o where S is the entire normalized signal; S ic , S ec , and S iso are the normalized signals of the intracellular, extracellular, and CSF compartments, respectively, and ν ic and ν iso are the normalized volume fractions of the intracellular and CSF compartments (Zhang H. et al., 2012 ). To test how cellular changes in the extra-neurite space (microglial density) impacts the measured diffusion signal from the extra-neurite space (ODI, orientation dispersion index), an in silico diffusion experiment using multiple Monte Carlo random walk simulations as implemented in Camino 1 (Hall and Alexander, 2009 ) was performed by varying the number of modeled cells in the extra-neurite space. To generate the components of the multi-compartment diffusion model, basic geometrical components representing white matter axons and microglia were constructed in Blender (Blender Foundation, Amsterdam, Netherlands). We constructed a series of 6 undulating cylinders (with no dispersion) modeling axons in a similar manner as previously described (Kamiya et al., 2017 ) with radius = 1 μm, length = 40 μm, undulation amplitude A = 2, to yield a final λ = 1.024 to simulate a voxel in a white matter tract. Icospheres were next modeled as simplified microglia in the extra-neurite space and were generated with a radius = 5 μm (Kozlowski and Weimer, 2012 ). The cylinders were then hexagonally packed without touching within the simulated volume (40 × 40 × 40 μm) with all components placed within the model in MatLab (version 2015a, MathWorks, Natick, MA, USA). 10 simulations of 0, 5, 15, and 25 spheres were performed with spheres randomly distributed throughout the extra-neurite space of the modeled volume. The volume fraction of the bundled axons is 2.7%; the volume fraction of the spheres is 6.3%, 18.9%, and 31.5% for 5, 15, and 25 spheres, respectively. Each simulation comprised of 100,000 spins and 5,000 time steps. The free diffusivity was set at 0.6 × 10 −9 m 2 /s per recommendations in Camino (Cook et al., 2006 ). From the simulated random walks of particles, a virtual MRI signal was obtained using the NODDI acquisition scheme used in our ex-vivo samples with the addition of Gaussian noise to the simulated signal with SNR = 50 of the b = 0 signal for each run. The mean ODI was calculated for each simulation. Diffusion tensor indices of fractional anisotropy (FA) and mean diffusivity (MD) were also calculated.
Animals and Reagents
All experiments were performed in accordance with animal protocols approved by the Institutional Animal Care and Use Committee at our institution (Protocol #: M005899). 12-week-old C57BL/6J male mice (Charles River Laboratories, MA, USA) were used for all experiments and were randomly assigned to control or experimental CSF1R inhibition cohorts. Control animals were maintained on AIN-76A standard chow (Research Diets, NJ, USA); animals receiving CSF1R inhibition received AIN-76A admixed with the CSF1R inhibitor PLX5622 (Plexxikon, CA, USA; 1,200 mg/kg) as previously described (Elmore et al., 2014 ). Animals receiving CSF1R inhibition were maintained on their admixed diet for 8-days; on day 8, CSF1R inhibition was withdrawn by replacing their chow with standard chow (AIN-76A). For each time point, mice from the control and the experimental groups were sacrificed on days 0, 9, 11, and 15 ( n = 48; n = 6, each time point; control and experimental).
MRI Acquisition Data Acquisition
On days 0, 9, 11, and 15, mice were brought to a surgical plane of anesthesia with isoflurane then transcardially perfused with phosphate-buffered solution (PBS) followed by 4% paraformaldehyde (PFA) in 0.1 M PBS. Brains were extracted from the cranial vault and post-fixed in PFA. Imaged brains were placed in a custom-built holder immersed in Fluorinert (FC-3283, 3M, St. Paul, MN, USA) and imaged with a 4.7-T Agilent MRI system with a 3.5-cm diameter quadrature volume RF coil. Multi-slice, diffusion-weighted, spin echo images were used to acquire 10 non-diffusion weighted images (b = 0 s∙mm −2 ) and 75 diffusion-weighted images (25: b = 800 s∙mm −2 , 50: b = 2,000 s∙mm −2 ), using non-colinear diffusion-weighting directions. Other imaging parameters: TE/TR = 24.17/2000-ms, FOV = 30 × 30 mm 2 , matrix = 192 × 192 reconstructed to 256 × 256 for an isotropic voxel size of 0.25-mm over two signal averages. All animals were used in subsequent analyses.
Data
Preprocessing and Region of Interest (ROI) Analysis Raw data files were converted to NIfTI format and FSL was used to correct for eddy current artifacts with Eddy-correct. FSL output volumes were converted to NIfTI tensor format for use with the DTI-TK software package. DTI-TK (Zhang et al., 2006 ) was used to estimate a study-specific tensor template, to which subject tensor volumes were spatially normalized. The NODDI model was then voxel-wise fitted to the diffusion data in Matlab (The MathWorks, Inc., Natick, MA) with the NODDI toolbox 2 . An additional compartment of isotropic restriction was employed for ex-vivo studies as recommended (Alexander et al., 2010 ). A manual ROI was drawn over the left dentate gyrus from anatomically defined areas on a normalized mean diffusion map. The ROI was overlaid over subjects from each of the two groups (± CSF1R treatment) and ODI, FA, and MD were calculated.
Immunofluorescent Staining and Quantification
Following imaging, brains were removed from their custom holders and were returned to ice-cold 4% PFA for 24 h, then in a 30% sucrose solution (Alfa Aesar, Ward Hill, MA; Cat# 36508) in 0.1 M PBS (Growcells, Irvine, CA; Cat# MRGF-6235). Frozen coronal sections were taken at 40 μm using a cryostat (Leica CM 1850, Wetzlar, Germany) and stored short-term in PBS at 4°C until staining. Floating sections were incubated in blocking solution formulated with 0.1 M PBS, 2% bovine serum albumin (Fisher Scientific, Hampton, NH; Cat# BP9706-100) and 0.1% sodium azide (Sigma, St. Louis, MO; Cat# S2002) for 1 h at room temperature (RT), then incubated overnight at 4C with primary antibodies for Iba-1 (rabbit Anti-Iba-1, dilution 1:2000, Abcam, Cambridge, MA, Cat # AB178847 ), NeuN (chicken Anti-NeuN, dilution 1:1500; EMD Millipore, Billerica, MA Cat# ABN91MI), and GFAP (mouse Anti-GFAP, dilution 1:1000; Thermo Fisher Scientific, Waltham, MA Cat# PIMA512023). Sections were incubated for 1 h at RT with the corresponding Alexa 488-, 555-, 647-labeled species specific secondary antibodies (goat anti-rabbit, Abcam, Cambridge, MA, Cat# AB150077 ; goat anti-chicken, Thermo Fisher Scientific, Waltham, MA former Invitrogen Cat# A-21437; goat anti-mouse, Abcam, Cambridge, MA, Cat# AB150115 ; all diluted at 1:2000). Sections were counterstained with 0.1 μm/mL 4',6-diamidino-2-phenylindole (DAPI) (Novus Biologicals, Littleton, CO; Cat# NBP2-31156) for 5 min at RT, then mounted with Fluoromount-G (Southern Biotech, Birmingham, AL, Cat# 0100-01). Images of the left hippocampus were acquired with a Leica DMi8 Inverted Fluorescent microscope (Wetzlar, Germany) with a 10x dry objective lens. All microscopy images were analyzed using ImageJ. The Region of Interest (ROI) manager tool was used to isolate the hippocampus. Images were made binary via manual thresholding, then the Particle Analyzer tool was used to automatically count cells.
Statistical Analysis
Imaging sample sizes and power analyses are based on standard deviations from previous studies with a significance level of 5% and power of 90% (Ong et al., 2018 ). Statistical tests were performed in GraphPad Prism or R. Analysis of cell counts between control and CSF1R-inhibitor diet were performed using a two-tailed unpaired Student's t -test; p < 0.05 was established as the significance level. Kendall's tau coefficient was calculated to measure the non-parametric, ordinal association between microglial cell counts and mean ODI from three time-points in CSF1R administered animals.
Supplementary Material The Supplementary Material for this article can be found online at: https://www.frontiersin.org/articles/10.3389/fnins.2019.00081/full#supplementary-material Click here for additional data file.
📊 Figures
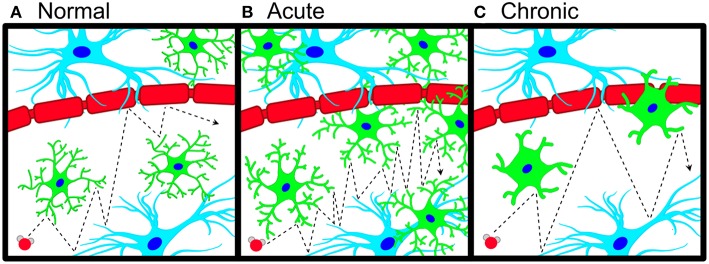
Figure 1
Schematic of microglial neuroinflammation and accompanying changes in water diffusion. (A) Pictorial representation of anisotropic water diffusion (red sphere) in the extra-neurite environment in the ...
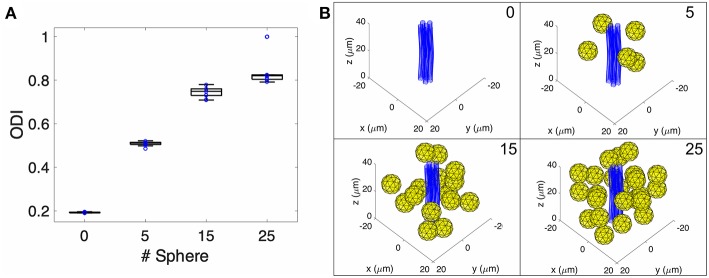
Figure 2
Monte-Carlo NODDI diffusion MRI simulation. (A) Box plot of pulsed gradient water diffusion simulations within a representative voxel were performed with 0, 5, 15, and 25 spheres present (representing...
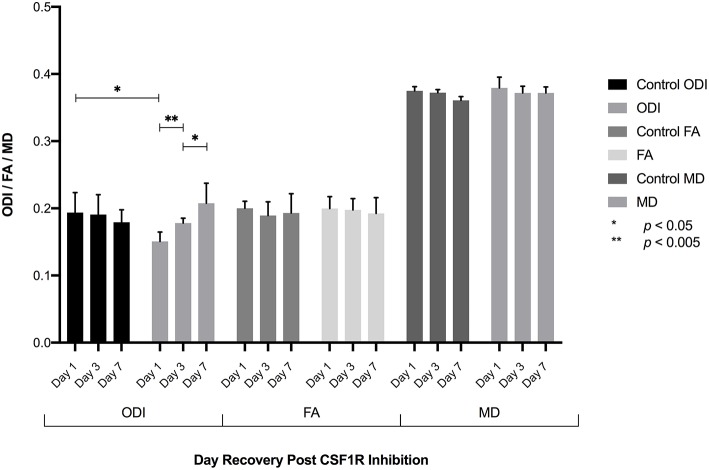
Figure 3
Following the elimination of microglia, CSF1R inhibition was withdrawn allowing microglia to repopulate the brain. ROI analysis of the dentate gyrus 1, 3, and 7 days following inhibitor withdrawal dem...
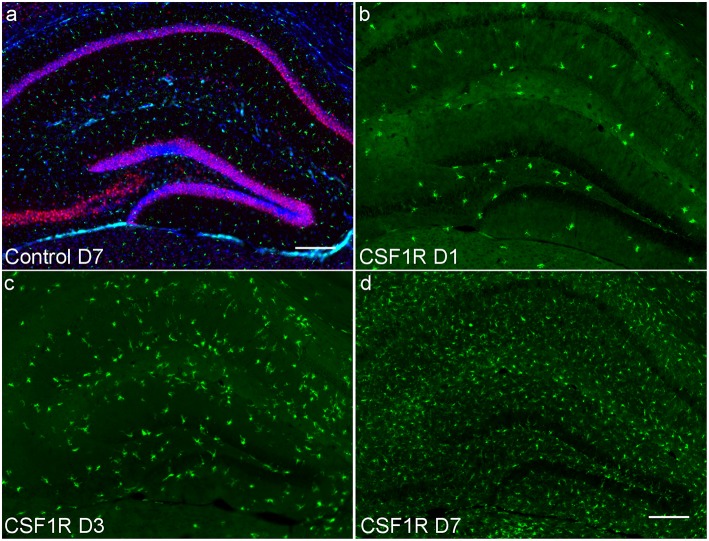
Figure 4
Hippocampal photomicrographs (10X) representative of C57BL/6J mice during microglial repopulation. (a) Representative control animal immunostained with antibodies for neurons (anti-NeuN, red), microgl...
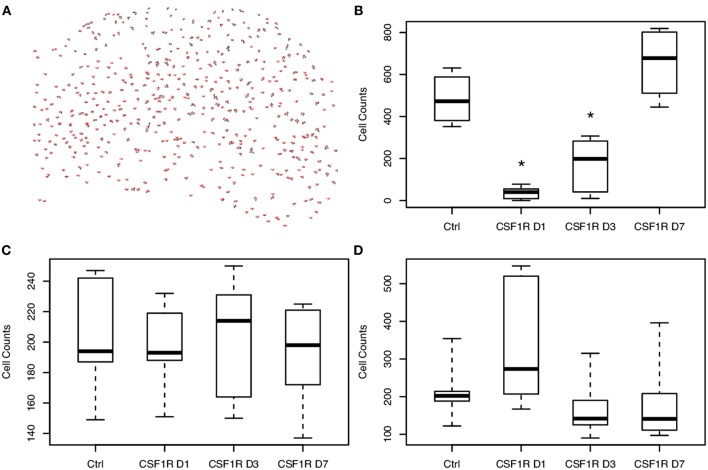
Figure 5
Analysis of cellular density show temporally-dependent increase in microglial density following CSF1R inhibitor withdrawal. (A) Representative image of microglial counts from the hippocampus of a cont...
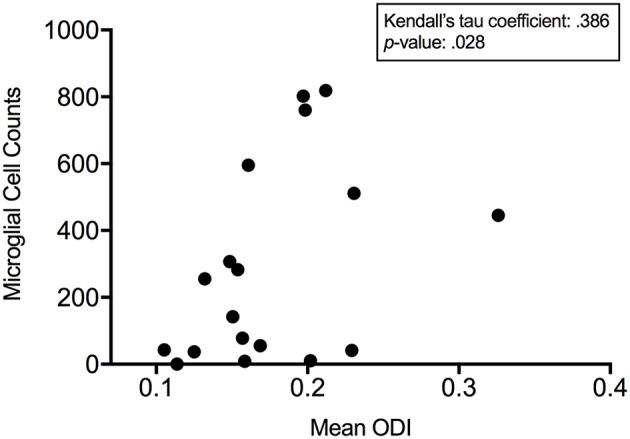
Figure 6
ODI is positively correlated to microglial density. Kendall's tau demonstrates a significant association between measured microglial cell counts and mean orientation dispersion index 1, 3, and 7 days ...
Figure images are served from the NIH/NLM PubMed Central Open Access Subset or Europe PMC; copyright remains with the publishers and authors.
💬 Discussion
0 commentsNo comments yet. Be the first to start a discussion!
Leave a Comment