Abstract
Skeletal muscle contraction depends on the release of Ca(2+) from the sarcoplasmic reticulum (SR), but the dynamics of the SR free Ca(2+) concentration ([Ca(2+)](SR)), its modulation by physiological stimuli such as catecholamines, and the concomitant changes in cAMP handling have never been directly determined. We used two-photon microscopy imaging of GFP-based probes expressed in mouse skeletal muscles to monitor, for the first time in a live animal, the dynamics of [Ca(2+)](SR) and cAMP. Our data, which were obtained in highly physiological conditions, suggest that free [Ca(2+)](SR) decreases by approximately 50 microM during single twitches elicited through nerve stimulation. We also demonstrate that cAMP levels rise upon beta-adrenergic stimulation, leading to an increased efficacy of the Ca(2+) release/reuptake cycle during motor nerve stimulation.
🔬 Techniques
💻 Software
✨ Fluorophores
🧪 Sample Preparation
🔬 Cell Lines
🏭 Microscope Brands
🧪 Reagent Suppliers
🔎 Objectives
🎨 Filters
💻 Software Details
🏛️ Research Organizations (ROR)
Affiliated research institutions:
📋 Methods
Expression plasmids, antibodies, and chemicals Transfection experiments used the following constructs in pcDNA3 (Invitrogen): YC2, D1ER, and Epac1–cAMP sensor were gifts from R.Y. Tsien (University of California, San Diego, San Diego, CA) and M.J. Lohse (University of Würzburg, Würzburg, Germany). The A23187, ascorbic acid, CPA, digitonin, histamine, isoproterenol, and thapsigargin (all from Sigma-Aldrich) used were of the highest available grade. All injected drugs and cDNAs were diluted in sterile physiological solution (0.9% NaCl). SERCA 1 antibody (clone VE121G9) was purchased from Affinity BioReagents and Alexa Fluor 568 goat anti–mouse IgG was purchased from Invitrogen.
Animals
All experiments used C57BL/10 mice (aged 6–12 mo; Charles River Italia). Animal handling was approved by the local authority for veterinary services, in accordance with Italian law. For anesthesia, Rompun (Bayer) and Zoletil 100 (Laboratoires Virbac) were injected i.p.
Transfection
Transfection was carried out using an electroporation-based method of the TA muscle, as previously described ( Rudolf et al., 2004 ).
Slice preparation and immunohistochemistry
For immunostaining, muscles were first stretched, fixed overnight at 4°C in 4% paraformaldehyde in 0.1 M phosphate buffer (PB), and dehydrated in 10% sucrose/PB; they were then snap frozen in liquid nitrogen–cooled isopentane. The muscle was embedded in Jung tissue-freezing medium and 10-μm-thick cryosections were prepared using a cryostat (model CM1850; Leica). After drying, the sections were quenched with 50 mM NH 4 Cl/PB and permeabilized with 0.1% Triton X-100/PB. Sections were then rinsed with PB, blocked with 0.2% gelatin/PB and incubated with anti-SERCA 1 antibody (1:500, diluted in 0.2% gelatin/PB) overnight at 4°C. Sections were blocked again with 0.2% gelatin/PB and incubated with the secondary antibody (1:250, diluted in 0.2% gelatin/PB) for 2 h. Finally, the preparations were rinsed in 0.2% gelatin/PB and PB and mounted in Mowiol.
Show full methods section
Expression plasmids, antibodies, and chemicals Transfection experiments used the following constructs in pcDNA3 (Invitrogen): YC2, D1ER, and Epac1–cAMP sensor were gifts from R.Y. Tsien (University of California, San Diego, San Diego, CA) and M.J. Lohse (University of Würzburg, Würzburg, Germany). The A23187, ascorbic acid, CPA, digitonin, histamine, isoproterenol, and thapsigargin (all from Sigma-Aldrich) used were of the highest available grade. All injected drugs and cDNAs were diluted in sterile physiological solution (0.9% NaCl). SERCA 1 antibody (clone VE121G9) was purchased from Affinity BioReagents and Alexa Fluor 568 goat anti–mouse IgG was purchased from Invitrogen.
Animals
All experiments used C57BL/10 mice (aged 6–12 mo; Charles River Italia). Animal handling was approved by the local authority for veterinary services, in accordance with Italian law. For anesthesia, Rompun (Bayer) and Zoletil 100 (Laboratoires Virbac) were injected i.p.
Transfection
Transfection was carried out using an electroporation-based method of the TA muscle, as previously described ( Rudolf et al., 2004 ).
Slice preparation and immunohistochemistry
For immunostaining, muscles were first stretched, fixed overnight at 4°C in 4% paraformaldehyde in 0.1 M phosphate buffer (PB), and dehydrated in 10% sucrose/PB; they were then snap frozen in liquid nitrogen–cooled isopentane. The muscle was embedded in Jung tissue-freezing medium and 10-μm-thick cryosections were prepared using a cryostat (model CM1850; Leica). After drying, the sections were quenched with 50 mM NH 4 Cl/PB and permeabilized with 0.1% Triton X-100/PB. Sections were then rinsed with PB, blocked with 0.2% gelatin/PB and incubated with anti-SERCA 1 antibody (1:500, diluted in 0.2% gelatin/PB) overnight at 4°C. Sections were blocked again with 0.2% gelatin/PB and incubated with the secondary antibody (1:250, diluted in 0.2% gelatin/PB) for 2 h. Finally, the preparations were rinsed in 0.2% gelatin/PB and PB and mounted in Mowiol.
Confocal analysis of immunostainings
Confocal images of immunostained sections were obtained with a microscope (Radiance 2100MP; BioRad Laboratories) equipped with an Ar (488-nm line) laser and a HeNe laser (543-nm line), a 60×/1.4 NA objective (Nikon), a 560DCLPXR dichroic mirror, HQ515/30 and E570LP emission filters (Chroma Technology Corp.) for the detection of cameleon, and Alexa Fluor 568 fluorescence signals. Images were taken at 1,024 × 1,024 pixel resolution and 50 lines s −1 scan speed. In vivo two-photon microscopy This procedure was performed as previously described ( Rudolf et al., 2004 ), with minor modifications. Unless otherwise indicated, video microscopy was performed at 256 × 256 pixels with a 1.95-Hz acquisition frequency. For [Ca 2+ ] SR studies, images were acquired at 1,024 × 1,024 pixels at 166 lines s −1 . Drug injection (1 mM CPA, 100 μM CPA, or 10 μM isoproterenol + 1 mM ascorbic acid) was performed locally using a 30-gauge needle (Artsana) with a typical volume of 100 μl. To allow the muscle to recover from the injection-induced swelling, microscopic observation was interrupted for at least 5 min.
Data analysis of ratiometric images
Datasets were analyzed essentially as previously described ( Rudolf et al., 2004 ), using ImageJ software (National Institutes of Health). Fibers were oriented in the microscopic field with the longitudinal axis perpendicular to the line scan direction, matching the timeline to the long fiber axis. A mask containing the whole observed part of the fiber was created from the corresponding median-filtered YFP video by intensity thresholding. Next, both CFP and YFP videos were mean filtered (1 pixel kernel) to suppress hot pixel noise, background intensity was subtracted when necessary, and the mask was applied. For the data shown in Fig. S1, the mean CFP and YFP values were determined inside the mask region; subsequent calculations and graphs used Excel 2002 (Microsoft). Ratio plots were normalized using the last 10 images preceding the first contraction as reference values. The ratio values during single twitches, such as in Figs. 2–4 , were obtained as follows. A YFP/CFP ratio video was created by applying the custom-made ImageJ plug-in Ratio Plus. Ratio values were then determined along the fiber length in regions of interest (ROIs) with a width of 5 pixels, equaling 10-ms time frames. The background value at any ROI was calculated as the mean at that position in the 10 frames preceding the first contraction and was subtracted from the ROIs obtained during contraction using the formula: documentclass[10pt]{article} usepackage{amsmath} usepackage{wasysym} usepackage{amsfonts} usepackage{amssymb} usepackage{amsbsy} usepackage{mathrsfs} usepackage{pmc} usepackage[Euler]{upgreek} pagestyle{empty}
oddsidemargin -1.0in
begin{document} begin{equation*}{mathrm{n}}_{{mathrm{i}}+{mathrm{a}}}=({mathrm{x}}_{{mathrm{i}}+{mathrm{a}}}+m-m_{{mathrm{a}}})/m_{c}end{equation*}end{document} , where n i+a is the normalized ratio value at point i + a, x i+a is the measured ratio value at point i + a, m is the mean ratio value along the whole fiber length, and m a is the mean ratio value at point a. In Fig. 2 , m c is equal to m , whereas in Figs. 3 and 4 it is equal to m of the corresponding controls. In parallel, the relative fiber deflection was determined using the last frame before the first contraction as a blank. For the average calculations shown in Figs. 2–4 , individual twitches were synchronized by setting the first ROI with deflection as the start of contraction. For the timelines shown in Fig. 3 A , subsequent frames were treated as continuous in time; this assumption is valid because the time-lapse between the last scan line of an image and the first one of the following frame was of the same order as the jump from one line to the next in the same frame, and because contractions that initiated in one frame and continued in a following frame, appeared smooth in procedure after recomposition, as executed in Fig. 3 A . Online supplemental material Experiments showing the functionality and correction for movement artifacts of D1ER as well as a detailed description of D1ER in situ calibration are available online. Online supplemental material is available at http://www.jcb.org/cgi/content/full/jcb.200601160/DC1 .
Online supplemental material Experiments showing the functionality and correction for movement artifacts of D1ER as well as a detailed description of D1ER in situ calibration are available online. Online supplemental material is available at http://www.jcb.org/cgi/content/full/jcb.200601160/DC1 .
Supplementary Material [Supplemental Material Index]
📊 Figures
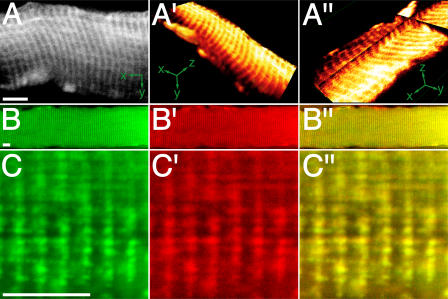
Figure 1.
D1ER is localized in the SR. TA muscle was transfected with cDNA encoding D1ER. 2 wk later, optical sections were made in situ with two-photon microscopy (Au2013Au2033) or with confocal microscopy on ...
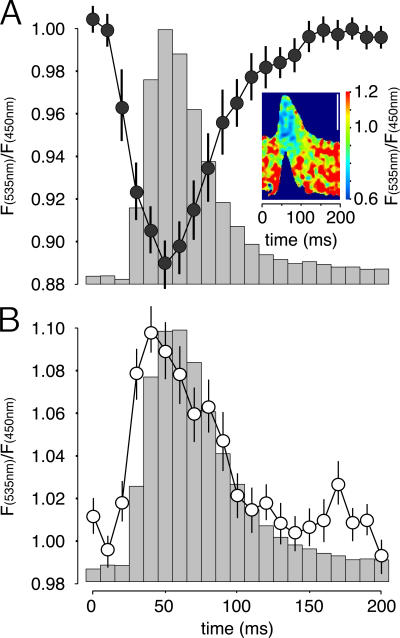
Figure 2.
D1ER reveals transient decreases of [Ca 2+ ] SR during single twitches in situ. TA muscle was transfected with cDNA encoding D1ER (A) or YC2 (B). Fluorescence signals were monitored in situ during con...
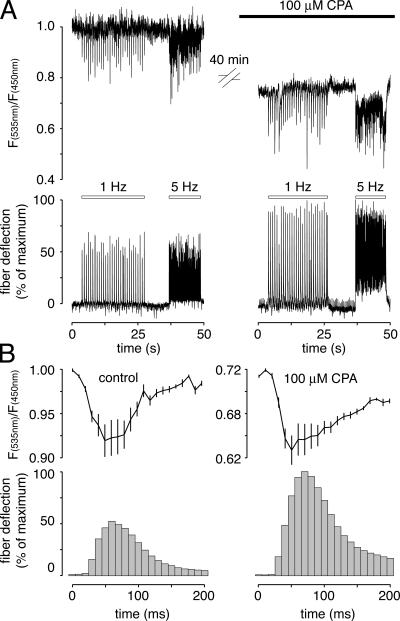
Figure 3.
Effects of partial inhibition of the SERCA. Conditions were as in Fig. 1 . (A) YFP/CFP ratio (top) and contraction profile (bottom) of a single experiment, with stimulation frequencies of 1 or 5 Hz an...
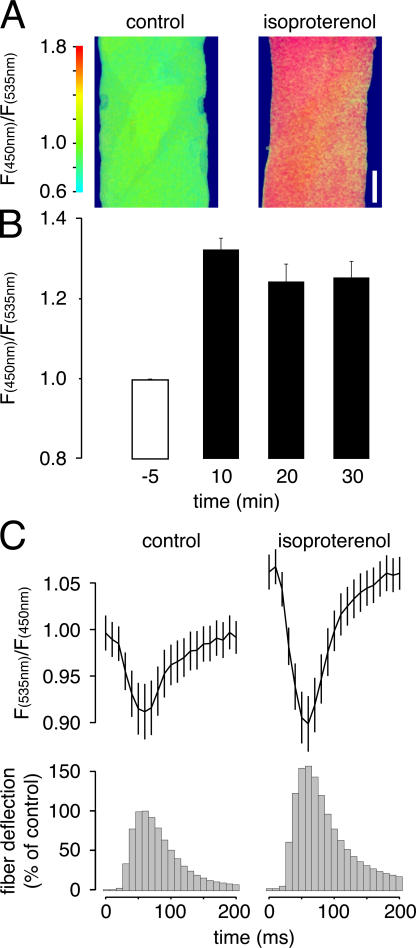
Figure 4.
In situ u03b2-adrenergic potentiation involves rise of [cAMP] and amplification of Ca 2+ release and reuptake from the SR. TA muscle was transfected with cDNA coding for Epac1u2013-cAMP sensor (A and ...
Figure images are served from the NIH/NLM PubMed Central Open Access Subset or Europe PMC; copyright remains with the publishers and authors.
💬 Discussion
0 commentsNo comments yet. Be the first to start a discussion!
Leave a Comment