Abstract
Mammalian meiocytes feature four meiosis-specific cohesin proteins in addition to ubiquitous ones, but the roles of the individual cohesin complexes are incompletely understood. To decipher the functions of the two meiosis-specific kleisins, REC8 or RAD21L, together with the only meiosis-specific SMC protein SMC1β, we generated Smc1β-/-Rec8-/- and Smc1β-/-Rad21L-/- mouse mutants. Analysis of spermatocyte chromosomes revealed that besides SMC1β complexes, SMC1α/RAD21 and to a small extent SMC1α/REC8 contribute to chromosome axis length. Removal of SMC1β and RAD21L almost completely abolishes all chromosome axes. The sex chromosomes do not pair in single or double mutants, and autosomal synapsis is impaired in all mutants. Super resolution microscopy revealed synapsis-associated SYCP1 aberrantly deposited between sister chromatids and on single chromatids in Smc1β-/-Rad21L-/- cells. All mutants show telomere length reduction and structural disruptions, while wild-type telomeres feature a circular TRF2 structure reminiscent of t-loops. There is no loss of centromeric cohesion in both double mutants at leptonema/early zygonema, indicating that, at least in the mutant backgrounds, an SMC1α/RAD21 complex provides centromeric cohesion at this early stage. Thus, in early prophase I the most prominent roles of the meiosis-specific cohesins are in axis-related features such as axis length, synapsis and telomere integrity rather than centromeric cohesion.
🔬 Techniques
✨ Fluorophores
🧪 Sample Preparation
🏭 Microscope Brands
🧪 Reagent Suppliers
💻 Software Details
🏛️ Research Organizations (ROR)
Affiliated research institutions:
📋 Methods
Mice Smc1β –/– mice have been previously described [ 32 , 33 ]. In Smc1β –/– mice, exon 10 was targeted representing 40% of the hinge domain. Generally, mice were bred and maintained in the animal facility of the Medical Faculty, Technische Universität Dresden (Dresden, Germany) according to institutional guidelines. All experiments were performed with approval by the State of Saxony. Rad21L -/- and Rec8 -/- mice were generated as described previously [ 19 , 34 ]. All mice were in the C57BL/6 genetic background. Number of mice used for the experiments: N = 5, Smc1β -/- ; N = 4, Rec8 -/- ; N = 4, Rad21L -/- ; N = 4, Smc1β -/- Rec8 -/- ; N = 4, Smc1β -/- Rad21L -/- . Single cell suspension and chromosome spreads Surface-spread chromosomes were prepared by detergent spreading adapted from Wojtasz et al. [ 35 ]. Testis was taken from the sacrificed mice and tunica albuginea was removed. Tubules were digested in 1 ml of 1 μg/ml of collagenase type I—PBS buffer for 10’ at 32°C with slight agitation. Tubules were the centrifuged to pellet the cells and excess collagenase was removed. Pellet was then resuspended in 500μl of 0.025% trypsin and incubated for 5’ at 32°C. Then 200 μl of media with FCS was added to the Single cell suspension. Cells were then filtered through 40 μm to remove the cell debris and centrifuged. Pellet was then resuspended in 300 μl of PBS. Now single cell suspension was used for the chromosome spreads. 1.5 μl of single cell suspension were dropped on 7 μl of 0.25% of NP40. Cells were allowed to lyse for 2 mins and then fixed by adding 24 μl of S fix (1% paraformaldehyde, 10 mM sodium borate buffer pH 9.2). Samples were incubated for 1 hour at room temperature in a humid chamber. Slides were dried under a hood and washed two times for one minute with 0.4% Agepon (AgfaPhoto) and another three times for one minute with water. Slides were used immediately or kept at -20°C until IF staining. Testis cryosection Testis were removed from sacrificed mice and placed in 2% (v/v) of formaldehyde/PBS for 40’ at RT for fixation before incubation in 30% sucrose/PBS overnight. Subsequently, testes were mounted in O.C.T (Sakura Finetek Europe), shock-frozen on dry ice and stored at -80°C. 8μm thick sections were made from the frozen testis, placed on the slides and dried for at least 30 min at RT. Then slides were treated with ice cold methanol for 10’ and 1’ with ice cold acetone. After completely drying, the slides were kept at –80°C or used immediately for the staining. The tubular stages were defined primarily based on cell associations and DAPI staining (centromeric and pericentric heterochromatin clustering) as described in [ 36 ].
Show full methods section
Mice Smc1β –/– mice have been previously described [ 32 , 33 ]. In Smc1β –/– mice, exon 10 was targeted representing 40% of the hinge domain. Generally, mice were bred and maintained in the animal facility of the Medical Faculty, Technische Universität Dresden (Dresden, Germany) according to institutional guidelines. All experiments were performed with approval by the State of Saxony. Rad21L -/- and Rec8 -/- mice were generated as described previously [ 19 , 34 ]. All mice were in the C57BL/6 genetic background. Number of mice used for the experiments: N = 5, Smc1β -/- ; N = 4, Rec8 -/- ; N = 4, Rad21L -/- ; N = 4, Smc1β -/- Rec8 -/- ; N = 4, Smc1β -/- Rad21L -/- . Single cell suspension and chromosome spreads Surface-spread chromosomes were prepared by detergent spreading adapted from Wojtasz et al. [ 35 ]. Testis was taken from the sacrificed mice and tunica albuginea was removed. Tubules were digested in 1 ml of 1 μg/ml of collagenase type I—PBS buffer for 10’ at 32°C with slight agitation. Tubules were the centrifuged to pellet the cells and excess collagenase was removed. Pellet was then resuspended in 500μl of 0.025% trypsin and incubated for 5’ at 32°C. Then 200 μl of media with FCS was added to the Single cell suspension. Cells were then filtered through 40 μm to remove the cell debris and centrifuged. Pellet was then resuspended in 300 μl of PBS. Now single cell suspension was used for the chromosome spreads. 1.5 μl of single cell suspension were dropped on 7 μl of 0.25% of NP40. Cells were allowed to lyse for 2 mins and then fixed by adding 24 μl of S fix (1% paraformaldehyde, 10 mM sodium borate buffer pH 9.2). Samples were incubated for 1 hour at room temperature in a humid chamber. Slides were dried under a hood and washed two times for one minute with 0.4% Agepon (AgfaPhoto) and another three times for one minute with water. Slides were used immediately or kept at -20°C until IF staining. Testis cryosection Testis were removed from sacrificed mice and placed in 2% (v/v) of formaldehyde/PBS for 40’ at RT for fixation before incubation in 30% sucrose/PBS overnight. Subsequently, testes were mounted in O.C.T (Sakura Finetek Europe), shock-frozen on dry ice and stored at -80°C. 8μm thick sections were made from the frozen testis, placed on the slides and dried for at least 30 min at RT. Then slides were treated with ice cold methanol for 10’ and 1’ with ice cold acetone. After completely drying, the slides were kept at –80°C or used immediately for the staining. The tubular stages were defined primarily based on cell associations and DAPI staining (centromeric and pericentric heterochromatin clustering) as described in [ 36 ].
Immunofluroscence staining
Chromosome spreads and sections were treated in the same way. Slides were blocked with either blocking buffer (2% BSA, 0.1% Triton X in PBS) or 10% goat serum for at-least 1hr at RT before the primary antibody treatment. Slides were incubated with primary antibodies for at-least 3 hrs. at 37°C. Then slides were washed with blocking buffer and incubated with secondary antibodies for at-least 1hr. After the secondary antibody treatment slides were washed with blocking buffer and mounted with Vectashield containing 1μg/ml of DAPI. Statistics was performed using the 1-way Anova test, the Dunn’s test, the Whitney-Mann test or the Wilcoxon test as indicated.
Immuno-Telo FISH staining
Telo-FISH of the G-strand was performed using the Telomere PNA FISH/Cy3 kit (Dako). The hybridization were done for 3 h at RT after denaturation at 80°C for 5 min. Cells from WT, SKO and DKO mice were always hybridized at the same time and compared with each other. Telomere intensity were obtained with equal exposure between all the genotypes and the relative length of telomeres was estimated by measuring the fluorescence intensity using ImageJ.
Microscopy and image analysis
Fluorescence was visualized with Zeiss Axiophot fluorescence microscope and analysis of images was performed using ImageJ version 1.43u. Image analysis of SIM images was done using the 3D surface plot plugin in of ImageJ. Grid size and smoothing was kept as 256 and 10.0 values, respectively, for all images.
Antibodies
The following antibodies (Tables 1 and 2 ) were used in this study: 10.1371/journal.pgen.1006389.t002 Table 2 List of secondary antibodies used. Secondary antibody Conjugate Source Working concentrations (IF) Goat Anti-mouse IgG Cy3 Biolegends Inc.(405309) 1:500 Goat Anti-Rabbit IgG Alexa Flour 488 Invitrogen(A11034) 1:500 Goat Anti-mouse IgG Alexa Flour 488 Invitrogen(A11001) 1:500 Goat Anti-Mouse IgG FITC Cell signalling(101002) 1:500 Goat Anti- Guineapig Alexa Flour 568 Invitrogen(A11075) 1:500 Goat Anti- Human Alexa Flour 568 Invitrogen(A21090) 1:500 Goat Anti-Rabbit HRP Jackson Lab(111-035-003) 1:5000(IB)
Supporting Information S1 Fig (A) Staining for SYCP3 and gH2AX is shown for earlier (upper row) and the most advanced (lower row) stages for each genotype. The γH2AX forms one or two defined clouds in the most advanced stage. (B) Staining for SYCP3 and SYCP1 is shown for earlier (two left images) and the most advanced (two right images) stages for the two DKOs. SYCP1 indicates synapsis. (C) Staining for SYCP1 and (D) for HORMAD1 is shown for the extent of synapsis failure in the mutants (scale bar: 5 μm) (TIFF) Click here for additional data file. S2 Fig Centromeres determined by immunofluorescence staining of spermatocyte chromosome spreads of WT, SKO and DKO mice. (A) samples were probed with anti-SYCP3 and anti-centromeric antibodies (ACA) (scale bar: 5 μm); red bars indicate SD. (B) Quantification of ACA signals. Statistically significant differences with a p-value >0.05 according to Dunn’s multiple comparison test are indicated. (TIFF) Click here for additional data file. S3 Fig Cohesin localization, single channel images. Immunofluorescence staining of spermatocyte chromosome spreads of WT, SKO and DKO mice probed with anti-SYCP3, anti-SMC3 (scale bar: 5 μm). (TIFF) Click here for additional data file. S4 Fig Cohesin localization, single channel images. Immunofluorescence staining of spermatocyte chromosome spreads of WT, SKO and DKO mice probed with anti-SYCP3, anti-SMC1β (scale bar: 5 μm). (TIFF) Click here for additional data file. S5 Fig Cohesin localization, single channel images. Immunofluorescence staining of spermatocyte chromosome spreads of WT, SKO and DKO mice probed with anti-SYCP3, 4), anti-SMC1α (scale bar: 5 μm). (TIFF) Click here for additional data file. S6 Fig Cohesin localization, single channel images. Immunofluorescence staining of spermatocyte chromosome spreads of WT, SKO and DKO mice probed with anti-SYCP3, anti-RAD21L (scale bar: 5 μm). (TIFF) Click here for additional data file. S7 Fig Cohesin localization, single channel images. Immunofluorescence staining of spermatocyte chromosome spreads of WT, SKO and DKO mice probed with anti-SYCP3, anti-REC8 (scale bar: 5 μm). (TIFF) Click here for additional data file. S8 Fig Cohesin localization, single channel images. Immunofluorescence staining of spermatocyte chromosome spreads of WT, SKO and DKO mice probed with anti-SYCP3, anti-RAD21 (scale bar: 5 μm). (TIFF) Click here for additional data file. S9 Fig Cohesin localization, single channel images. Immunofluorescence staining of spermatocyte chromosome spreads of WT, SKO and DKO mice probed with anti-SYCP3, anti-STAG3 (scale bar: 5 μm). (TIFF) Click here for additional data file. S10 Fig Frequency distribution of telomere length is shown for all the genotypes as measured using the ImageJ software. (TIFF) Click here for additional data file. S11 Fig SUN1 foci numbers for the indicated genotypes; red bars indicate SD. Those differences that are statistically significant with a p-value >0.05 according to the Dunn’s multiple comparison test are indicated. (TIFF) Click here for additional data file.
S12 Fig Super resolution
(SIM) images of wild-type telomeres stained with anti TRF2, and of chromosome axes stained with anti SYCP3 as indicated. The sex chromosomes are marked by a blue arrow. Excerpts are provided showing examples of loop-like structures at the end of chromosomes. (TIFF) Click here for additional data file. S13 Fig 3D surface plot analysis of wild-type and mutant telomeres of autosomes stained by anti TRF2 and anti SYCP3. High intensity signals are indicated by red color, low intensity by blue. (TIFF) Click here for additional data file. S14 Fig Quantification of telomere features of wt and mutant spermatocytes. The percentages of chromosome ends showing telomeres in a loop-like pattern is provided, as is the percentage of chromosomes that show at one end 4, 3 or 2 telomere signals indicative of incomplete synapsis and/or failing cohesion. Further, the percentages of chromosomes that feature only one telomere signal, i.e. lack a signal at one end, and of chromosomes that display stretched telomeres, are given. (TIFF) Click here for additional data file.
S1 Table
Summary of phenotypes observed in SKOs and DKOs. Synapsis is defined here as full synapsis between two homologs; the aberrant deposition of SYCP1 between sister chromatids or on a single chromatid is not considered synapsis. The degree of asynapsis in each mutant is indicated. The number of asterisks indicates the relative prominence of the phenotype. (1) Note: it is important to note that at later stages of meiosis, loss of cohesion is observed for meiosis-specific cohesin protein deficiencies. (TIFF) Click here for additional data file.
📊 Figures
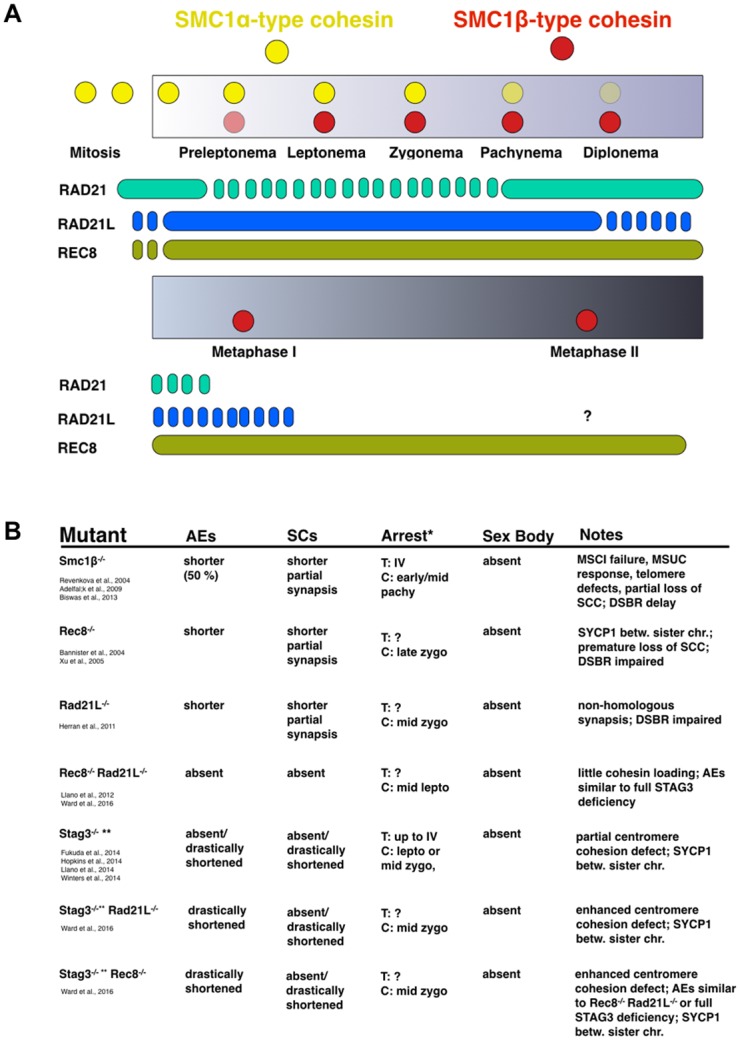
Fig 1
Overview of cohesins in meiosis and meiotic cohesin mutant phenotypes.
A. Graph illustrating the approximate occurrence of individual cohesin proteins throughout male meiosis, based on summarizing the current literature; for details see main text. B. Table showing some o...
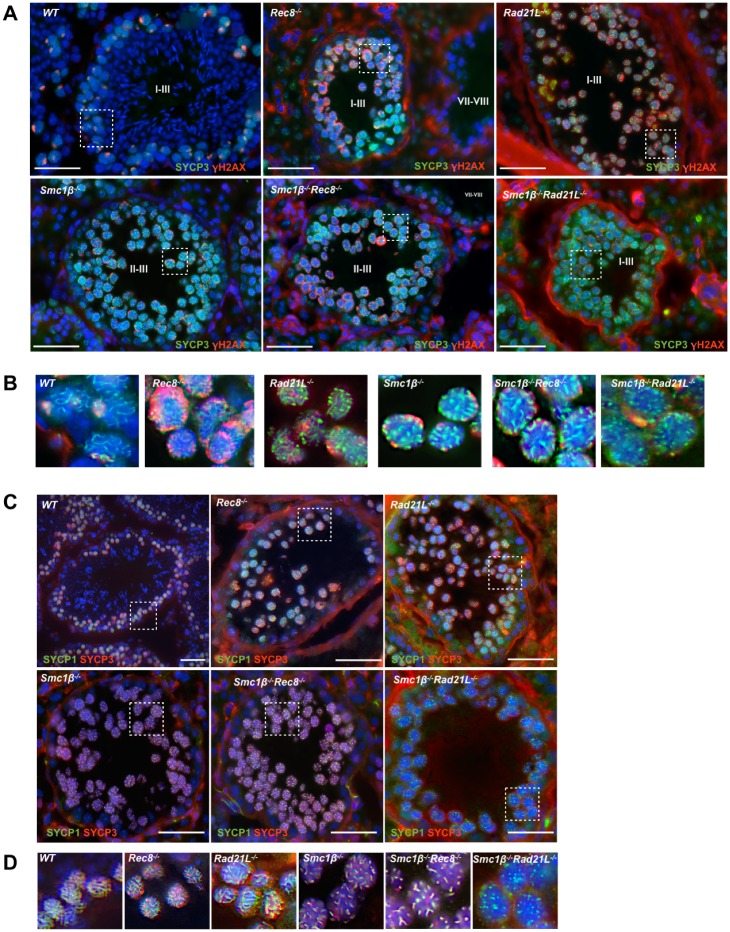
Fig 2
Testis tubule analysis of wild-type and mutant mice.
A. Immunofluorescence staining of testis sections of WT, SKO (single knockout) mice Smc1u03b2 -/- , Rec8 -/- , Rad21L -/- , and DKO (double knock out) mice: Smc1u03b2 -/- Rec8-/- and Smc1u03b2 -/- Rad...
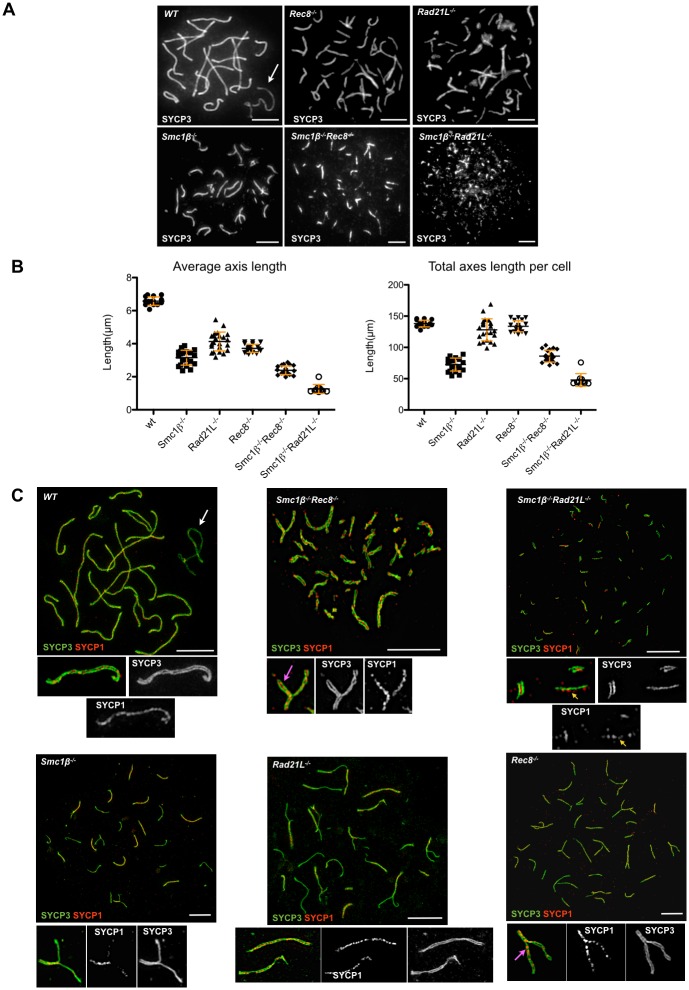
Fig 3
Axes structure and length measurements.
A. Immunofluorescence staining of spermatocyte chromosome spreads of WT, SKO and DKO mice, probed with anti-SYCP3 for AEs/LEs. The associated pair of X/Y chromosomes is indicated by a white arrow and ...
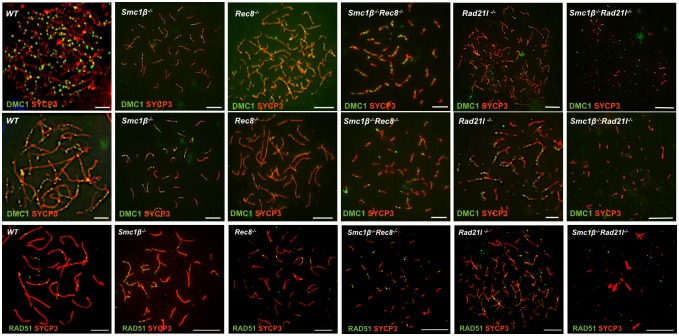
Fig 4
DNA double strand break repair foci.
Immunofluorescence staining of spermatocyte chromosome spreads of WT, SKO and DKO mice, probed with anti-SYCP3 (red) for AEs/LEs and anti-DMC1 (green) or anti RAD51 as indicated for DNA double-strand ...
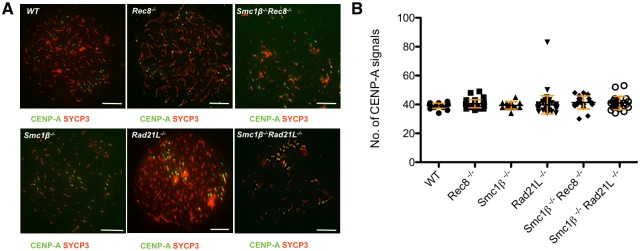
Fig 5
Centromeric cohesion.
A. Immunofluorescence staining of spermatocyte chromosome spreads of leptotene stage of WT, SKO and DKO mice, probed with anti-SYCP3 for AEs/LEs and anti-CENP-A for the inner kinetochore (scale bar: 5...
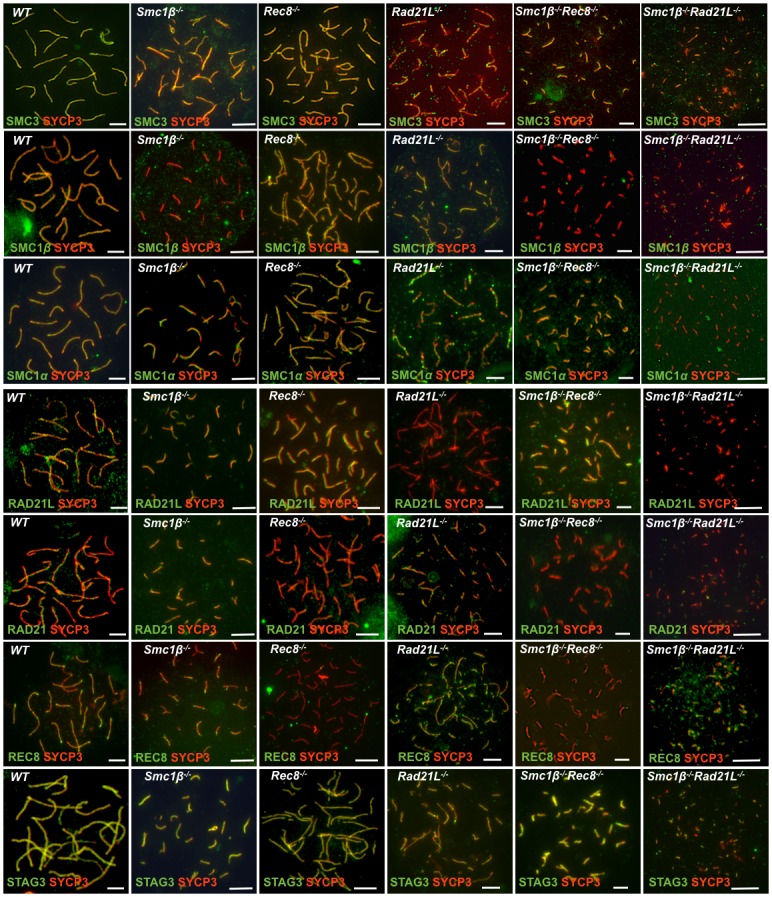
Fig 6
Localization of cohesin proteins.
Immunofluorescence staining of spermatocyte chromosome spreads of WT, SKO and DKO mice probed with anti-SYCP3, anti-SMC3, anti-SMC1u03b2, anti-SMC1u03b1, anti-RAD21L, anti-RAD21, anti-STAG3 or anti-RE...
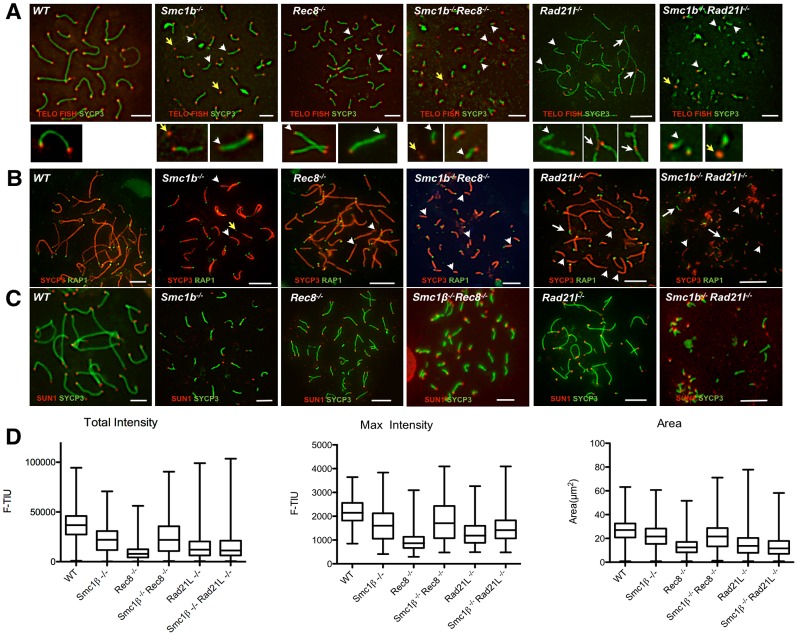
Fig 7
Telomere analysis.
A. Staining of spermatocyte spreads by Telo FISH (red) to assess telomere length and anti-SYCP3 for AEs/LEs in WT, SKO and DKO mice (scale bar: 5 u03bcm). Magnified images of individual chromosomes ar...
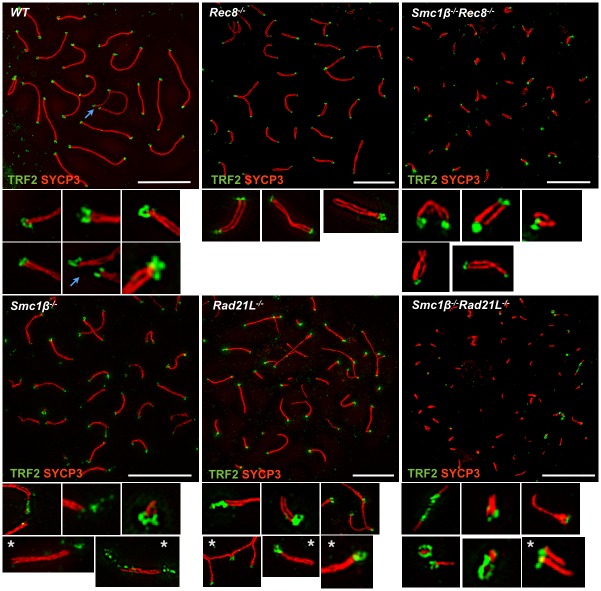
Fig 8
Super resolution telomere analysis.
SIM analysis of wild-type and mutant spermatocyte telomeres in chromosome spreads, stained with anti TRF2 and anti SYCP3. Sex chromosomes in wild-type are marked by a blue arrow. High magnification ex...
Figure images are served from the NIH/NLM PubMed Central Open Access Subset or Europe PMC; copyright remains with the publishers and authors.
💬 Discussion
0 commentsNo comments yet. Be the first to start a discussion!
Leave a Comment