Abstract
Cells interact with the extracellular environment through molecules expressed on the membrane. Disruption of these membrane-bound interactions (or encounters) can result in disease progression. Advances in super-resolution microscopy have allowed membrane encounters to be examined, however, these methods cannot image entire membranes and cannot provide information on the dynamic interactions between membrane-bound molecules. Here, we show a novel DNA probe that can transduce transient membrane encounter events into readable cumulative fluorescence signals. The probe, which translocates from one anchor site to another, mimicking motor proteins, is realized through a toehold-mediated DNA strand displacement reaction. Using this probe, we successfully monitored rapid encounter events of membrane lipid domains using flow cytometry and fluorescence microscopy. Our results show a preference for encounters within the same lipid domains.
🔬 Techniques
🔭 Microscopes
✨ Fluorophores
🧪 Sample Preparation
🏭 Microscope Brands
🧪 Reagent Suppliers
🏛️ Research Organizations (ROR)
Affiliated research institutions:
📋 Methods
Manipulation of the membrane DNA probe The ligand-conjugated DNA duplexes X-S1/B and Y-S2/W were incubated separately in 1× phosphate-buffered saline (PBS) buffer (pH = 7.4 with 137 mM NaCl and 2.7 mM KCl) for 1 h before use. Each conjugate was then incubated at a concentration of 200 nM with 5 × 10 5 cells ml −1 in 200 µl binding buffer (containing 4.5 g l −1 glucose, 5 mM MgCl 2 , 0.1 mg ml −1 yeast tRNA and 1 mg ml −1 bovine serum albumin (BSA) in Dulbecco’s PBS with calcium chloride and magnesium chloride) and shaken every 20 min. X-S1/B conjugates were generally mixed with cells for 20 min prior to the addition of Y-S2/W conjugate to ensure that no X-S1/W conjugates were formed before initiating the strand displacement reactions. Cells were then washed three times with PBS to remove free probes and resuspended in binding buffer. After washing and discarding the non-binding probes, 20-fold (compared with the initial concentration of S1/B conjugate) initiator strand I was typically added to initiate the strand displacement reaction. During each experiment, the initial fluorescence signal was examined before adding the initiator strand to demonstrate the proper concentration of DNA probes; meanwhile, the same batch of cells was used for the control experiment by adding the same amount of DNA probes and wrapping the dye/quencher labelling (X-S1-quencher/Y-S2-dye versus X-S2-dye/Y-S1-quencher) in order to confirm that a similar concentration of both ligands was labelled. Each experiment was repeated three times.
Show full methods section
Manipulation of the membrane DNA probe The ligand-conjugated DNA duplexes X-S1/B and Y-S2/W were incubated separately in 1× phosphate-buffered saline (PBS) buffer (pH = 7.4 with 137 mM NaCl and 2.7 mM KCl) for 1 h before use. Each conjugate was then incubated at a concentration of 200 nM with 5 × 10 5 cells ml −1 in 200 µl binding buffer (containing 4.5 g l −1 glucose, 5 mM MgCl 2 , 0.1 mg ml −1 yeast tRNA and 1 mg ml −1 bovine serum albumin (BSA) in Dulbecco’s PBS with calcium chloride and magnesium chloride) and shaken every 20 min. X-S1/B conjugates were generally mixed with cells for 20 min prior to the addition of Y-S2/W conjugate to ensure that no X-S1/W conjugates were formed before initiating the strand displacement reactions. Cells were then washed three times with PBS to remove free probes and resuspended in binding buffer. After washing and discarding the non-binding probes, 20-fold (compared with the initial concentration of S1/B conjugate) initiator strand I was typically added to initiate the strand displacement reaction. During each experiment, the initial fluorescence signal was examined before adding the initiator strand to demonstrate the proper concentration of DNA probes; meanwhile, the same batch of cells was used for the control experiment by adding the same amount of DNA probes and wrapping the dye/quencher labelling (X-S1-quencher/Y-S2-dye versus X-S2-dye/Y-S1-quencher) in order to confirm that a similar concentration of both ligands was labelled. Each experiment was repeated three times.
Measurement of membrane strand displacement efficiencies
The cellular fluorescence signal was monitored with a FACScan cytometer (Becton Dickinson Immunocytometry Systems) by counting 5,000 events at each time point, using channel #3 for the 6-carboxyfluorescein dye and channel #5 for the PE-Cy5.5 dye. The confocal microscope images were acquired by an Olympus FV500-IX81 with a 488 nm argon laser and a 543/633 nm helium/neon laser (Olympus America) for fluorescence signals from TMR dye- or Quasar 670 dye-modified DNA probes. Kinetics of cell surface locomotion The dynamic toehold-mediated strand displacement reaction has been proven to follow a second-order reaction model 14 , 15 . In our system, the locomotion of DNA probe in buffer solution can be written as: (1) S 1 + WS 2 → k 1 WS 1 + S 2 Based on previous simulations, it should be noted that the contribution of the reverse rate constant k −1 will be negligible 15 ; as a result, k 1 functions as an apparent displacement process rate constant. Based on the Stern–Volmer equation, the fraction of the maximum fluorescence change indicates the reaction efficiency at any specific time. Since the toehold binding process is mediated by the effective concentration of the incoming strand (that is, the encounter rate), k 1 is a diffusion rate-influenced constant. As a proof, two studies using biophysical models have reported that tethered hybridization, instead of free diffusion, will effectively increase the rates of strand displacement reactions 28 , 29 . The operation of the DNA probe on the cell membrane can be written as a two-step process: (2) I + BS 1 → k 1 ′ IB + S 1 (3) S 1 + WS 2 → k 2 ′ WS 1 + S 2 Since a large excess of I strand is introduced to remove block strand B, the first step appears as a pseudo-first-order reaction, which is almost finished within a minute Supplementary Fig. 2 ). As a result, the second step, that is, probe locomotion, is the rate-limiting step in this process, and the entire rate law can be written as: (4) R = k 2 ′ C S 1 C WS 2 = k 2 ′ C CS 1 [ 1 − exp ( − k 1 ′ t ) ] C WS 2 ≡ k ″ C CS 1 C WS 2 Note that C CS1 and C WS2 represent DNA probe density on the cell membrane in units of mol cm –2 and that the overall process is second-order, depending on the original immobilization amounts of both B/S1 and W/S2 conjugates. After solving the apparent locomotion rate constant k ″, the encounter rate ( F ) of the two oligonucleotide-tethered ligands on the cell membrane can be calculated by (5) F = R / P = k ″ C CS 1 C WS 2 / P where P represents the reaction probability after an S1 and W/S2 encounter, which can be obtained based on the Smoluchowski equation 24 . The diffusion coefficients of free oligonucleotide strands and that of oligonucleotide-modified membrane ligands can be obtained based on fluorescence recovery after photobleaching 30 . Since F is a factor that depends on the membrane density of each immobilized strand, a relative encounter rate between two encounter pairs with similar surface concentration can be a more meaningful indicator for comparison. In our case, since (1) the same strand sequences are used to study different ligand interactions and (2) all reaction directions are assumed to occur along the surface of the cell membrane, P AA and P BB can be considered the same. Thus, the relative encounter rate between ligand A–A and ligand B–B can be obtained as (6) F AA / F BB = k AA ″ C ACS 1 C AWS 2 / k BB ″ C BCS 1 C BWS 2 In equation (6) , only the relative concentrations of DNA probes are needed, and these can be determined from the fluorescence enhancement by flow cytometry or fluorescence microscopy. Therefore, information about the absolute density of oligonucleotides on the cell membrane is not necessary. As an example, the relative encounter rate between two diacyllipid-conjugated anchors was studied under different initial concentrations of DNA probes ( Supplementary Fig. 3 ). It has been demonstrated that a direct correlation exists between the encounter rate and the relative membrane density of DNA probe. Moreover, by comparing the experimental data with the theoretical fitting curve, at the low membrane density condition (≤ 300 nM), which is employed later in this study, the apparent locomotion rate constant k ″ can be viewed as independent of the initial concentration of the probes, thus validating our approach that extracts the inherent encounter rate differences among various surface ligands. In our study, experimental fluorescence data were implemented with OriginPro 8. Based on the nature of second-order reaction, the built-in Exponential Decay 2 function “y = A1 *exp(−x/t1) + A2 *exp(−x/t2 ) + y0″ was used for fitting the data. In equation (4) , the simplest case occurred when initial membrane concentrations of S1 and WS2 were almost the same. Then k ″ could be obtained through half-time measurements, which is the time it takes for a fluorescence signal to decrease to half of the original value after subtracting the background signal. Then, t 1 / 2 = 1 / k ″ C S 1 0 , where C S 1 0 stands for initial S1 concentration at time 0, which was determined from the fluorescence calibration curve. However, in the case of different concentrations between S1 andWS2, a plot of ln [ ( C S 1 0 C WS 2 / C WS 2 0 C S 1 ) ] versus time would be plotted, and the slope of the linear curve would be k ″ ( C S 1 0 − C WS 2 0 ] . Kinetics of cell membrane competition game Cell membrane fluorescence change was monitored during the first 80 min after adding I strand, and the pathway selection was studied by comparing the kinetic decay results of the XYZ system with that of the ZYX system. ZYX is the system for which the two possible final destinations will be reversely labelled, that is, unlabelled X anchor site and quencher-labelled Z anchor site. A second fluorescence kinetic decay curve will be measured in such condition. For two second-order competition reactions (7) X + YW → k XY ′ XW + Y (8) Z + YW → k YZ ′ ZW + Y the reaction rate ratio can be expressed as (9) R XY / R YZ = d C X / d C Z = k XY ″ C X C YW / k YZ ″ C Z C YW = k XY ″ C X / k YZ ″ C Z At a specific time t when the product strand concentration ( C XW and C ZW ) is still small compared with that of the initial strand ( C X0 and C Z0 ), the relative choice of towards X and Z can be calculated based on percentage fluorescence decrease at time t , f XY (=( C XW / C X0 )) and f YZ (=( C ZW / C Z0 )), as (10) F XY / F YZ = C X 0 ( In C XW − In C X 0 ) / C Z 0 ( In C ZW − In C Z 0 ) = C X 0 In f XY / C Z 0 In f YZ Preparation of lipid monolayer film spiked with DNA probe The lipid monolayer film was prepared following ref. 15. Teflon AF-coated microscope glass coverslides were prepared by spin-coating. In short, after thoroughly cleaning and blow-drying the coverslides, 1.2% Teflon AF solution (diluted from 6% with Fluorinert FC-770) was added. Spin-coating was performed at 2,000 r.p.m. for 1 min. The coverslides were then baked at 180 °C for 5 min to finish coating. To prepare DNA–lipid mixtures, soybean polar extract lipid solutions were spiked with stearyl-S2/W-FAM conjugate and stearyl-S1-Dabcyl/B conjugate, respectively, at a DNA:lipid ratio of 1:10,000. After equilibration at 8 °C overnight for DNA incorporation into the lipid layer, 10 µl DNA–lipid mixture was dried under reduced pressure to remove chloroform for 1 h, and then rehydrated into 10 µl 1× PBS buffer. 1 µl of both stearyl-S2/W-FAM and stearyl-S1-Dabcyl/B lipid solution were added and mixed on the above-prepared coverslides that were coated with Teflon AF. After adding excess amount of initiator DNA strand to start the encounter measurement, fluorescence signal of the lipid biofilm was monitored for 3 h. At each time point, the averaged fluorescence signal from the edge of the lipid film to 100 µm towards the centre was used to plot and calculate the DNA strand displacement reaction efficiency. Manipulation of DNA probe to study membrane protein encounter rates Locomotion of DNA probe between two aptamer-conjugated anchor sites was manipulated similarly as other membrane DNA probes. The DNA probe–aptamer duplexes X-S1/B and Y-S2/W were incubated separately in 1× PBS buffer for 1 h before use. 100 nM TC01-, 400 nM TD05-, 600 nM TE02- or 1 µM Sgc4f-conjugated DNA probe conjugates were then incubated with 5 × 10 5 cells ml −1 in 200 µl binding buffer and shaken every 20 min. Cells were then washed three times with PBS to remove free probes and resuspended in binding buffer. After washing and discarding the non-binding probes, 1 µM initiator strand I was added to initiate the strand displacement reaction. Here, to measure the heterogeneous encounters, XY ¯ , that is, the averaged encounter rate of XY and YX probe measurements, the same batch of cells was used for the control experiment by adding the same amount of DNA probes and wrapping the dye/quencher labelling (X-S1-quencher/Y-S2-dye versus X-S2-dye/Y-S1-quencher). All experiments were repeated at least three times.
Data availability
All relevant data are available from the authors, requests should be addressed to M.Y. and/or W.T.
📊 Figures
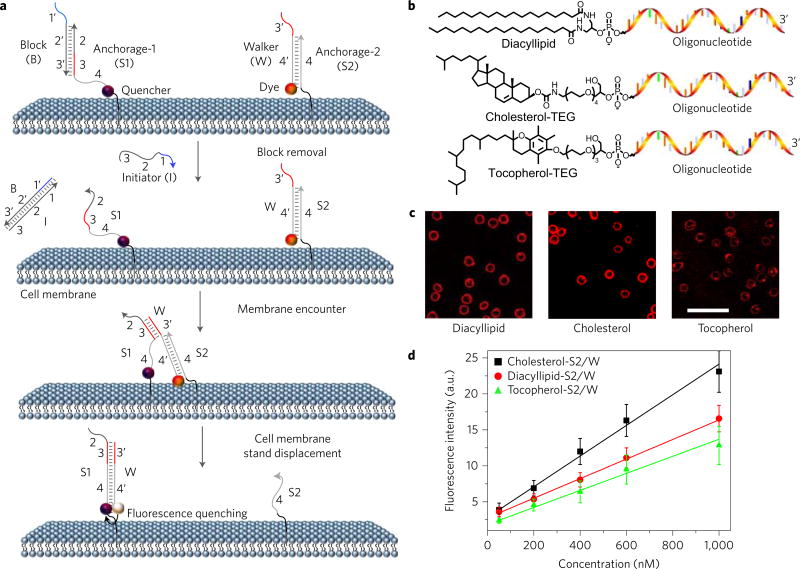
Figure 1
Anchoring and operation scheme of DNA probe on live cell membrane
a , Schematic illustration of the operation of DNA probe on a live cell membrane. Here, the initiator (I) strand removes the block strand (B) by a strand displacement reaction. In this way, the transl...
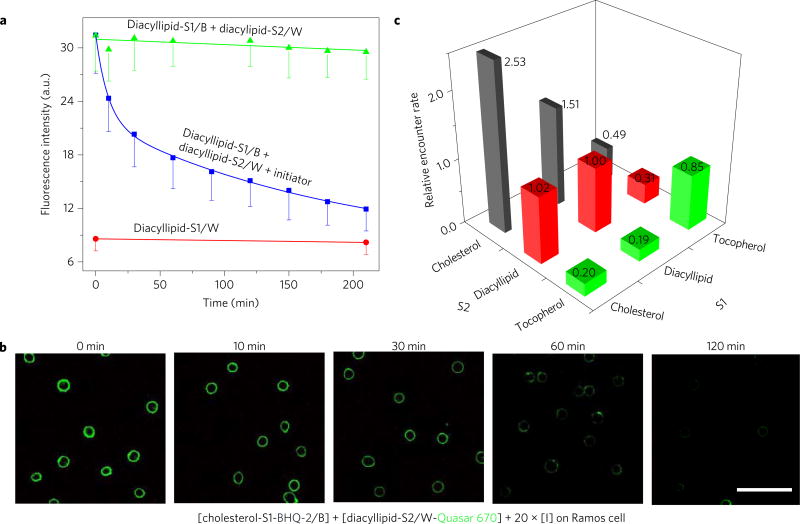
Figure 2
Locomotion of DNA probe on live cell membrane
a , Locomotion of DNA probe between two diacyllipid-conjugated anchor sites as monitored with flow cytometry. Initially 500 nM of each DNA conjugate was incubated with 5 u00d7 10 5 Ramos cells ml u221...
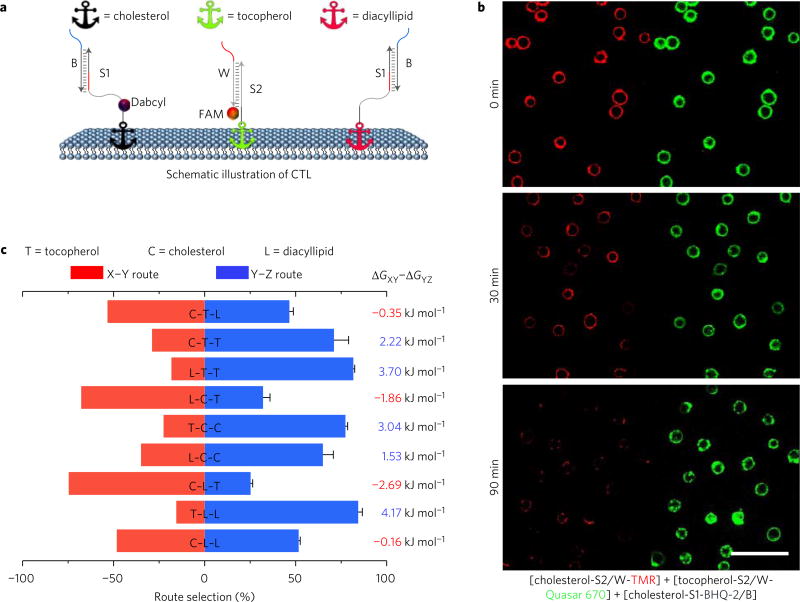
Figure 3
DNA probe competition game to study encounter preference
a , Schematic showing DNA probe competition game results among diacyllipid, cholesterol and tocopherol anchors on the Ramos cell membrane. Initially, 150 nM cholesterol, 300 nM diacyllipid and 400 nM ...
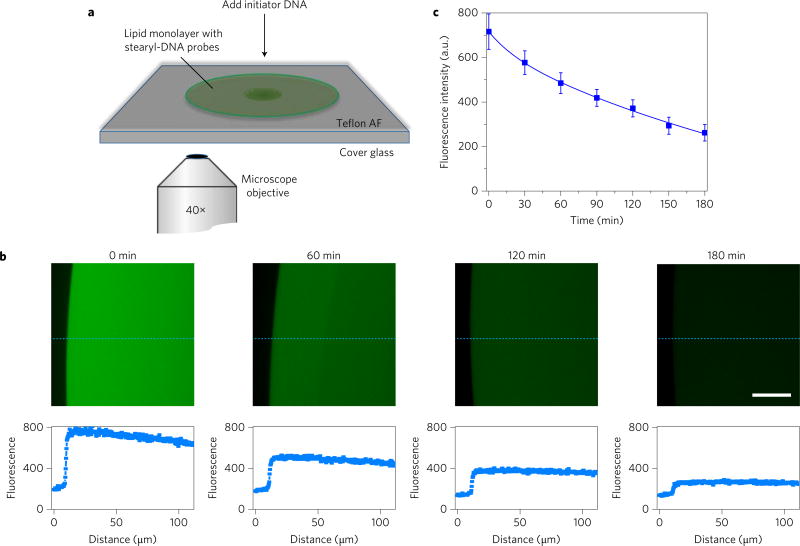
Figure 4
Locomotion of DNA probe on model lipid monolayer film
a , Illustration of experimental set-up at the fluorescence microscope. Soybean polar extract lipid solution was spiked with stearyl-S2/W-FAM conjugate and stearyl-S1-Dabyl/B conjugate separately at a...
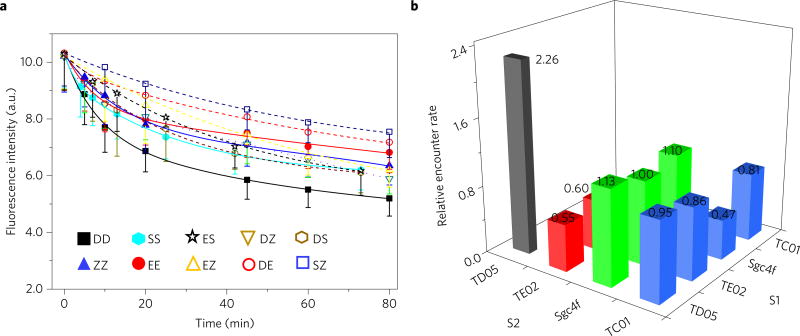
Figure 5
DNA probeu2013aptamer conjugates to study membrane protein encounter rates
a , Locomotion of DNA probe between two aptamer-conjugated anchor sites as monitored with flow cytometry. Initially, 100 nM TC01 (Z)-, 400 nM TD05 (D)-, 600 nM TE02 (E)- or 1 u00b5M Sgc4f (S)-conjugat...
Figure images are served from the NIH/NLM PubMed Central Open Access Subset or Europe PMC; copyright remains with the publishers and authors.
💬 Discussion
0 commentsNo comments yet. Be the first to start a discussion!
Leave a Comment