Abstract
Signals from the mitotic spindle during anaphase specify the location of the actomyosin contractile ring during cytokinesis, but the detailed mechanism remains unresolved. Here, we have imaged the dynamics of green fluorescent protein-tagged myosin filaments, microtubules, and Kinesin-6 (which carries activators of Rho guanosine triphosphatase) at the cell cortex using total internal reflection fluorescence microscopy in flattened Drosophila S2 cells. At anaphase onset, Kinesin-6 relocalizes to microtubule plus ends that grow toward the cortex, but refines its localization over time so that it concentrates on a subset of stable microtubules and along a diffuse cortical band at the equator. The pattern of Kinesin-6 localization closely resembles where new myosin filaments appear at the cortex by de novo assembly. While accumulating at the equator, myosin filaments disappear from the poles of the cell, a process that also requires Kinesin-6 as well as possibly other signals that emanate from the elongating spindle. These results suggest models for how Kinesin-6 might define the position of cortical myosin during cytokinesis.
🔬 Techniques
🧬 Organisms
💻 Software
✨ Fluorophores
🧪 Sample Preparation
🏭 Microscope Brands
🧪 Reagent Suppliers
📷 Detectors
🎨 Filters
💻 Software Details
🏛️ Research Organizations (ROR)
Affiliated research institutions:
📋 Methods
Constructs, cell lines, and RNAi Drosophila S2 cells were grown and RNAi was performed as described previously ( Rogers et al., 2002 ). A construct using the endogenous promoter to express GFP fused to the regulatory light chain of myosin II (referred to as myosin-GFP in this paper) was described by Rogers et al. (2004) . The GFP variant mCherry was fused to the N terminus of α-tubulin and expressed from the Act5c promoter, as first described and used in Goshima et al. (2007) . Kinesin-6–GFP ( Goshima and Vale, 2005 ) was expressed from a regulated metallothionein promoter (pMT) by the addition of 20–100 µM CuSO 4 overnight. GFP was fused to the C terminus of the Diaphanous gene (cDNA generously provided by M. Peifer, University of North Carolina, Chapel Hill, NC) using the using the Gateway system (Invitrogen). The Aurora B–GFP construct was obtained from G. Hickson (University of California, San Francisco, San Francisco, CA). Actin-GFP was first described in Rogers et al. (2003) . EB1-GFP was described in Rogers et al. (2002) . Stable cell lines (used for all experiments) were made by transfection with Effectene (QIAGEN) according to the manufacturer's instructions and then selected with hygromycin for ∼3 wk. The cell line stably expressing EB1-GFP and mCherry–α-tubulin was created by S. Goodwin (University of California, San Francisco). The Pav-GFP–transfected cells were FACS sorted and used shortly after selection, as the percentage of cells expressing both Pav-GFP and mCherry-tubulin cells decreased considerably over time. RNAi was performed as described previously, with essentially 1 µg double-stranded RNA (dsRNA) added per well in a 96-well plate ( Rogers et al., 2002 ). RNAi treatment for Pav, Rho1, Cnn, and Klp10A was performed for 4–5 d, whereas double RNAi for Klp61F and BubR1 (to create monopolar spindles that progress into anaphase) was performed for 3 d. To control for any nonspecific RNAi effects, a control RNAi treatment was performed (5 d) with dsRNA to a 400–base pair region of the pBlueScript vector. Sequence information for the dsRNAs can be found at http://rnai.ucsf.edu/ (V2 library).
Show full methods section
Constructs, cell lines, and RNAi Drosophila S2 cells were grown and RNAi was performed as described previously ( Rogers et al., 2002 ). A construct using the endogenous promoter to express GFP fused to the regulatory light chain of myosin II (referred to as myosin-GFP in this paper) was described by Rogers et al. (2004) . The GFP variant mCherry was fused to the N terminus of α-tubulin and expressed from the Act5c promoter, as first described and used in Goshima et al. (2007) . Kinesin-6–GFP ( Goshima and Vale, 2005 ) was expressed from a regulated metallothionein promoter (pMT) by the addition of 20–100 µM CuSO 4 overnight. GFP was fused to the C terminus of the Diaphanous gene (cDNA generously provided by M. Peifer, University of North Carolina, Chapel Hill, NC) using the using the Gateway system (Invitrogen). The Aurora B–GFP construct was obtained from G. Hickson (University of California, San Francisco, San Francisco, CA). Actin-GFP was first described in Rogers et al. (2003) . EB1-GFP was described in Rogers et al. (2002) . Stable cell lines (used for all experiments) were made by transfection with Effectene (QIAGEN) according to the manufacturer's instructions and then selected with hygromycin for ∼3 wk. The cell line stably expressing EB1-GFP and mCherry–α-tubulin was created by S. Goodwin (University of California, San Francisco). The Pav-GFP–transfected cells were FACS sorted and used shortly after selection, as the percentage of cells expressing both Pav-GFP and mCherry-tubulin cells decreased considerably over time. RNAi was performed as described previously, with essentially 1 µg double-stranded RNA (dsRNA) added per well in a 96-well plate ( Rogers et al., 2002 ). RNAi treatment for Pav, Rho1, Cnn, and Klp10A was performed for 4–5 d, whereas double RNAi for Klp61F and BubR1 (to create monopolar spindles that progress into anaphase) was performed for 3 d. To control for any nonspecific RNAi effects, a control RNAi treatment was performed (5 d) with dsRNA to a 400–base pair region of the pBlueScript vector. Sequence information for the dsRNAs can be found at http://rnai.ucsf.edu/ (V2 library).
Microscopy and analysis
S2 cells were plated on MatTek dishes with No. 1.5 glass coverslip bottoms that were coated with Con A (0.5 mg/ml Con A [Sigma-Aldrich] air dried onto the coverslip) and allowed to spread for 1–3 h before imaging ( Rogers et al., 2002 ). Total internal reflection microscopy was performed using a microscope (Perfect-focus TE2000; Nikon) with a 100×, 1.45 NA objective (Nikon) and illumination from either a 488-nm argon laser (100 mW) or a 491-nm solid-state laser (100 mW) and a 561-nm solid-state laser (50 mW). For dual-color TIRF microscopy, we used a triple-pass dichroic filter (z491/561/633rpc) and changed the emission filter (ET525/50 or ET595/50; both from Chroma Technology Corp.) with a filter wheel placed before the camera. In some cases, an excitation notch filter was used in the filter cube (NF01-405/488/561/635; Semrock, Inc.). Images were typically captured every 2–3 s with a 50–200-ms exposure with an EM charge-coupled device camera (iXon; Andor Technology). The microscope was controlled and images were acquired using open source MicroManager software ( http://www.micro-manager.org ). Images were cropped and contrast adjustments were made in Photoshop (Adobe). We first searched for doubly transfected (mCherry and GFP fusions) metaphase cells by visualizing their spindle with mCherry-tubulin using epifluorescence, and then switched to TIRF microscopy. (Because of the difficulty in identifying mitotic cells, we were unable to study cells transfected with Pav-GFP and myosin-mCherry.) Cells that did not enter anaphase within 30 min or with high levels of fluorescence from overexpressed proteins were excluded from analysis. Results are representative of six or more cells. Image analysis was performed using ImageJ software ( http://rsbweb.nih.gov/ij/ ). Online supplemental material Fig. S1 shows the distribution of actin-GFP and diaphanous-GFP during anaphase. Fig. S2 shows the time course of disappearance of an individual myosin filament. Fig. S3 and Video 3 show that myosin-GFP relocalization during anaphase proceeds normally after RNAi knockdown of centrosomin (which blocks microtubule nucleation at centrosomes) and Klp10A (which increases the number of stable microtubules at the cortex). Video 6 shows that myosin-GFP localization to the midzone and loss from the poles does not occur after RNAi Kinesin-6; microtubules tend to be more homogeneous throughout the cortex and less bundled. Fig. S4 and Video 7 show Aurora B–GFP on the tips of microtubules as they grow toward the cortex during early anaphase. Video 8 shows the behavior of EB1-GFP at the cortex during anaphase, and Video 4 shows a cell where microtubule asters from one centrosome reach the cortex but do not on the other side. Videos 1, 2, 5, 9, and 10 present dynamic data of the cells shown in Figs. 1 ; 3 ; 5, b and a ; and 6 , respectively. Online supplemental material is available at http://www.jcb.org/cgi/content/full/jcb.200902083/DC1 .
Online supplemental material Fig. S1 shows the distribution of actin-GFP and diaphanous-GFP during anaphase. Fig. S2 shows the time course of disappearance of an individual myosin filament. Fig. S3 and Video 3 show that myosin-GFP relocalization during anaphase proceeds normally after RNAi knockdown of centrosomin (which blocks microtubule nucleation at centrosomes) and Klp10A (which increases the number of stable microtubules at the cortex). Video 6 shows that myosin-GFP localization to the midzone and loss from the poles does not occur after RNAi Kinesin-6; microtubules tend to be more homogeneous throughout the cortex and less bundled. Fig. S4 and Video 7 show Aurora B–GFP on the tips of microtubules as they grow toward the cortex during early anaphase. Video 8 shows the behavior of EB1-GFP at the cortex during anaphase, and Video 4 shows a cell where microtubule asters from one centrosome reach the cortex but do not on the other side. Videos 1, 2, 5, 9, and 10 present dynamic data of the cells shown in Figs. 1 ; 3 ; 5, b and a ; and 6 , respectively. Online supplemental material is available at http://www.jcb.org/cgi/content/full/jcb.200902083/DC1 .
📊 Figures
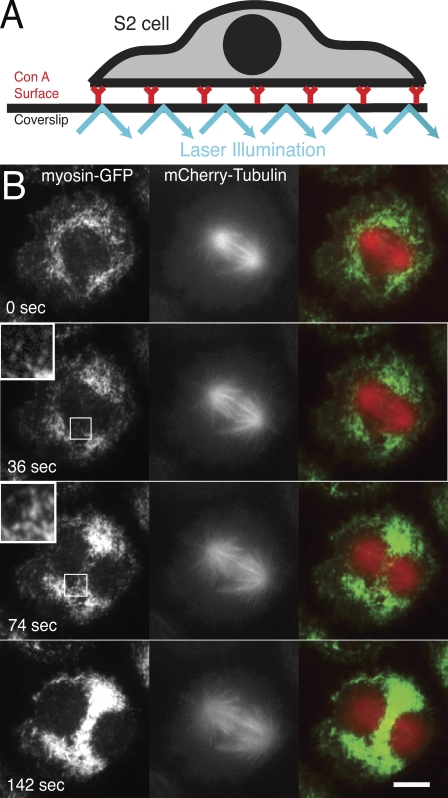
Figure 1.
Redistribution of myosin-GFP during anaphase in Drosophila S2 cells as observed by TIRF microscopy. (A) A schematic diagram showing the experimental system of a Drosophila S2 cells adsorbed onto a Con...
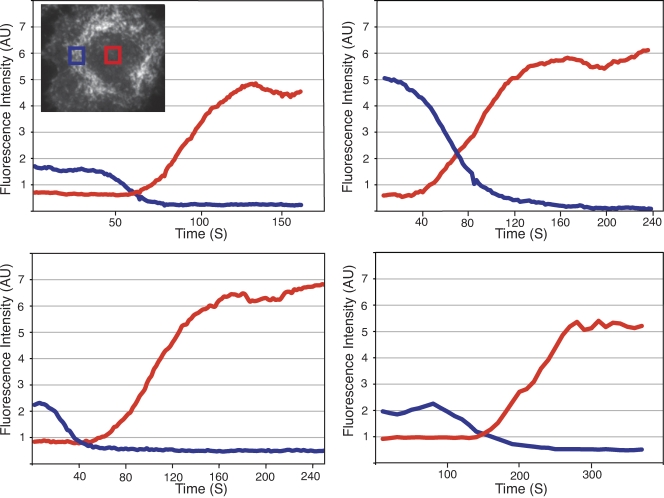
Figure 2.
Time course of myosin increase at the equator (red) and decrease at one of the poles (blue) in four representative cells. Using ImageJ, a 3.17 u00d7 3.17-u00b5m area (boxes shown in the inset) was mea...
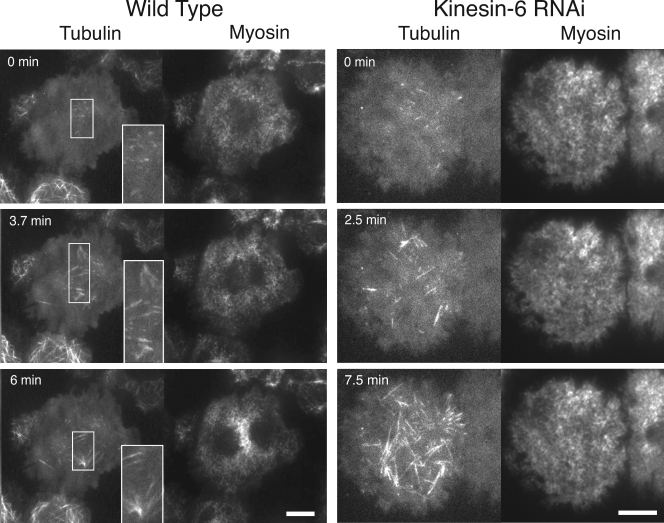
Figure 3.
Localization of microtubules and myosin at the cortex during anaphase in wild type and cells depleted of Kinesin-6 by RNAi. mCherry-tubulin and myosin-GFP were imaged by dual-color TIRF microscopy. Th...
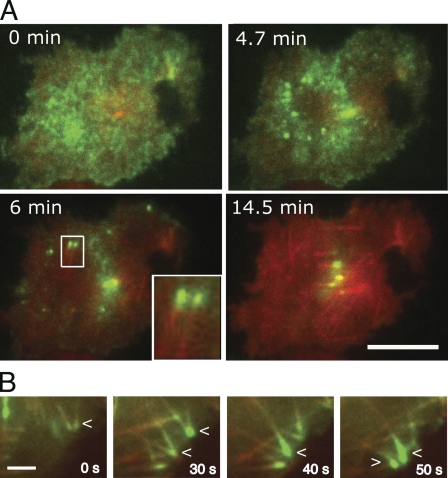
Figure 4.
Relocalization of Kinesin-6 to microtubule tips and the equatorial cortex during anaphase. S2 cells coexpressing mCherry-tubulin (red) and Kinesin-6u2013GFP (green) were imaged by dual-color TIRF micr...
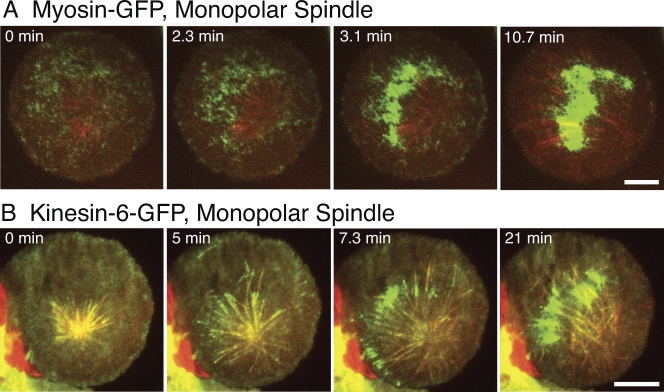
Figure 5.
Localization of myosin-GFP and Kinesin-6u2013GFP (Pav-GFP) in cells with monopolar spindles. Monopolar spindles were induced by RNAi depletion of the Kinesin-5 motor (Klp61F in Drosophila ); cells als...
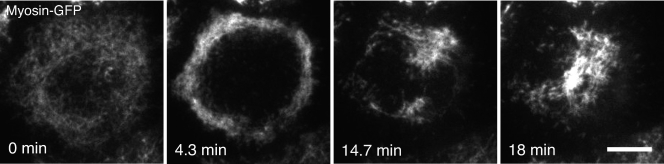
Figure 6.
Localization of myosin-GFP in a cell with a radially symmetrical monopolar spindle. Monopolar anaphases were induced by RNAi depletions of the Kinesin-5 motor (Klp61F in Drosophila ) and BubR1. This c...
Figure images are served from the NIH/NLM PubMed Central Open Access Subset or Europe PMC; copyright remains with the publishers and authors.
💬 Discussion
0 commentsNo comments yet. Be the first to start a discussion!
Leave a Comment