Abstract
Age-related cataract is a major cause of blindness worldwide, and cortical cataract is the second most prevalent type of age-related cataract. Although a significant fraction of age-related cataract is heritable, the genetic basis remains to be elucidated. We report that homozygous deletion of Epha2 in two independent strains of mice developed progressive cortical cataract. Retroillumination revealed development of cortical vacuoles at one month of age; visible cataract appeared around three months, which progressed to mature cataract by six months. EPHA2 protein expression in the lens is spatially and temporally regulated. It is low in anterior epithelial cells, upregulated as the cells enter differentiation at the equator, strongly expressed in the cortical fiber cells, but absent in the nuclei. Deletion of Epha2 caused a significant increase in the expression of HSP25 (murine homologue of human HSP27) before the onset of cataract. The overexpressed HSP25 was in an underphosphorylated form, indicating excessive cellular stress and protein misfolding. The orthologous human EPHA2 gene on chromosome 1p36 was tested in three independent worldwide Caucasian populations for allelic association with cortical cataract. Common variants in EPHA2 were found that showed significant association with cortical cataract, and rs6678616 was the most significant in meta-analyses. In addition, we sequenced exons of EPHA2 in linked families and identified a new missense mutation, Arg721Gln, in the protein kinase domain that significantly alters EPHA2 functions in cellular and biochemical assays. Thus, converging evidence from humans and mice suggests that EPHA2 is important in maintaining lens clarity with age.
🔬 Techniques
🔭 Microscopes
🧬 Organisms
💻 Software
✨ Fluorophores
🧪 Sample Preparation
🔬 Cell Lines
🏭 Microscope Brands
🧪 Reagent Suppliers
💻 Software Details
🏛️ Research Organizations (ROR)
Affiliated research institutions:
📋 Methods
Animals The KST085 line of Epha2 knockout mice was generated through secretory gene trapping as described previously [18] . The secretory trapping vector was inserted at the boundary between exon 5 and intron 6, leading to the truncation of exons 6 to 17 encoding the second fibronectin type III repeat in the extracellular domain all the way to the carboxyl terminal end. The remaining ectodomain encoded by exons 1 to 5 is fused to neomycin resistance and β-galactosidase reporter cassette (β-geo) and is trapped inside the cells in secretory vesicles, presumably in inactive form. These mice, which were generated on a C57Bl/6/129 genetic background, were then backcrossed with FVB/N mice. Mice from N4 or higher backcrosses were bred with each other to generate Epha2 +/+ , Epha2 +/− , and Epha2 −/− mice that were used in subsequent studies. Another line of mice on C57Bl/6 background was provided by Drs. M. Asano and Y. Iwakura [20] . In these mice, a retrovirus was inserted in the first codon of Epha2 , leading to abolishment of EPHA2 expression. All procedures involving mice were performed in accordance with guidelines set forth by the American Association for Accreditation of Laboratory Animal Care and the USPHS “Policy on Humane Care and Use of Laboratory Animals.” Studies were approved and supervised by The Case Western Reserve University Institutional Animal Care and Use Committee. Histological Analysis and Immunofluoresence For histological analyses, mouse eyes were enucleated and fixed in neutral buffered 10% formalin solution for 24 hours. Eyes were dehydrated through a graded alcohol series and embedded in paraffin. Sections (5 µm) were cut through papillary-optic nerve axis and stained with hematoxylin and eosin (H&E). For immunofluorescence analyses, postnatal day 14 eyes were dissected, fixed with 4% paraformaldehyde for 25 min. Eyes were washed with ice cold Phosphate Buffered Saline (PBS) and kept in 15% sucrose (prepared in PBS) overnight. Tissue freezing medium (Triangle Biomedical Science, Durham, NC) embedded eyes were cut on a cryostat (Leica, Germany), and air dried onto Superfrost Plus slides (Fisher Scientific). After washing with PBS, the sections were blocked with 50 mmol/L NH 4 Cl and permeabilized with 0.3% NP40 for 10 minutes. The sections were then incubated with primary antibodies at room temperature for 1 hour followed by detection with donkey secondary antibodies conjugated with FITC or Texas-red (Jackson ImmunoResearch, West Grove, PA) at room temperature for 30 minutes. EPHA2 and Ephrin-A1 proteins were detected in human and mouse lens paraffin-embedded sections. Briefly, sections were deparaffinized, hydrated, and immersed in citrate buffer (10 mM sodium citrate, 0.05% Tween 20, pH 6.0) for 10 minutes at 95°C. Primary antibodies were incubated with samples and then detected by Biotinylated secondary antibody and avidin–biotin–peroxidase system (Vector). Color immunostaining was revealed using diaminobenzidine (Vector). Images were taken using a fluorescent Leica DM-IRE2 microscope equipped with a SPOT RT-SE digital camera (Diagnostic Instrument) and analyzed with MetaMorph software 6.1r4 (Universal Imaging). Antibodies used include: goat anti-mouse EPHA2 ectodomain, goat anti-human EPHA2 (R&D Systems, Minneapolis, MN), rabbit anti-EPHA2 and anti-ephrin-A1, goat anti-HSP25 and mouse anti-phospho-ERK, rabbit anti-ERK (Santa Cruz Biotechnology, Santa Cruz, CA), rabbit anti-phospho-HSP25, anti-phospho-AKT, anti-Akt, anti-GAPDH (Cell Signaling), mouse monoclonal anti-N-cadherin (BD Biosciences). Rabbit-anti-α,β,γ-crystallin were kindly provided by Dr. Zigler (National Eye Institute).
Show full methods section
Animals The KST085 line of Epha2 knockout mice was generated through secretory gene trapping as described previously [18] . The secretory trapping vector was inserted at the boundary between exon 5 and intron 6, leading to the truncation of exons 6 to 17 encoding the second fibronectin type III repeat in the extracellular domain all the way to the carboxyl terminal end. The remaining ectodomain encoded by exons 1 to 5 is fused to neomycin resistance and β-galactosidase reporter cassette (β-geo) and is trapped inside the cells in secretory vesicles, presumably in inactive form. These mice, which were generated on a C57Bl/6/129 genetic background, were then backcrossed with FVB/N mice. Mice from N4 or higher backcrosses were bred with each other to generate Epha2 +/+ , Epha2 +/− , and Epha2 −/− mice that were used in subsequent studies. Another line of mice on C57Bl/6 background was provided by Drs. M. Asano and Y. Iwakura [20] . In these mice, a retrovirus was inserted in the first codon of Epha2 , leading to abolishment of EPHA2 expression. All procedures involving mice were performed in accordance with guidelines set forth by the American Association for Accreditation of Laboratory Animal Care and the USPHS “Policy on Humane Care and Use of Laboratory Animals.” Studies were approved and supervised by The Case Western Reserve University Institutional Animal Care and Use Committee. Histological Analysis and Immunofluoresence For histological analyses, mouse eyes were enucleated and fixed in neutral buffered 10% formalin solution for 24 hours. Eyes were dehydrated through a graded alcohol series and embedded in paraffin. Sections (5 µm) were cut through papillary-optic nerve axis and stained with hematoxylin and eosin (H&E). For immunofluorescence analyses, postnatal day 14 eyes were dissected, fixed with 4% paraformaldehyde for 25 min. Eyes were washed with ice cold Phosphate Buffered Saline (PBS) and kept in 15% sucrose (prepared in PBS) overnight. Tissue freezing medium (Triangle Biomedical Science, Durham, NC) embedded eyes were cut on a cryostat (Leica, Germany), and air dried onto Superfrost Plus slides (Fisher Scientific). After washing with PBS, the sections were blocked with 50 mmol/L NH 4 Cl and permeabilized with 0.3% NP40 for 10 minutes. The sections were then incubated with primary antibodies at room temperature for 1 hour followed by detection with donkey secondary antibodies conjugated with FITC or Texas-red (Jackson ImmunoResearch, West Grove, PA) at room temperature for 30 minutes. EPHA2 and Ephrin-A1 proteins were detected in human and mouse lens paraffin-embedded sections. Briefly, sections were deparaffinized, hydrated, and immersed in citrate buffer (10 mM sodium citrate, 0.05% Tween 20, pH 6.0) for 10 minutes at 95°C. Primary antibodies were incubated with samples and then detected by Biotinylated secondary antibody and avidin–biotin–peroxidase system (Vector). Color immunostaining was revealed using diaminobenzidine (Vector). Images were taken using a fluorescent Leica DM-IRE2 microscope equipped with a SPOT RT-SE digital camera (Diagnostic Instrument) and analyzed with MetaMorph software 6.1r4 (Universal Imaging). Antibodies used include: goat anti-mouse EPHA2 ectodomain, goat anti-human EPHA2 (R&D Systems, Minneapolis, MN), rabbit anti-EPHA2 and anti-ephrin-A1, goat anti-HSP25 and mouse anti-phospho-ERK, rabbit anti-ERK (Santa Cruz Biotechnology, Santa Cruz, CA), rabbit anti-phospho-HSP25, anti-phospho-AKT, anti-Akt, anti-GAPDH (Cell Signaling), mouse monoclonal anti-N-cadherin (BD Biosciences). Rabbit-anti-α,β,γ-crystallin were kindly provided by Dr. Zigler (National Eye Institute).
Tissue Extraction and Immunoblot Analysis
Lenses were dissected from eyes and homogenized in ice-cold lysis buffer containing 20 mmol/L Tris (pH 7.4), 125 mmol/L NaCl, 10% glycerol, 1% Triton X-100,0.5% DCA, 0.1% SDS, 20 mmol/L NaF, 1 mmol/L phenylmethylsulfonyl fluoride, µg/mL aprotinin, 4 µg/mL leupeptin, and 1 mmol/L Na 3 VO 4 . Then samples were centrifuged at 13,000 g for 10 minutes at 4°C. Protein concentrations in supernatant were assessed using the bicinchoninic acid protein assay kit (Bio-Rad, Hercules, CA). Equal amounts of protein extracts were resolved by 4–20% SDS-PAGE and electrotransferred onto polyvinylidene difluoride membranes (Millipore, Bedford, MA), which were then blotted with the indicated antibodies. Slit Lamp Biomicroscopy Mice were anesthetized by an intramuscular injection of Tribromoethanol at 200 mg/kg body weight followed by induction of mydriasis with tropicamide (1%) and phenylephrine (10%). The lenses were examined with slit lamp and the observations were recorded by digital photography. Subjects The Beaver Dam Eye Study The Beaver Dam Eye Study (BDES) is a population-based cohort study for age-related ocular diseases and was used as a discovery sample set. Informed consent was obtained from the participants following a protocol approved by the Institutional Review Board (IRB) of the University of Wisconsin; the tenets of the Declaration of Helsinki were observed. The population, the methodology, and the baseline parameters are described in detail elsewhere [37] . Genome-wide linkage was previously examined in this cohort using microsatellite markers and we obtained evidence for a cortical cataract locus on 1p36 [13] . DNA and phenotypes were available for 1401 individuals in 494 families. Characteristics of genotyped individuals were not different from those in the rest of the cohort; therefore, the genotyped data can be extrapolated to the full cohort. Retroillumination photographs were used to quantify cortical cataract. The lens photographs were graded based on the Wisconsin Cataract Grading System [37] . For grading cortical cataract, a grid was used with a central circle that occupies 2% of the entire lens surface, and subfields covered the remaining area, where each subfield was 12.25% of the total area. The percentage of each subfield with opacity was recorded and combined into a percentage of total opacity involvement for the eye. We used worst scores of cortical cataract during the 15-year observation period as quantitative traits. We also defined a binary trait of severe cortical cataract status: if the score indicated that ≥25% of the entire lens in either eye was affected we classified them as affected, whereas unaffected individuals were those with cortical scores5%. These SNPs were supplemented with 11 conserved non-coding SNPs identified through phylogenetic approaches. Finally, a set of intriguing coding and regulatory SNPs (N = 4) identified through re-sequencing were also genotyped. In total, 19 SNPs were genotyped in all three datasets, the BDES, UKTS, and BMES.
SNP Genotyping and Quality Control Metrics
We used two different techniques, TaqMan and SNPlex assays, to interrogate SNPs. The genotyping procedure was performed according to the manufacturer's protocol. Clustering algorithms for genotype assignment used three quality control steps: (1) removing wells (individuals) with a significant number of outlier SNPs, (2) setting a SNP pass value by assigning a pass or fail status for each SNP, and (3) for each passing SNP, a confidence value was calculated (call rate). A confidence value of at least 95% was required to retain a genotype call. We further cleaned the data by removing individuals with low quality DNA across the SNPs (at least 90% of SNPs met the threshold quality value). We calculated the error rate and no-call rate using 5% replicate plating of DNA prior to these filtering steps. The average error rate and no-call rate for SNPlex genotyping was 0.7% and 3.9%, respectively. The average error rate and no-call rate for TaqMan genotyping was 0.3% and 3.7%, respectively. Cleaned data were used in association analyses. All genotyped SNPs met Hardy-Weinberg equilibrium with a nominal P>0.05. We estimated allele frequencies using the FREQ program in S.A.G.E. (version 5.4.2), and 95% confidence intervals were reported ( Table S2 ). The program estimates allele frequencies using a maximum likelihood formulation that assumes a random mating population. Standard errors are computed by numerical double differentiation of the log likelihood ( Table S2 ). We also examined linkage disequilibrium (LD) blocks in each dataset using the HAPLOVIEW program (version 3.32).
Statistical Methods Association analysis for family data
All genotyped SNPs were tested for association using the ASSOC program in S.A.G.E. (version 5.3.1). The method in ASSOC is a maximum likelihood regression-based approach that allows appropriate handling of familial correlations, estimating as necessary variance components for polygenic , marital , family , and sibling effects as well as for individual random effect s, and that transforms both sides of the regression equation [49] (simultaneously estimating two transformation parameters) to remove skewness and kurtosis [27] . The model for the i th pedigree member is h(y i ) = h(f i )+ε i , where y i is the trait value, f i = α+βg i , g i is the genetic marker value, ε i is the sum of the random effects, and h is the George-Elston generalized modulus power transformation [27] . The George-Elston transformation is defined as This transformation involves both power ( ) and shift ( ) parameters that are simultaneously estimated, together with the other parameters of the model, by maximum likelihood under the assumption of multivariate normality across family members. Because the transformation is applied to both the trait value (y) and its expectation f , for quantitative traits the regression coefficients (β) are median unbiased estimates [49] to the extent that the model fits. In the case of binary traits, because the quantitative residuals (y) were obtained from logistic regression, the estimated regression coefficients (β) are not meaningful with respect to the magnitude of the effect, though they are so with respect to their statistical significance. Three genetic models ( g ), additive, dominant, and recessive with respect to a reference allele, were assessed at each SNP. The minor allele was selected as the reference allele. For example, a SNP in an additive model was coded as 0, 1, or 2 according to the number of reference alleles, whereas it was coded as 0 or 1 in a dominant model according to the absence or presence of the reference allele. To find the best model for the familial correlation structure, each familial variance component was tested in the model by itself and in combination with others. The most significant, but parsimonious, model was retained as the “null” model against which was contrasted models containing the SNPs as covariates. For the two family datasets BDES and UKTS, the variance components for sibling and random effects , along with a genetic model for a SNP, were included in the final analysis. For each SNP, the baseline model without the SNP covariate and an alternate model with the SNP covariate were contrasted. The likelihood was maximized with respect to the null model containing the variance components and the baseline parameter α, and the alternate model containing the same variance components and both α and β. We performed likelihood ratio tests by comparing twice the difference between two log likelihoods with a chi-square distribution, and Wald tests by dividing each estimate of β by its standard error, estimated by numerical double differentiation of the log likelihood, and comparing the quotient to a standard normal distribution. Thus we obtained two P values that would be asymptotically identical. We examined the residuals ([ h(y i )−h(α+βg i ) ]) in a final model that included the most significant SNP by plotting a normal quantile-quantile (normal Q-Q) plot. Regardless of the distribution of y , normality of the residuals is required for the association result to be valid. We also conducted association analyses on the normalized traits, forcing the marginal distribution of the analyzed trait to be about normally distributed under the null hypothesis, by taking the inverse standard normal transformation of the empirical quantile that was obtained from the formula [ r(y)−1/3 ] divided by (n+1/3) , where r(y) is the rank of y [50] . To evaluate the ability of the George-Elston transformation to achieve normality, we compared residuals without transformation to those with the George-Elston transformation, and to those with the George-Elston transformation when the initial trait was inverse normal transformed. We examined the distributions of residuals from the final models using the quantitative cortical cataract trait in the BDES and in UKTS. Since the estimates (β-coefficients) for the quantitative trait, after the George-Elston transformation is applied to both sides of the regression equation, are median unbiased estimates, we report these estimates as our effects that measure net change, after adjusting for other covariates, due to a dominant or recessive genotype, or per copy of a reference allele (additive model). The estimate measures the net percentage change in cataract score ranging from 0 to 100%. For the severe binary cortical cataract trait, as the George-Elston transformation was not sufficient to obtain normality in both family datasets, we report only P values from inverse normal transformed traits. For comparability, P values from both the quantitative and binary traits in the main text were from inverse normal transformed traits, and estimates for the quantitative cortical cataract were only reported for quantitative traits without inverse normal transformation. We also report P values from the likelihood ratio tests and Wald tests of the inverse normal transformed quantitative and binary traits.
Association analysis for unrelated data
For the unrelated BMES data, we performed ordinary least squares regression of quantitative traits on allele dosage as implemented in the PLINK program (version 1.0.1) [51] . We used Wald tests based on t-distributions, and regression coefficients (β-coefficients) and asymptotic P values are reported. We performed the Cochran-Armitage (additive) trend test using an age-matched (age at least 70 years) case-control set, comprising cases with cortical score ≥25% and controls with cortical score
📊 Figures
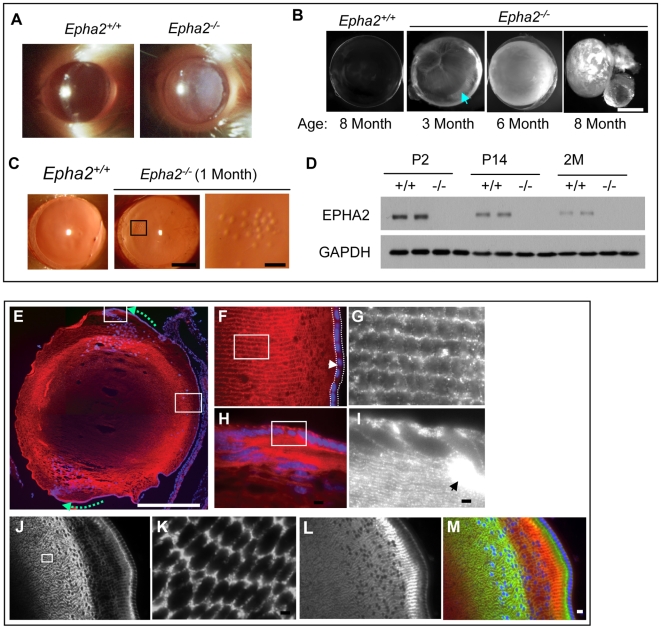
Figure 1
Development of progressive cataract in Epha2 knockout mice and characterization of spatial and temporal regulation of EPHA2 expression in the lens.
(Au2013C) Epha2 homozygous deletion in mice causes development of progressive cataract. (A) Cataracts were visible by gross inspection in homozygous Epha2 knockout mice ( Epha2 u2212/u2212 ) between 5...
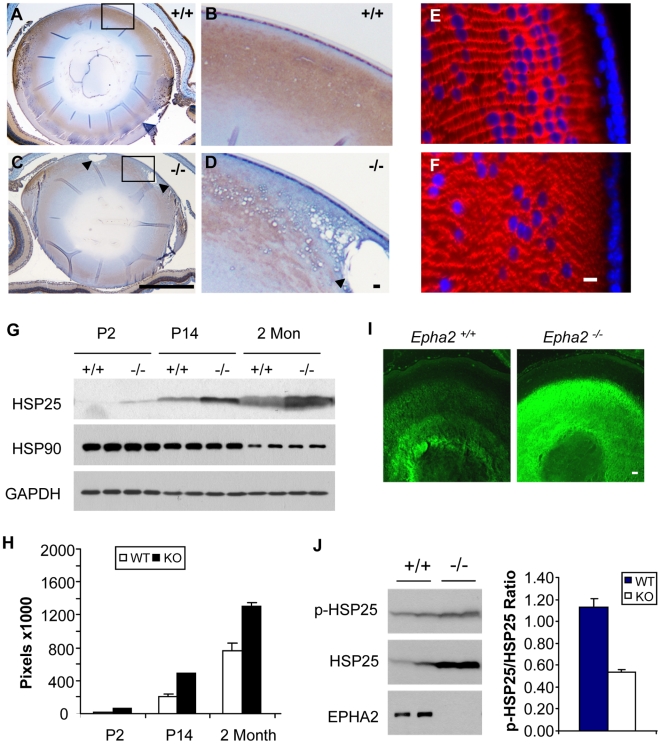
Figure 2
Structural alteration and stress responses in Epha2 u2212/u2212 lens.
(Au2013D) Expression of ephrin-A1, a ligand for EPHA2. Note the disorganized ephrin-A1 expression and formation of vacuoles in the Epha2 u2212/u2212 lens (arrow heads). Scale bars: 1 mm for A and C; 1...
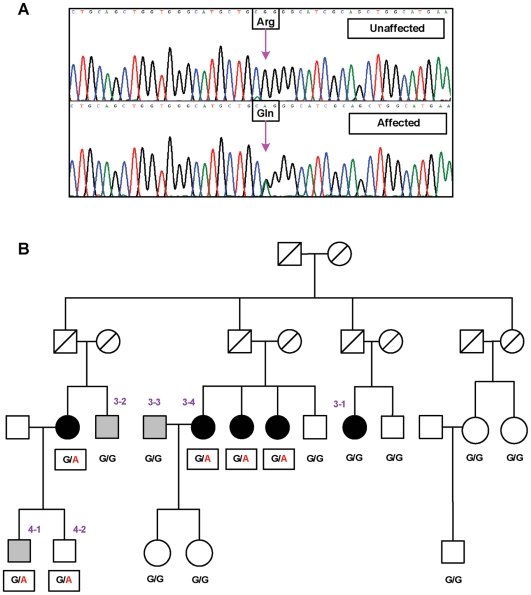
Figure 3
Characterization of a new coding variant Arg721Gln in exon 13.
(A) An example electropherogram of the coding strand is displayed for an affected and an unaffected individual, with the arrow marking the variant. Individuals with disease were heterozygotes (CAG) fo...
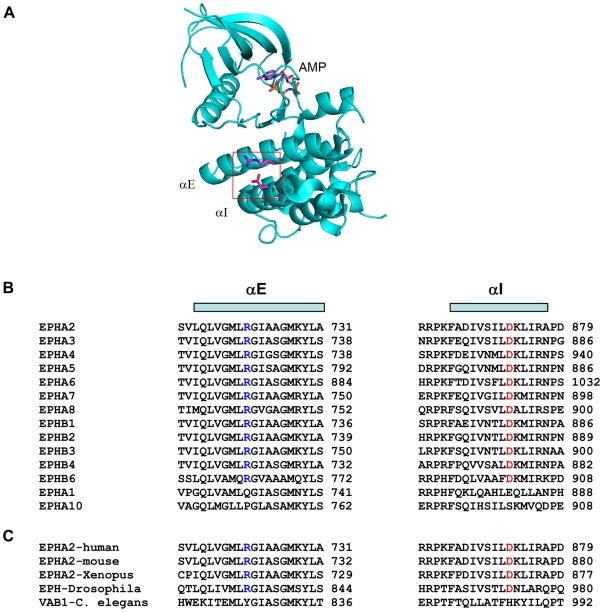
Figure 4
Concordant conservation of Arg721 and Asp872 in EPH kinase domains.
(A) Examination of crystal structure of EPHA2 kinase domain reveals that Arg721 in u03b1E forms a salt bridge with Asp872 in u03b1I. (B) Concordant conservation of Arg721 and Asp872 in different membe...
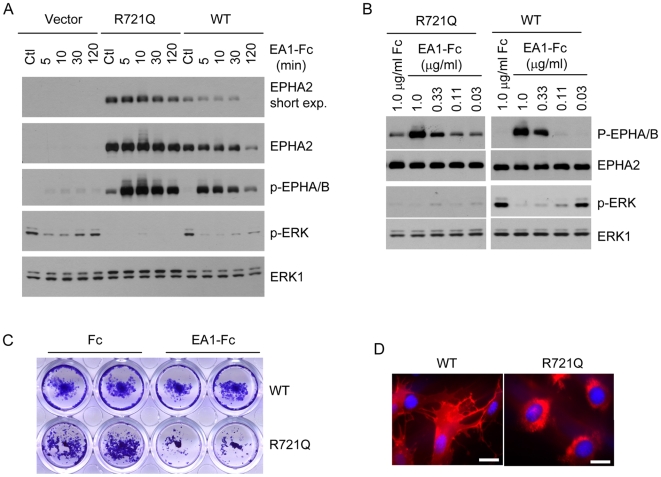
Figure 5
Functional characterization of Arg721Gln variant associated with human cataract.
(A,B) Arg721Gln mutation causes an increased basal activation of EPHA2 kinase, which was correlated with dramatically reduced basal ERK1/2 activities. In a kinetic study (A), HEK 293 cells expressing ...
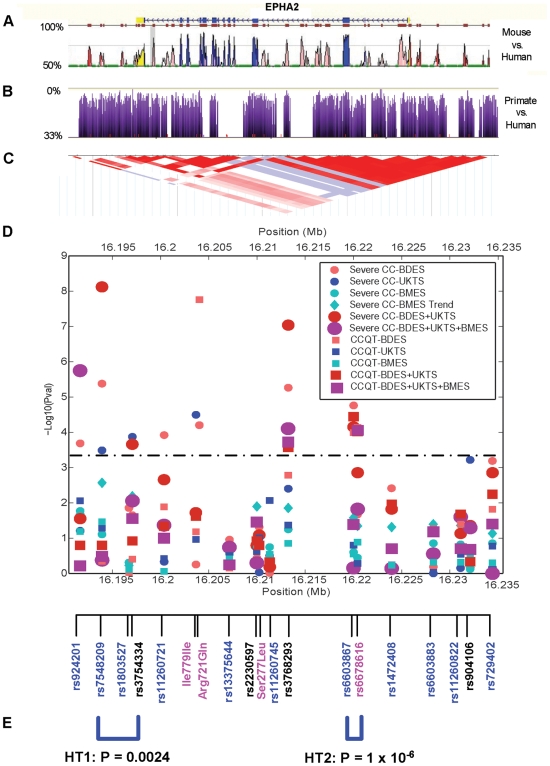
Figure 6
Single SNP and haplotype association results for EPHA2 .
Markers were selected based on phylogenetic footprinting in mouse-human (A), or phylogenetic shadowing in human-primates (B), or a tag-based approach using LD from the CEU HapMap sample (C). Markers i...
Figure images are served from the NIH/NLM PubMed Central Open Access Subset or Europe PMC; copyright remains with the publishers and authors.
💬 Discussion
0 commentsNo comments yet. Be the first to start a discussion!
Leave a Comment