Abstract
Sir2 is a central regulator of yeast aging and its deficiency increases daughter cell inheritance of stress- and aging-induced misfolded proteins deposited in aggregates and inclusion bodies. Here, by quantifying traits predicted to affect aggregate inheritance in a passive manner, we found that a passive diffusion model cannot explain Sir2-dependent failures in mother-biased segregation of either the small aggregates formed by the misfolded Huntingtin, Htt103Q, disease protein or heat-induced Hsp104-associated aggregates. Instead, we found that the genetic interaction network of SIR2 comprises specific essential genes required for mother-biased segregation including those encoding components of the actin cytoskeleton, the actin-associated myosin V motor protein Myo2, and the actin organization protein calmodulin, Cmd1. Co-staining with Hsp104-GFP demonstrated that misfolded Htt103Q is sequestered into small aggregates, akin to stress foci formed upon heat stress, that fail to coalesce into inclusion bodies. Importantly, these Htt103Q foci, as well as the ATPase-defective Hsp104Y662A-associated structures previously shown to be stable stress foci, co-localized with Cmd1 and Myo2-enriched structures and super-resolution 3-D microscopy demonstrated that they are associated with actin cables. Moreover, we found that Hsp42 is required for formation of heat-induced Hsp104Y662A foci but not Htt103Q foci suggesting that the routes employed for foci formation are not identical. In addition to genes involved in actin-dependent processes, SIR2-interactors required for asymmetrical inheritance of Htt103Q and heat-induced aggregates encode essential sec genes involved in ER-to-Golgi trafficking/ER homeostasis.
🔬 Techniques
🔭 Microscopes
🧬 Organisms
✨ Fluorophores
🧪 Sample Preparation
🏭 Microscope Brands
🧪 Reagent Suppliers
💻 Software Details
🏛️ Research Organizations (ROR)
Affiliated research institutions:
📋 Methods
Yeast strains and growth conditions
Yeast strains used in this study are listed in Supplemental Table S1 . The Yeast conditional temperature-sensitive (ts) collection of essential genes for the SGA analysis was a gift from Prof. Charles Boone. Yeast cells were grown in YPD or synthetic drop-out media with antibiotics added as indicated. SIR2 Synthetic Genetic Array (SGA) analysis using the conditional temperature-sensitive (ts) collection of essential genes The SIR2 (ts) SGA analysis was performed in duplicates as described [28] . The screen was run in the 1536-spot format using a SINGER ROTOR HDA Robot (Singer Instrument Co. Ltd.). Hits with the highest statistical probability to be true interactions were confirmed by microcultivation experiments in triplicate at 30, 34, and 38°C using the Bioscreen C system (Labsystems Oy, Helsinki, Finland). The optical density was measured every 30 minutes for 72 hours. The LSC (Logarithmic Strain Coefficient) values of growth rates were calculated and scored as described [28] . The heat map was made using TreeView [58] and Ospery 1.2.0 [59] was used for SIR2 essential gene network analysis. The physical interactions between SGA hits were obtained based on the BioGRID interaction database [60] . Fluorescence microscopy A Zeiss Axiovert 200 M fluorescence microscope was used to obtain images using GFP, Cy3 and DAPI channels. The ImageJ plugin “Iterative deconvolve 3-D” was used for all deconvolution images.
HttQ103-GFP expression and aggregation retention efficiency assay
Cells containing the pYES2-HttQ103-GFP plasmid were grown at 30°C to exponential phase (OD 600 about 0.5) in YNB-URA 2% raffinose. Htt103Q-GFP expression was induced by adding galactose to a final concentration of 2%. After 4 hours at 30°C cells were washed and resuspended in 1.5 ml Buffer P (10 mM NaH 2 PO 4 , 150 mM NaCl, 2% galactose; pH 7.2). All cells present during the expression of Htt103Q-GFP were marked by staining the cell wall components α-mannopyranosyl and α-glucopyranosyl with 0.2 mg/ml concanavalin A Alexa Fluor 647 (Invitrogen) for 30 minutes at room temperature. The cells were then washed in Buffer P, resuspended in YNB-URA with 2% glucose, which will switch off the Htt103Q-GFP expression, and grown at 30°C for one budding event. This makes it possible to distinguish between concanavalin A stained daughter cells present during Htt103Q-GFP expression and daughter cells produced subsequent to Htt103Q-GFP expression. Cells were fixed in 3.7% formaldehyde and segregation of aggregates was analyzed using fluorescence microscopy. The segregation assay of ts-alleles were performed in the same way but without concanvalin A staining. Cells were grown at 22°C to exponential phase, followed by induction and budding at different temperatures (26°C for sec18-1 and sec53-6 , 28°C for cmd1-1 and 32°C for myo2-14 ). Removal and retention assay of heat induced aggregate using concanavalin A staining The retention efficiency assay was performed as described [14] with concanavalin A staining (as described above) before the heat shock treatment. Aggregate retention and removal was distuinguished upon image analysis. Retention is determined as the percentage of aggregate-containing buds of the total number of buds generated from an aggregate-containing mother cell after the heat shock treatment (buds free of conA); Removal efficiency is determined as the perecentage of aggregate-free buds of the total number of buds already existing before heatshock; i.e. stained with conA. More than 300 budding events were quantified for each strains. Statistical analysis of aggregate segregation as a function of the generation time All statistical calculations were done in R-3.0.0 ( www.r-project.org ). Regression analysis was performed and showed that there is no statistically significant difference at p
Show full methods section
Yeast strains and growth conditions
Yeast strains used in this study are listed in Supplemental Table S1 . The Yeast conditional temperature-sensitive (ts) collection of essential genes for the SGA analysis was a gift from Prof. Charles Boone. Yeast cells were grown in YPD or synthetic drop-out media with antibiotics added as indicated. SIR2 Synthetic Genetic Array (SGA) analysis using the conditional temperature-sensitive (ts) collection of essential genes The SIR2 (ts) SGA analysis was performed in duplicates as described [28] . The screen was run in the 1536-spot format using a SINGER ROTOR HDA Robot (Singer Instrument Co. Ltd.). Hits with the highest statistical probability to be true interactions were confirmed by microcultivation experiments in triplicate at 30, 34, and 38°C using the Bioscreen C system (Labsystems Oy, Helsinki, Finland). The optical density was measured every 30 minutes for 72 hours. The LSC (Logarithmic Strain Coefficient) values of growth rates were calculated and scored as described [28] . The heat map was made using TreeView [58] and Ospery 1.2.0 [59] was used for SIR2 essential gene network analysis. The physical interactions between SGA hits were obtained based on the BioGRID interaction database [60] . Fluorescence microscopy A Zeiss Axiovert 200 M fluorescence microscope was used to obtain images using GFP, Cy3 and DAPI channels. The ImageJ plugin “Iterative deconvolve 3-D” was used for all deconvolution images.
HttQ103-GFP expression and aggregation retention efficiency assay
Cells containing the pYES2-HttQ103-GFP plasmid were grown at 30°C to exponential phase (OD 600 about 0.5) in YNB-URA 2% raffinose. Htt103Q-GFP expression was induced by adding galactose to a final concentration of 2%. After 4 hours at 30°C cells were washed and resuspended in 1.5 ml Buffer P (10 mM NaH 2 PO 4 , 150 mM NaCl, 2% galactose; pH 7.2). All cells present during the expression of Htt103Q-GFP were marked by staining the cell wall components α-mannopyranosyl and α-glucopyranosyl with 0.2 mg/ml concanavalin A Alexa Fluor 647 (Invitrogen) for 30 minutes at room temperature. The cells were then washed in Buffer P, resuspended in YNB-URA with 2% glucose, which will switch off the Htt103Q-GFP expression, and grown at 30°C for one budding event. This makes it possible to distinguish between concanavalin A stained daughter cells present during Htt103Q-GFP expression and daughter cells produced subsequent to Htt103Q-GFP expression. Cells were fixed in 3.7% formaldehyde and segregation of aggregates was analyzed using fluorescence microscopy. The segregation assay of ts-alleles were performed in the same way but without concanvalin A staining. Cells were grown at 22°C to exponential phase, followed by induction and budding at different temperatures (26°C for sec18-1 and sec53-6 , 28°C for cmd1-1 and 32°C for myo2-14 ). Removal and retention assay of heat induced aggregate using concanavalin A staining The retention efficiency assay was performed as described [14] with concanavalin A staining (as described above) before the heat shock treatment. Aggregate retention and removal was distuinguished upon image analysis. Retention is determined as the percentage of aggregate-containing buds of the total number of buds generated from an aggregate-containing mother cell after the heat shock treatment (buds free of conA); Removal efficiency is determined as the perecentage of aggregate-free buds of the total number of buds already existing before heatshock; i.e. stained with conA. More than 300 budding events were quantified for each strains. Statistical analysis of aggregate segregation as a function of the generation time All statistical calculations were done in R-3.0.0 ( www.r-project.org ). Regression analysis was performed and showed that there is no statistically significant difference at p
📊 Figures
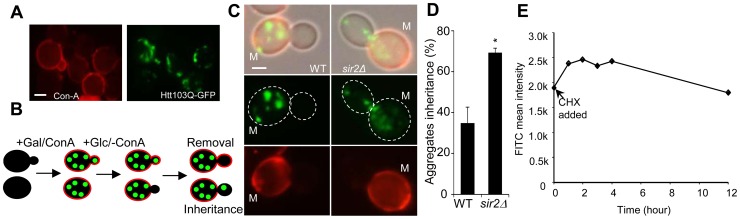
Figure 1
Sir2 is required for efficient mother-biased segregation of the Huntington disease model protein HttQ103.
A. Representive images of wild type cells, stained with concanavalin A (left panel), showing HttQ103-GFP aggregates (right panel) after turning off HttQ103-GFP expression. Scale bar u200a=u200a5 u00b5...
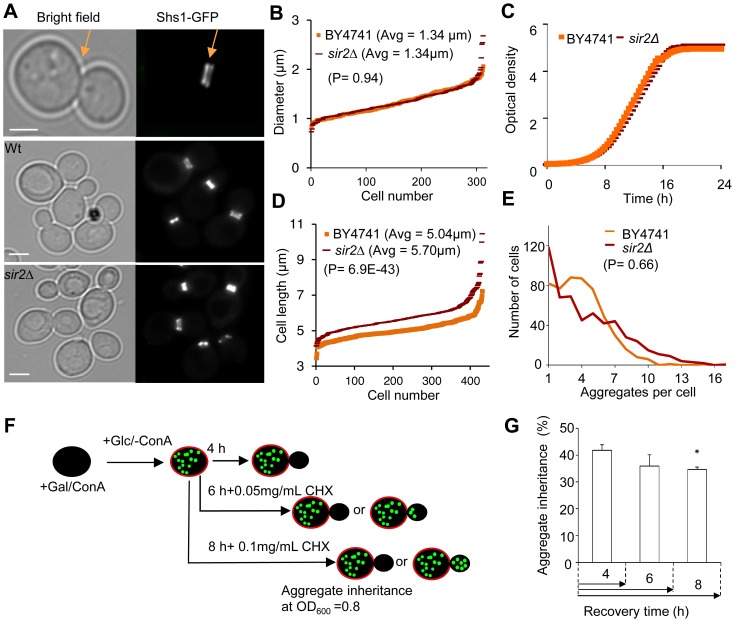
Figure 2
Increased inheritance of aggregates in sir2 daughter cells cannot be explained by changes in geometrical parameters and generation time.
A. Representative pictures of bud neck visualization using Shs1-Gfp as a reporter in the wild type and sir2 u0394 mutant (yellow arrows). Scale bars u200a=u200a5 u00b5m. B. Distribution of bud neck di...
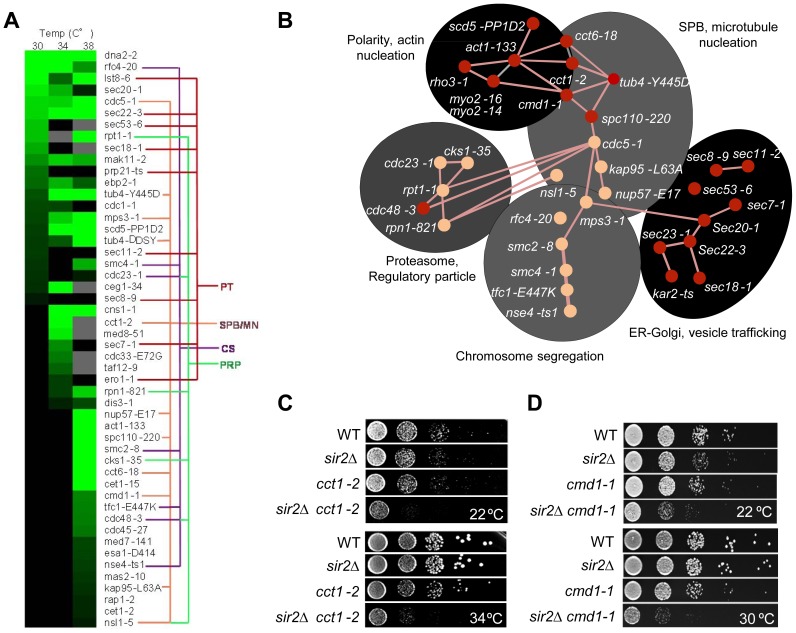
Figure 3
Genetic interactions of SIR2 with essential genes.
A. Heat map showing confirmed growth rate changes of SIR2/ ts essential allele double mutants at 30, 34 and 38u00b0C. The colored lines connecting alleles indicate that the genes belong to the same ge...
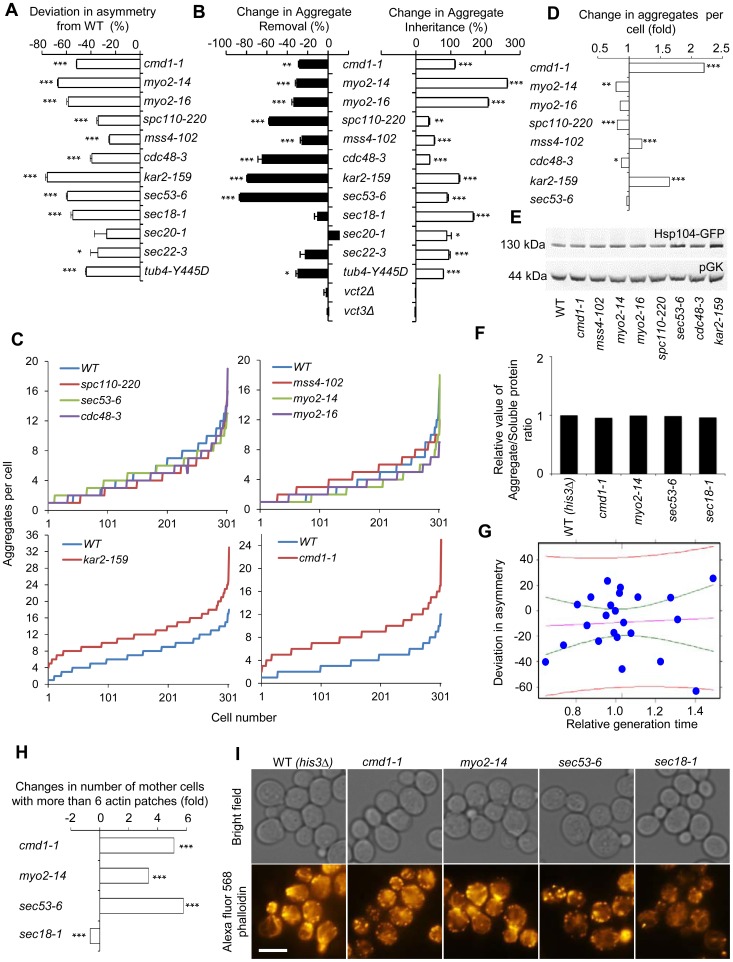
Figure 4
Actin/calmodulin/tubulin, phosphatidylinositol (4,5)-bisphosphate, and ER-Golgi trafficking, are required for asymmetrical inheritance of protein aggregates.
A. Temperature sensitive alleles of SIR2 essential interactors that display a reduced ability to establish aggregate asymmetry during cytokinesis. Negative values indicate a reduction in the percentag...
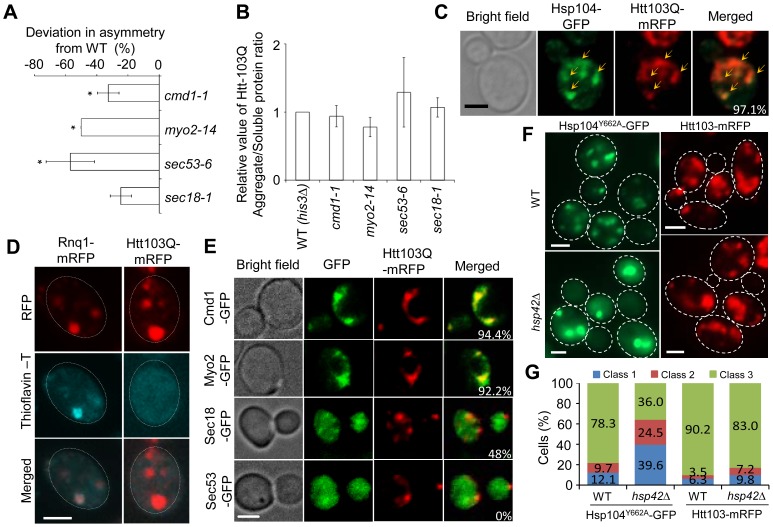
Figure 5
Htt103Q foci associate with Cmd1/Myo2/actin and require Cmd1, Myo2, and SEC genes for their mother cell-biased segregation.
A. SIR2 essential interactors cmd1-1, myo2-14, sec53-6 and sec18-1 display a reduced ability to establish mother-biased segregation of Htt-103Q aggregates. Negative values indicate a reduction in the ...
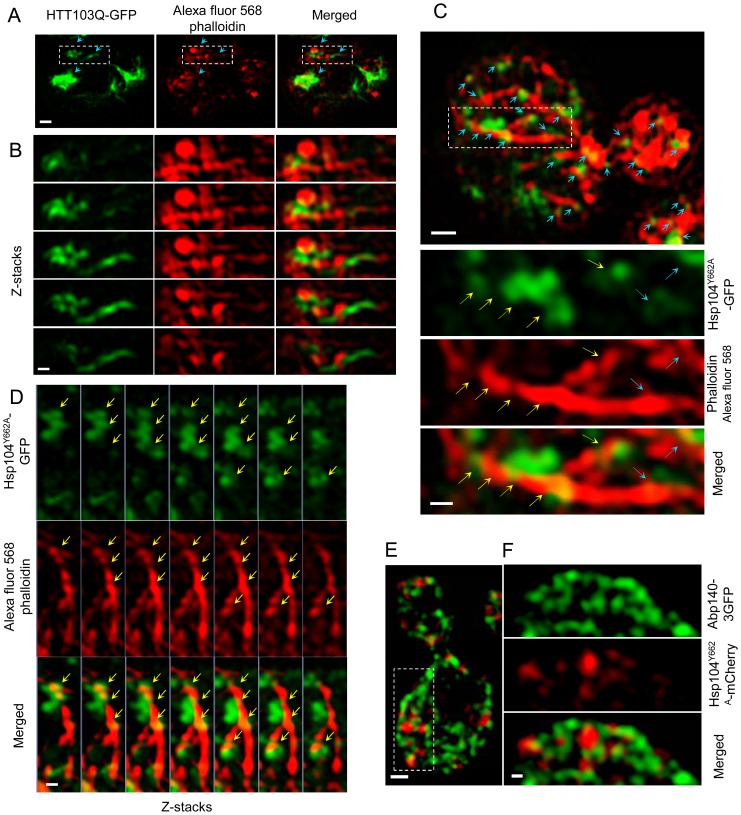
Figure 6
Super-resolution three-dimensional structured illumination microscopy (3D-SIM) revealing association of Htt103Q and Hsp104-linked stress foci with the actin cytoskeleton.
A&B. 3D-SIM images show that Htt103Q-GFP (green channel) aggregates are associated with the actin cytoskeleton (red channel: Alexa fluor 568 phalloidin). Blue arrows indicate regions where aggregates ...
Figure images are served from the NIH/NLM PubMed Central Open Access Subset or Europe PMC; copyright remains with the publishers and authors.
💬 Discussion
0 commentsNo comments yet. Be the first to start a discussion!
Leave a Comment