Abstract
The gamma-secretase complex is a major therapeutic target for the prevention and treatment of Alzheimer's disease. Previous studies have shown that treatment of young APP mice with specific inhibitors of gamma-secretase prevented formation of new plaques. It has not yet been shown directly whether existing plaques would be affected by gamma-secretase inhibitor treatment. Similarly, alterations in neuronal morphology in the immediate vicinity of plaques represent a plaque-specific neurotoxic effect. Reversal of these alterations is an important endpoint of successful therapy whether or not a treatment affects plaque size. In the present study we used longitudinal imaging in vivo with multiphoton microscopy to study the effects of the orally active gamma-secretase inhibitor LY-411575 in 10-11 month old APP:PS1 mice with established amyloid pathology and neuritic abnormalities. Neurons expressed YFP allowing fluorescent detection of morphology whereas plaques were labelled with methoxy-XO4. The same identified neurites and plaques were followed in weekly imaging sessions in living mice treated daily (5 mg/kg) for 3 weeks with the compound. Although LY-411575 reduced Abeta levels in plasma and brain, it did not have an effect on the size of existing plaques. There was also no effect on the abnormal neuritic curvature near plaques, or the dystrophies in very close proximity to senile plaques. Our results suggest that therapeutics aimed at inhibition of Abeta generation are less effective for reversal of existing plaques than for prevention of new plaque formation and have no effect on the plaque-mediated neuritic abnormalities, at least under these conditions where Abeta production is suppressed but not completely blocked. Therefore, a combination therapy of Abeta suppression with agents that increase clearance of amyloid and/or prevent neurotoxicity might be needed for a more effective treatment in patients with pre-existing pathology.
🔬 Techniques
✨ Fluorophores
🏭 Microscope Brands
🧪 Reagent Suppliers
🔴 Lasers
💻 Software Details
🏛️ Research Organizations (ROR)
Affiliated research institutions:
📋 Methods
Animals
Animals were crosses of APPswe/PS1dE9 mice [ 42 ] with the YFP expressing mice (thy-1:YFP line H +/- Tg mice [ 28 ]) 10–11 months old, obtained from Jackson Lab (Bar Harbor, Maine). All studies were conducted with approved protocols from the Massachusetts General Hospital Animal Care and Use Committee and in compliance with NIH guidelines for the use of experimental animals. Reagents Texas Red dextran 70,000 D was obtained from Molecular probes (Eugene, OR), methoxy-XO4 was a gift from Dr. Klunk (U. Pittsburgh). LY-411575 was synthesized as described [ 43 ], and tested for potency using cell based assays [ 44 ]. Common chemical reagents where obtained from Sigma (St. Louis, MO). In vivo treatment and multiphoton imaging The chronic treatment of APPswe/PS1dE9xYFP involved daily gavage administration of LY-411575 (5 mg/Kg) for 3 weeks. Control animals followed similar procedures but received vehicle instead of γ-secretase inhibitor treatment. Cranial window surgeries were performed as previously described [ 45 ]. Briefly, animals were anesthetized using isoflurane or avertin, the skin and periosteum were removed and a 6-mm diameter craniotomy was performed, making the anterior end immediately anterior to Bregma and the posterior end just anterior to Lambda. Glass windows (8 mm) were installed and secured with dental cement. All animals received an i.p injection of methoxy-XO4 (~2.5 mg/kg), a fluorescent compound that crosses the blood-brain barrier and binds amyloid plaques [ 46 ], the day before the surgery. To facilitate finding the same sites in the brain between sessions, Texas Red dextran (70,000 Da, 62.5 mg/kg in sterile PBS) was injected into a lateral tail vein to provide a fluorescent angiogram before every imaging session. As previously described [ 47 ] two-photon fluorescence was generated with 800 nm excitation from a mode-locked Ti:Sapphire laser (MaiTai, Spectra-Physics, Mountain View, CA mounted on a multiphoton imaging system (Bio-Rad 1024ES, Bio-Rad, Hercules, CA). A custom-built external detector containing three photomultiplier tubes (Hamamatsu Photonics, Bridgewater, NJ) collected emitted light in the range 380–480, 500–540 and 560–650 nm. 3-color images were acquired for plaques, neurites, and angiography simultaneously using a 20× objective (NA = 0.95, Olympus). In vivo images at low resolution (615 × 615 μm; z-step, 5 μm, depth, ~200 μm) were acquired to provide a map of the area, using the angiogram as a 3-D fiducial. LY-411575 treated animals were imaged before the commencement of the treatment (session 1, day 0) and reimaged on a weekly basis for the next 3 consecutive weeks (completing sessions 2, 3 and 4). Control treated animals followed the identical imaging schedule.
Show full methods section
Animals
Animals were crosses of APPswe/PS1dE9 mice [ 42 ] with the YFP expressing mice (thy-1:YFP line H +/- Tg mice [ 28 ]) 10–11 months old, obtained from Jackson Lab (Bar Harbor, Maine). All studies were conducted with approved protocols from the Massachusetts General Hospital Animal Care and Use Committee and in compliance with NIH guidelines for the use of experimental animals. Reagents Texas Red dextran 70,000 D was obtained from Molecular probes (Eugene, OR), methoxy-XO4 was a gift from Dr. Klunk (U. Pittsburgh). LY-411575 was synthesized as described [ 43 ], and tested for potency using cell based assays [ 44 ]. Common chemical reagents where obtained from Sigma (St. Louis, MO). In vivo treatment and multiphoton imaging The chronic treatment of APPswe/PS1dE9xYFP involved daily gavage administration of LY-411575 (5 mg/Kg) for 3 weeks. Control animals followed similar procedures but received vehicle instead of γ-secretase inhibitor treatment. Cranial window surgeries were performed as previously described [ 45 ]. Briefly, animals were anesthetized using isoflurane or avertin, the skin and periosteum were removed and a 6-mm diameter craniotomy was performed, making the anterior end immediately anterior to Bregma and the posterior end just anterior to Lambda. Glass windows (8 mm) were installed and secured with dental cement. All animals received an i.p injection of methoxy-XO4 (~2.5 mg/kg), a fluorescent compound that crosses the blood-brain barrier and binds amyloid plaques [ 46 ], the day before the surgery. To facilitate finding the same sites in the brain between sessions, Texas Red dextran (70,000 Da, 62.5 mg/kg in sterile PBS) was injected into a lateral tail vein to provide a fluorescent angiogram before every imaging session. As previously described [ 47 ] two-photon fluorescence was generated with 800 nm excitation from a mode-locked Ti:Sapphire laser (MaiTai, Spectra-Physics, Mountain View, CA mounted on a multiphoton imaging system (Bio-Rad 1024ES, Bio-Rad, Hercules, CA). A custom-built external detector containing three photomultiplier tubes (Hamamatsu Photonics, Bridgewater, NJ) collected emitted light in the range 380–480, 500–540 and 560–650 nm. 3-color images were acquired for plaques, neurites, and angiography simultaneously using a 20× objective (NA = 0.95, Olympus). In vivo images at low resolution (615 × 615 μm; z-step, 5 μm, depth, ~200 μm) were acquired to provide a map of the area, using the angiogram as a 3-D fiducial. LY-411575 treated animals were imaged before the commencement of the treatment (session 1, day 0) and reimaged on a weekly basis for the next 3 consecutive weeks (completing sessions 2, 3 and 4). Control treated animals followed the identical imaging schedule.
Image processing
Plaque size was measured using the blue fluorescence channel corresponding to methoxy-XO4 labelling. The maximum intensity projection images were thresholded, segmented, and measured using ImageJ software. The same identified plaques were measured from each imaging session such that each plaque served as its own control. The size of each plaque was normalized to 100% at day 0 and then all plaque measurements over time were averaged for summary statistics. To analyze neurite abnormalities higher resolution, images were captured to identify single neurites and plaques (125 × 125 μm; z-step, 0.8 μm, depth, 20 μm approximately). To exclude motion artifacts induced by heartbeat and breathing, image stacks were aligned using AutoDeblur software (AutoQuant). Images from the green channel (YFP neurites) were further processed with the blind 3D deconvolution function in AutoDeblur to remove background noise. 2D projections of stacks from the three channels were combined in Adobe Photoshop 7 (Adobe Systems). Stacks were used to measure plaque size, dystrophy size, neurite curvature and neurite diameter. Neuritic dystrophies, defined as the areas of swelling in the immediate surrounding of the senile plaques (up to 15 μm from plaques border) [ 30 , 48 ] were outlined on the 2D projections and the areas (in μm 2 ) were measured with Image-J software. We also measured as many neurites as we could confidently follow (that were at least 20 μm long) that were present and identifiable in each of the weekly imaging sessions. Thus, the curvature data represent longitudinal imaging with each neurite serving as its own control. The neurite curvature ratio was calculated by dividing the end-to-end distance of a neurite segment by the total length between the two segment ends as previously described [ 4 , 6 , 39 ]. Neurite shaft diameters were measured at each end and the midpoint of each segment to provide an average diameter along its length. To determine the effect of proximity to plaques, the average distance between the nearest methoxy-XO4 stained amyloid plaque and each neuritic segment was calculated using the average of the distance from the plaque edge to each end and the midpoint of the neuritic segment on the three-channel images, and only neurites located in the proximity of a senile plaque (within 50 μm from a plaque border) were included in the study. ELISA measurements Aβ 40 and 42 were quantified in plasma and brain samples using colorimetric human A-beta 40 and A-beta 42 ELISA kits (WAKO Chemicals USA) as previously described [ 49 ] with modifications. Plasma samples were obtained on a weekly basis from the saphenous vein at the end of each imaging session. Blood samples were collected in Eppendorf tubes treated with 10 μl of EDTA (10 mg/ml) and centrifuged at 3500 rpm for 7 minutes. Plasma was frozen at -80 C until the ELISA was run. At the end of the experiments the mice were killed, the brains hemisected and soluble and insoluble Aβ40 and Aβ42 were quantified in flash frozen homogenized hemibrains. For plasma ELISA, samples were diluted in phosphate buffer with 0.2% BSA, 0.4 M NaCl, 0.076% CHAPS, and 2 mM Na2EDTA. Plasma samples were analyzed in duplicate. For brain tissue ELISA, hemibrains were homogenized for 45 s at speed 20 (BioSpec Tissue-Tearor™) in extraction buffer (10 uL/mg brain mass) with protease inhibitor (Complete Protease Cocktail, Roche Diagnostics GmbH, Mannheim, Germany). Extraction buffer consisted of deionized water with 50 mM Tris HCl, 2 mM EDTA 2Na, 0.01% Methiolate Na, 400 mM NaCl, and 1%BSA. One millilitre of each homogenized brain was centrifuged at 15,000 RPM for 5 minutes at 4°C. The supernatant was removed (soluble Aβ, 1:10 final dilution), and the pellet was diluted 1:8 and homogenized in 70% formic acid (800 uL FA for a 100 mg pellet) and centrifuged at 15,000 RPM for 5 minutes at 4°C. Supernatant was removed again (insoluble Aβ) and neutralized in Tris buffer with pH = 11 (1 M Tris with 70% formic acid). The insoluble fraction was further diluted for Aβ 42 measurements. Brain samples were analyzed in triplicate. Standard curves for both plasma and brain tissue ELISAs were made using human Aβ40 and Aβ42 standards provided in the ELISA kit. Absorbance was measured with a Wallac Victor 2 1420 Multilabel Counter (PerkinElmer Life & Analytical Sciences, Shelton, CT) and data were expressed as pmol/g wet tissue.
Statistical analysis
To assess the dynamics of senile plaque size, neurite curvature, and plasma Aβ levels, two-way ANOVA for repeated measures were used. Dystrophy size, neurite diameter and Aβ brain levels were assessed with one-way ANOVA.
📊 Figures
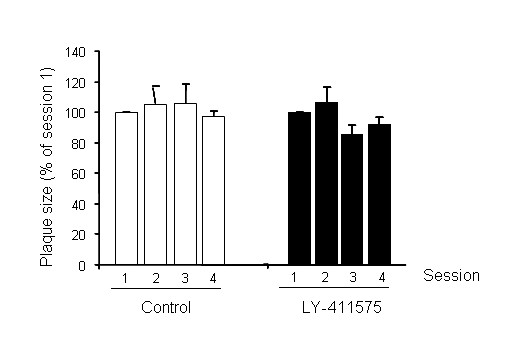
Figure 1
LY-411575 treatment had no effect on the size of individual plaques in APPswe/PS1dE9xYFP mice . Individual, identified plaques were monitored with longitudinal imaging during the course of the treatme...
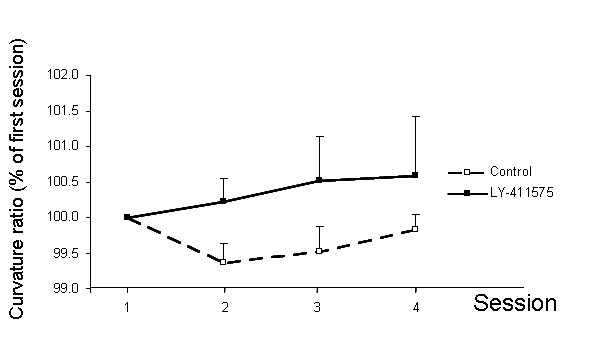
Figure 2
LY-411575 treatment had no effect on neuritic curvature in APPswe/PS1dE9xYFP mice when neurites up to 50 u03bcm from the plaque border were analyzed . Data are representative of 44u2013138 neurites fr...
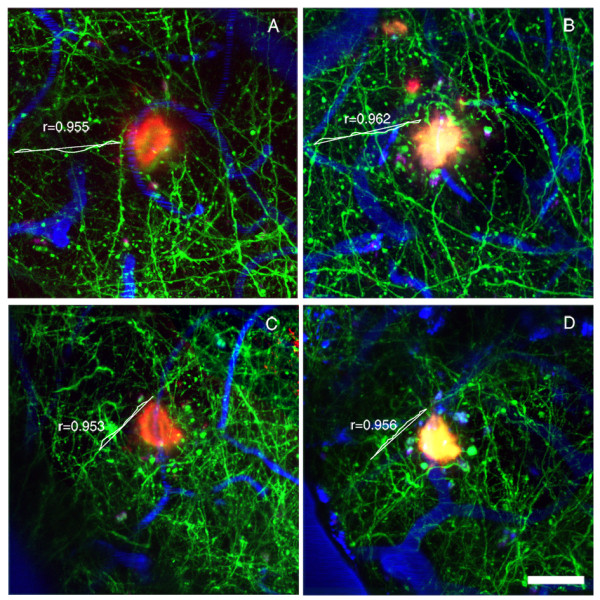
Figure 3
Representative example of the effect of LY-411575 treatment on neuritic curvature in APPswe/PS1dE9xYFP mice . Animals received daily oral administration of LY-411575 (5 mg/Kg) or vehicle for 3 weeks. ...
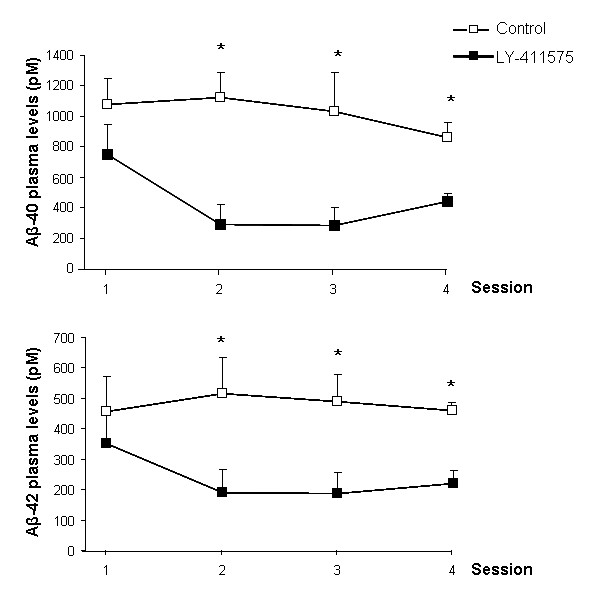
Figure 4
LY-411575 treatment reduced Au03b240 and 42 plasma levels in APPswe/PS1dE9xYFP mice . Animals received daily oral administration of LY-411575 (5 mg/Kg) or vehicle for 3 weeks. Plasma samples were take...
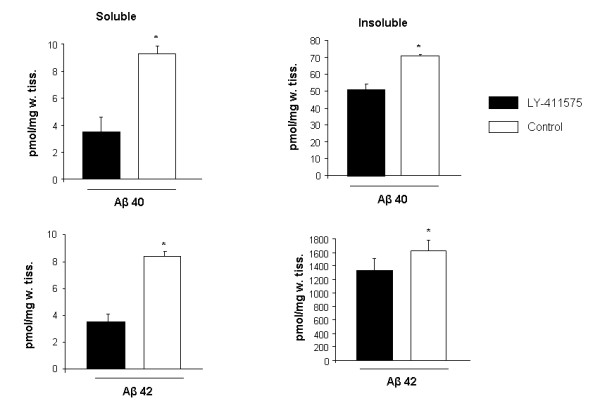
Figure 5
LY-411575 treatment reduced soluble and insoluble Au03b240 and 42 brain levels in APPswe/PS1dE9xYFP mice . All measurements were done in triplicate and data are representative of 4u20136 mice. Student...
Figure images are served from the NIH/NLM PubMed Central Open Access Subset or Europe PMC; copyright remains with the publishers and authors.
💬 Discussion
0 commentsNo comments yet. Be the first to start a discussion!
Leave a Comment