Abstract
AbstractSlow wave activity (SWA) is a characteristic brain oscillation in sleep and quiet wakefulness. Although the cell types contributing to SWA genesis are not yet identified, the principal role of neurons in the emergence of this essential cognitive mechanism has not been questioned. To address the possibility of astrocytic involvement in SWA, we used a transgenic rat line expressing a calcium sensitive fluorescent protein in both astrocytes and interneurons and simultaneously imaged astrocytic and neuronal activityin vivo. Here we demonstrate, for the first time, that the astrocyte network display synchronized recurrent activityin vivocoupled to UP states measured by field recording and neuronal calcium imaging. Furthermore, we present evidence that extensive synchronization of the astrocytic network precedes the spatial build-up of neuronal synchronization. The earlier extensive recruitment of astrocytes in the synchronized activity is reinforced by the observation that neurons surrounded by active astrocytes are more likely to join SWA, suggesting causality. Further supporting this notion, we demonstrate that blockade of astrocytic gap junctional communication or inhibition of astrocytic Ca2+transients reduces the ratio of both astrocytes and neurons involved in SWA. Thesein vivofindings conclusively suggest a causal role of the astrocytic syncytium in SWA generation.
🔬 Techniques
💻 Software
✨ Fluorophores
🧪 Sample Preparation
🔬 Cell Lines
🏭 Microscope Brands
🧪 Reagent Suppliers
🔴 Lasers
💻 Software Details
🏛️ Research Organizations (ROR)
Affiliated research institutions:
📋 Methods
Animals
All animal procedures were performed according to standard ethical guidelines and approved by the local Animal Care Committee and the Government Office for Pest County (reference numbers PEI/001/3671-4/2015 and 22.1/2727/3/2011). The transgenic rat strain stably expressing the CAG-GCaMP2 transgene was established earlier using the Sleeping Beauty transposon based gene delivery technology 21 . Additionally, two other homozygous rat strains were established with the same transposon technology: one expressing the red fluorescent RGECO calcium indicator under the regulation of the astrocyte specific GFAP promoter; the other strain containing both the CAG-GCaMP2 and the rGFAP-RGECO transgenes in a homozygous (one haploid copy) form was established by the careful selection of the progenies from crossing the two original homozygous transgenic strains. In vivo experiments were performed on 4–8 week old transgenic male and female Wistar rats that were housed in a 12 hour light/dark cycle. All drugs were obtained from Sigma-Aldrich unless stated otherwise.
Slice culture
Since expression of GCaMP2 was largely reduced in acute slice preparations 21 we used organotypic hippocampal slice cultures prepared according to the method of Kovács et al . 79 , with minor modifications. Briefly, 380 μm thick hippocampal slices were cut from 6-day-old Wistar rats using a McIlwain tissue chopper, and separated in ice-cold Gey’s balanced salt solution (GBSS) composed of (mM): 33 glucose, 2 CaCl 2 , 1.03 MgCl 2 , 0.28 MgSO 4 , 0.22 KH 2 PO 4 , 27.02 NaHCO 3 , 120 NaCl, 0.84 Na 2 HPO 4 , 5 KCl, 10 HEPES, pH 7.2. The slices were placed on a culture plate insert (MilliCell-CM, Merck Millipore, Budapest, Hungary) and the inserts were transferred to a 6-well culture plate. Each well contained 1 ml of culture medium consisting of 50% Opti-MEM® I Reduced Serum Medium (Life Technologies, Budapest, Hungary), 25% HBSS, 25% horse serum, D-glucose (0.25 g/ml) and gentamicin (0.1 mg/ml). The organotypic cultures were maintained in a humidified incubator bubbled with a 5% CO 2 /95% O 2 atmosphere at 37 °C for 3 days. On day 4, culture medium was replaced with another formulation and used afterwards (76% Neurobasal®-A Medium, minus phenol red (Life Technologies), 1% GlutaMAX® Supplement, 2% B-27® Supplement, serum free, 1% D-glucose, 20% horse serum supplemented with (mM, final concentration): 0.1 D,L-α-Tocopherol, 0.5 ascorbic acid, 0.025 β-mercapto-ethanol; 0.1 mg/ml gentamicin). Culture medium was changed twice a week. Cultures were used for analyses within 3 weeks.
Show full methods section
Animals
All animal procedures were performed according to standard ethical guidelines and approved by the local Animal Care Committee and the Government Office for Pest County (reference numbers PEI/001/3671-4/2015 and 22.1/2727/3/2011). The transgenic rat strain stably expressing the CAG-GCaMP2 transgene was established earlier using the Sleeping Beauty transposon based gene delivery technology 21 . Additionally, two other homozygous rat strains were established with the same transposon technology: one expressing the red fluorescent RGECO calcium indicator under the regulation of the astrocyte specific GFAP promoter; the other strain containing both the CAG-GCaMP2 and the rGFAP-RGECO transgenes in a homozygous (one haploid copy) form was established by the careful selection of the progenies from crossing the two original homozygous transgenic strains. In vivo experiments were performed on 4–8 week old transgenic male and female Wistar rats that were housed in a 12 hour light/dark cycle. All drugs were obtained from Sigma-Aldrich unless stated otherwise.
Slice culture
Since expression of GCaMP2 was largely reduced in acute slice preparations 21 we used organotypic hippocampal slice cultures prepared according to the method of Kovács et al . 79 , with minor modifications. Briefly, 380 μm thick hippocampal slices were cut from 6-day-old Wistar rats using a McIlwain tissue chopper, and separated in ice-cold Gey’s balanced salt solution (GBSS) composed of (mM): 33 glucose, 2 CaCl 2 , 1.03 MgCl 2 , 0.28 MgSO 4 , 0.22 KH 2 PO 4 , 27.02 NaHCO 3 , 120 NaCl, 0.84 Na 2 HPO 4 , 5 KCl, 10 HEPES, pH 7.2. The slices were placed on a culture plate insert (MilliCell-CM, Merck Millipore, Budapest, Hungary) and the inserts were transferred to a 6-well culture plate. Each well contained 1 ml of culture medium consisting of 50% Opti-MEM® I Reduced Serum Medium (Life Technologies, Budapest, Hungary), 25% HBSS, 25% horse serum, D-glucose (0.25 g/ml) and gentamicin (0.1 mg/ml). The organotypic cultures were maintained in a humidified incubator bubbled with a 5% CO 2 /95% O 2 atmosphere at 37 °C for 3 days. On day 4, culture medium was replaced with another formulation and used afterwards (76% Neurobasal®-A Medium, minus phenol red (Life Technologies), 1% GlutaMAX® Supplement, 2% B-27® Supplement, serum free, 1% D-glucose, 20% horse serum supplemented with (mM, final concentration): 0.1 D,L-α-Tocopherol, 0.5 ascorbic acid, 0.025 β-mercapto-ethanol; 0.1 mg/ml gentamicin). Culture medium was changed twice a week. Cultures were used for analyses within 3 weeks.
Immunohistochemistry
GAD67/GCaMP2 and GFAP/GCaMP2 colocalization studies were performed using a slightly modified protocol of Weiswald et al . 80 . Briefly, organotypic cultures were fixed in 4% paraformaldehyde +1% Triton X-100 for 3 h at 4 °C. Slices were washed and then further fixed sequentially in 50%, 90% and 50% methanol for 5 min at −20 °C. Cultures were washed in PBS, blocked with 1% bovine serum albumin +5% goat serum +0.1% Triton X-100 for 1 h at 4 °C. Rabbit anti-GFP (1:500, ab290, Abcam), mouse anti-GFAP (1:200, sc-33673, Santa Cruz) and mouse anti-GAD67 (1:1000, MAB5406, Merck Millipore) were dissolved in the blocking solution and the slices were incubated for 2 h at room temperature on a rocker shaker. After incubation in primary antibodies, the sections were washed, and incubated in goat anti-rabbit IgG Alexa Fluor 488 and goat anti-mouse IgG Alexa Fluor 546 secondary antibodies (1:200; Life Technologies) for 4 h at room temperature. Finally, the nuclei were stained with 2 µM Hoechst 33342 (10 min, RT) and the slices were covered with ProLong® Gold (Life Technologies). To investigate NeuN/GCaMP2 and Iba1/GCaMP2 colocalization, organotypic cultures were fixed in 4% paraformaldehyde, washed, and pretreated with 3% hydrogen peroxide for 10 min followed by 1% bovine serum albumin in PB containing 0.5% Triton X-100 for 30 min at room temperature. Then, the cultures were placed in goat anti-GFP (1:1000, ab5450, Abcam) for 24 h at room temperature. After incubation in primary antiserum, the sections were washed and incubated in biotinylated donkey anti-goat secondary antibody (1:1000; Jackson ImmunoResearch, West Grove, PA) for 1 h followed by washes and incubation in avidin-biotin-horseradish peroxidase complex (1:500; Vector Laboratories) for 1 h. Subsequently, sections were treated with FITC-tyramide (1:8000) and H 2 O 2 in Tris hydrochloride buffer (0.1 M, pH = 8.0) for 6 min. Then, mouse anti-NeuN as a marker of neuronal nuclei (1:500; Millipore, Billerica, MA, cat. number: MAB377) or rabbit anti-ionized calcium-binding adapter molecule 1 (Iba1) as a marker of microglial cells (1:1000; Wako, cat. number: 019–197419) was applied at room temperature overnight. Sections were then incubated in donkey Alexa Fluor 594 anti-mouse secondary antibody (Life Technologies, Grand Island, NY) for 2 h. Finally, the sections were mounted, dehydrated and coverslipped with Cytoseal 60 (Stephens Scientific, Riverdale, NJ). In vitro imaging Slice cultures were transferred to the recording chamber mounted on an upright microscope (Olympus BX61WI) equipped with a FluoView300 confocal laser-scanning system (Olympus, Tokyo, Japan) or on a two-photon microscope (Femto2D, Femtonics, Hungary) using a 40× water immersion objective (N.A. 0.80). Slices were superfused with oxygenated (95% O 2 , 5% CO 2 ) artificial cerebrospinal fluid (ACSF) (5 ml/min, 30 °C), containing (in mM): 129 NaCl; 1.23 NaH 2 PO 4 ; 10 glucose; 1.6 CaCl 2 ; 3 KCl; 21 NaHCO 3 ; 1.8 mM MgSO 4 (pH 7.4). In confocal microscopy GCaMP2 fluorescence was excited at 488 nm and emission was detected between 510–530 nm. In two-photon microscopy GCaMP2 was excited at 900 nm with a MaiTai femtosecond laser source (Spectra Physics, Santa Clara, CA, USA) and the emitted fluorescence was monitored at 475–575 nm. In vitro electrophysiological recordings Whole-cell recordings in organotypic slices were made at ∼32 °C from cells identified under continuous GCaMP2 imaging. Borosilicate glass capillaries had open-tip resistances between 4–6 MΩ. For current clamp recordings the intracellular solution contained (in mM): 135 K-gluconate, 10 HEPES, 10 Na-phosphocreatine, 4 KCl, 4 Mg-ATP, 0.3 Na-GTP, pH 7.2 (adjusted with KOH). Signals were recorded with Multiclamp 700A amplifiers (Axon Instruments, Foster City, CA, USA), sampled at 10 kHz (Digidata 1320 A, Axon Instruments), and stored on a personal computer for subsequent analysis. Liquid junction potential of −15.7 mV was calculated by the Clampex software and used to determine cell membrane potentials. Action potentials were evoked by somatic current injection (0.5–1.0 nA, 2 ms). Glutamate (100 μM), ATP (1 mM) and ionomycin (10 μM) were applied in perfusion bath.
Cranial window implantation
Rats were anesthetized with ketamine-xylazine (ketamine 100 mg/kg, xylazine 10 mg/kg) or fentanyl-medetomidine-midazolam mixtures (fentanyl 0.05 mg/kg, medetomidine 0.5 mg/kg, midazolam 5.0 mg/kg). Depth of anesthesia was assessed by monitoring pinch withdrawal and eyelid reflex. Opticorn-A ophthalmic ointment was applied to the eyes to prevent cornea dehydration during surgery. A 4–5 mm-diameter craniotomy was made above the primary visual cortex in the left hemisphere under a dissection microscope by using stainless steel drilling bits. After opening the skull, the cortical surface was kept moist with Ringer’s buffer. Dura mater was carefully removed, and 2 µl SR101 (200 µM) was pipetted onto the brain surface and left for 5 min to stain astrocytes 81 , 82 . The exposed cortex was sealed with a stack of 4 mm diameter glass coverslips glued together using Norland Optic Adhesive (Thorlabs, Newton, NJ, USA). In some experiments where an extracellular recording electrode was inserted into the craniotomy, part of the hole was left open and was covered only with low-melting point agarose. The rat was transferred into the imaging set-up, placed on a warming plate (37 °C), and head-fixed in a stereotaxic frame (David Kopf Instruments, Tujunga, CA, USA). Alternatively, a custom-made metal bar was attached to the skull with C&B-Metabond® adhesive cement (Parkell, Edgewood, NY, USA) to allow for subsequent head fixation during calcium imaging. In vivo imaging and electrophysiological recording GCaMP2 expressing neurons in 100–300 µm depth (corresponding to layer 2) of the V1 primary visual cortex area were imaged using a two-photon microscope (Femto2D-Dual, Galvo-Resonant, Femtonics, Budapest, Hungary) equipped with a 16x water immersion objective excited by 875 nm laser line (Chameleon, Coherent, Santa Clara, CA, USA). GCaMP2 fluorescence was detected at 490–550 nm in either line-scan (32–156 Hz sampling rate) or full-frame (30–45 Hz sampling rate) mode. In experiments not performed on the day of the surgery, SR101 was reapplied intravenously to the tail vein in 10 mM (100 µl) at least 1 hour before the imaging 81 . SR101 has been proven not to label neurons 81 . Although oligodendrocyte labelling may occur after longer incubation 81 , oligodendrocytes are far less abundant 83 in the superficial layers of the cortex compared to astrocytes. Therefore, it is safe to identify SR101 positive cells as astrocytes. SR101 positive astroglia were detected at 570–640 nm. The length of imaging recording sessions was 60 or 300 s, sessions were repeated 6–24 times during the anesthesia. In many cases, imaging sessions were made at different regions within the V1 area. Possible respiratory coupling with the fluorescent signal was controlled by parallel recording of breathing rate with a thermocouple (5TC-TT-J-36-36, Omega Engineering, CT, USA) inserted into the animals’ nostril. Local field potential (LFP) recordings were made in the same cortical layer with glass capillaries (3–6 MΩ) filled with Ringer’s buffer, inserted underneath the coverslip under visual guidance. Drugs for perturbing astrocytic Ca 2+ signalling were administered by two different methods. CBX was injected i.p. in 100 mg/kg concentration during SWA imaging. This experimental design allowed us to directly compare imaging and LFP data obtained in the absence and presence of the inhibitor. In contrast to CBX, the Cx43 antibody and thapsigargin do not cross the blodd-brain barrier, therefore these agents were applied directly onto the cortical surface after removal of the dura. Cx43 antibody (0.75 mg/ml, 10 μl) was applied 24 h before the experiment to allow diffusion into the tissue. The ability of the antibody to penetrate into the brain at this time scale was confirmed by applying an Alexa-488 labelled secondary antibody in the same concentration in a wild-type, age-matched rat. 24 h after the application Alexa-488 fluorescence was clearly detectable even at 800 μm depth. Thapsigargin (0.5 mM, 10 μl) was also applied onto the brain surface 30 min before the experiment. Under these conditions thapsigargin was demonstrated to specifically inhibit astrocytic Ca 2+ signalling 44 .
Data evaluation
Cells on full frame GCaMP2 fluorescence images were identified by semi-automatic Matlab scripts under manual supervision. The identified regions of interests (ROIs) contained the soma of the cells slightly expanded by 2–3 pixels in all directions to reduce the noise in fluorescence intensity. The identified ROIs (in full-frame scan mode) or the cells around the line scan segments (in line-scan mode) were visually validated and the cell type (neuron or astrocyte) was determined based on the absence or presence of SR101 labelling in the same ROI. Average intensity in the identified ROIs was then calculated followed by subtraction of and dividing by the average intensity of ROIs in the first 10 samples.
Fluorescence peaks on the detrended
ΔF/F0 traces were identified using 2*SD as amplitude threshold and 0.1 as slope-to-peak threshold. Detection thresholds were selected after manually revising calculated ΔF/F0 traces from 2 animals. Spatial consistency of neuronal and astrocytic activities was assessed by calculating the number of manually validated cells showing recurrent Ca 2+ transients in the 0.5–2 Hz frequency range during the 60–300 s recording sessions and dividing this value by the number of validated neurons or astrocytes within the same field of view. The effect of the number of surrounding active cells on the activity of the enclosed neurons or astrocytes was calculated by determining the distance between all cell pairs in 5 different animals (N = 263478 cell pairs). Data from different experimental sessions on the same animals were pooled. Percentage of the enclosed cells’ involvement in the SWA was determined by counting the number of astrocytes or neurons showing SWA-related rhythmic activity and having 0, >1, >2, >3, >4 adjacent astrocytes or neurons within 100 µm. This count was divided by the number of all astrocytes or neurons having 0, >1, >2, >3, >4 adjacent astrocytes or neurons within 100 µm. For spectral analysis LFP recordings were bandpass filtered using Bessel filters. Wavelet analysis was performed using complex Morlet wavelets. Unless stated otherwise, data are expressed as means ± S.E.M. and were analyzed using one-way analysis of variances with Bonferroni post hoc tests (OriginPro 8.0). A value of P < 0.05 was considered significant.
Electronic supplementary material Supplementary information Supplementary Movie 1 Supplementary Movie 2 Supplementary Movie 3
📊 Figures
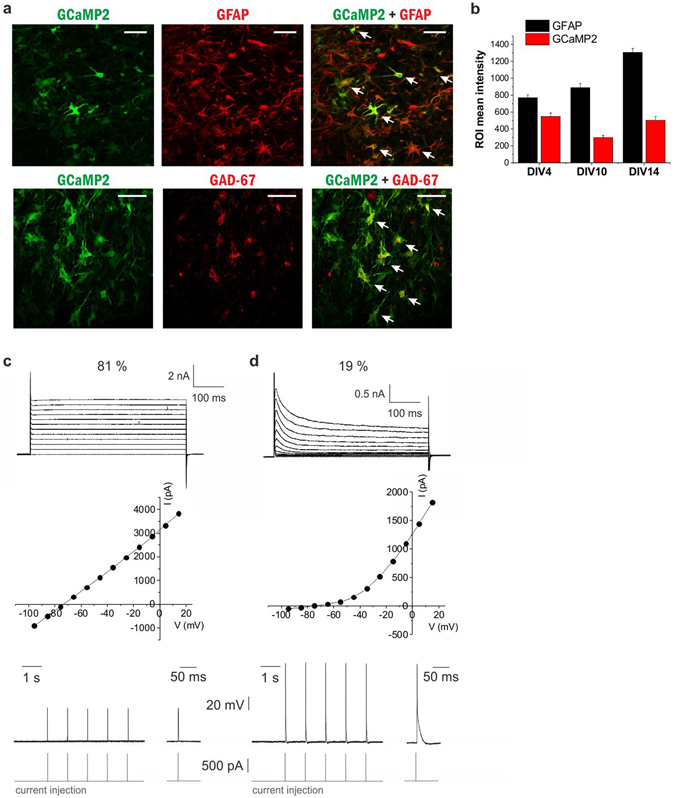
Figure 1
GCaMP2 is expressed in astrocytes and interneurons ( A ) Astrocytic and neuronal localization of GCaMP2 protein in organotypic cortical slices as shown by colocalization with the astrocyte-specific GF...
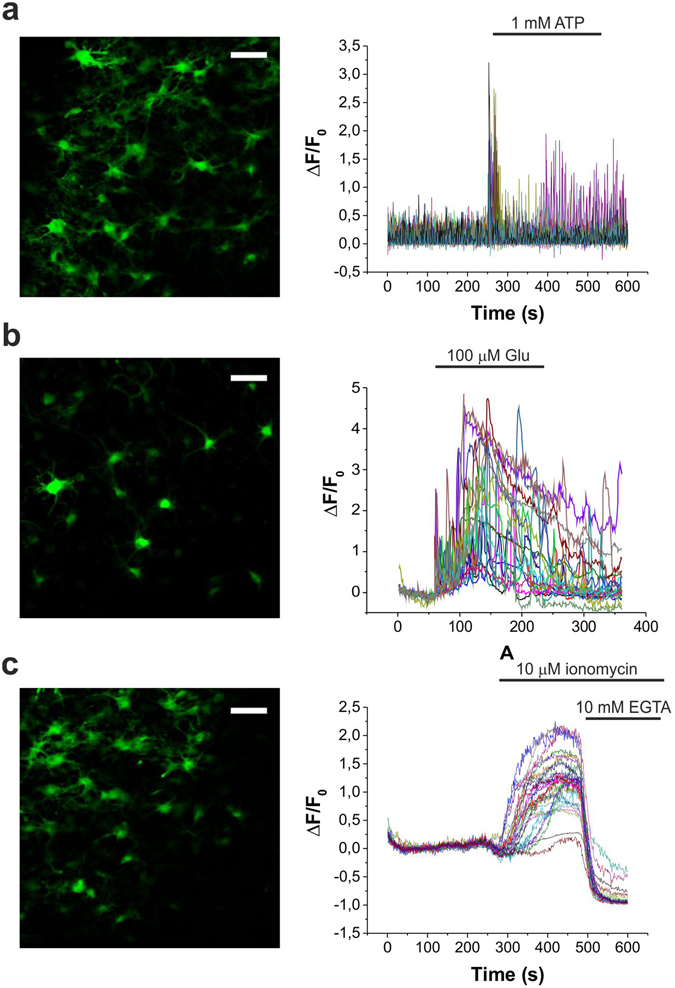
Figure 2
Pharmacological characterization of GCaMP2 response in organotypic cortical slices in vitro . ( Au2013C ) Representative fluorescent intensity changes of CAG-GCaMP2 in response to 1u2009mM ATP ( A , n...
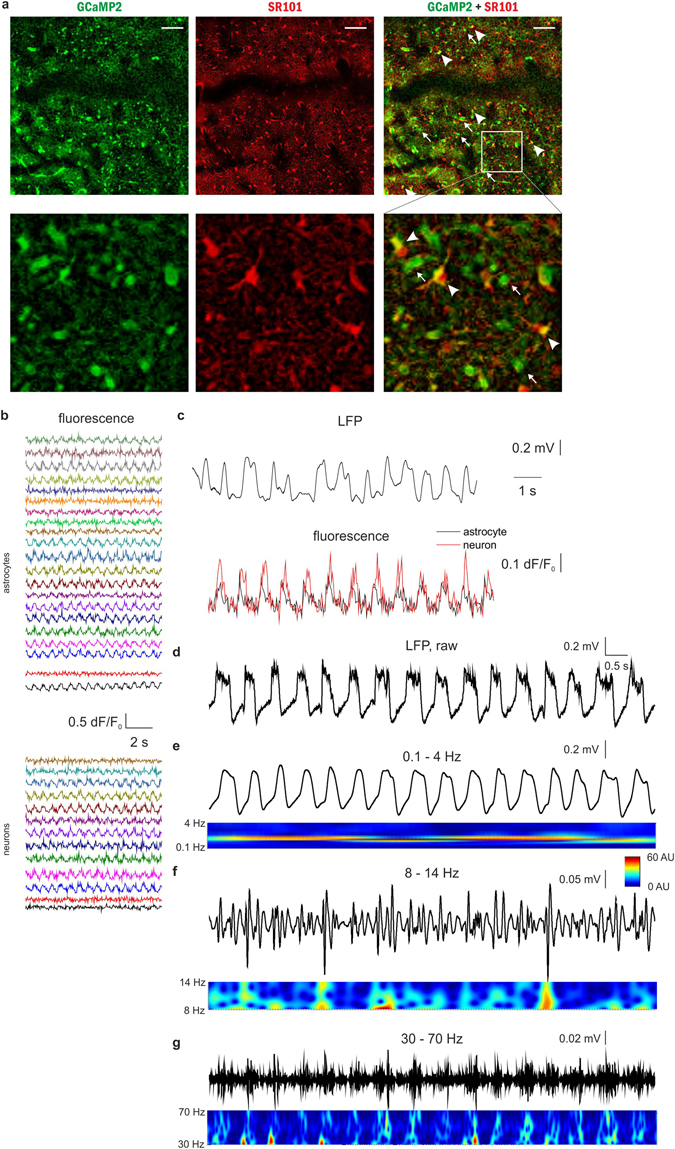
Figure 3
Both astrocytes and neurons are active during UP states in vivo in the rat primary visual cortex V1. ( A ) Top: Expression of GCaMP2 (green), labeling of astrocytes with SR101 (red). Both neurons (som...
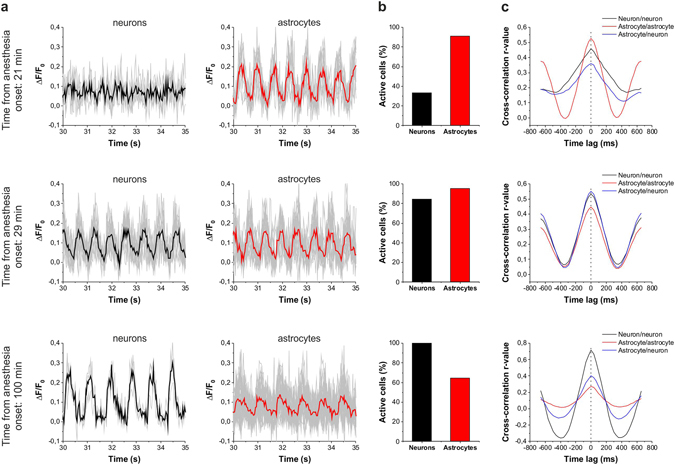
Figure 4
Astrocytes are more broadly involved in SWA than neurons in the early stage of ketamine/xylazine anesthesia. ( Au2013C ) Changes in the involvement of neurons and astrocytes in the network activity du...
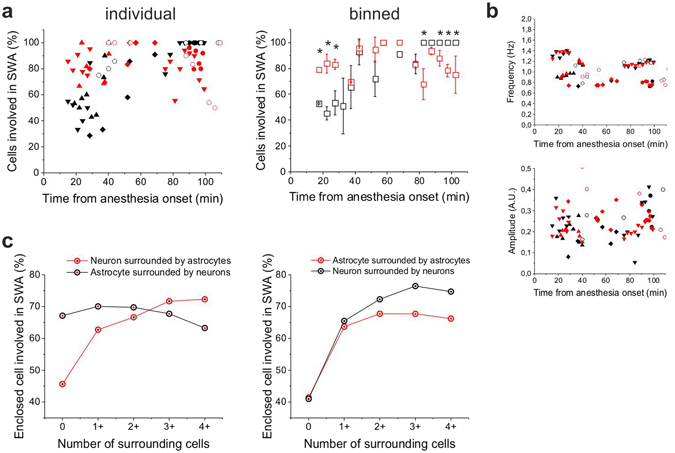
Figure 5
Extensive synchronized astrocytic activity contributes to the emergent neuronal synchronization in the early stage of ketamine/xylazine anesthesia. ( A ) The ratio of astrocytes (red) and neurons (bla...
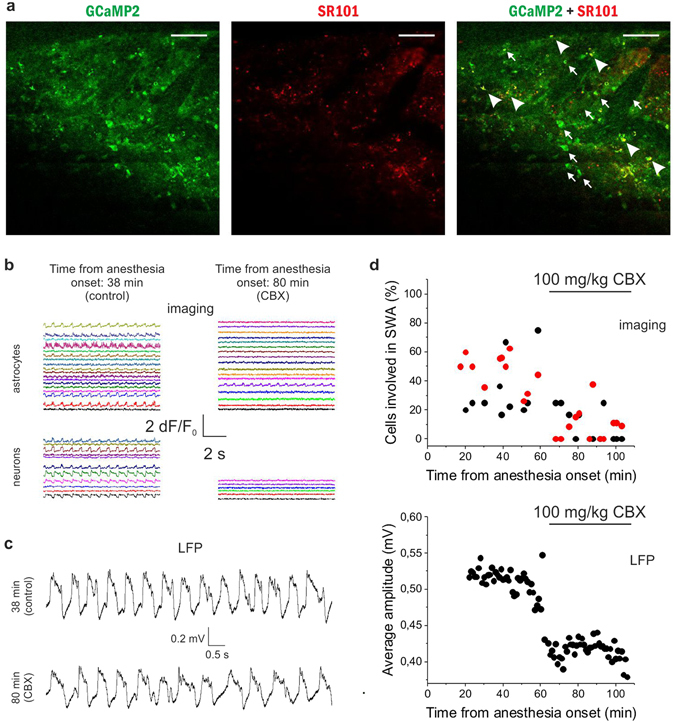
Figure 6
The gap junction blocker carbenoxolone (CBX) reduces the number of astrocytes and neurons taking part in the slow wave-associated network activity. ( A ) Expression of GCaMP2 (green), labeling of astr...
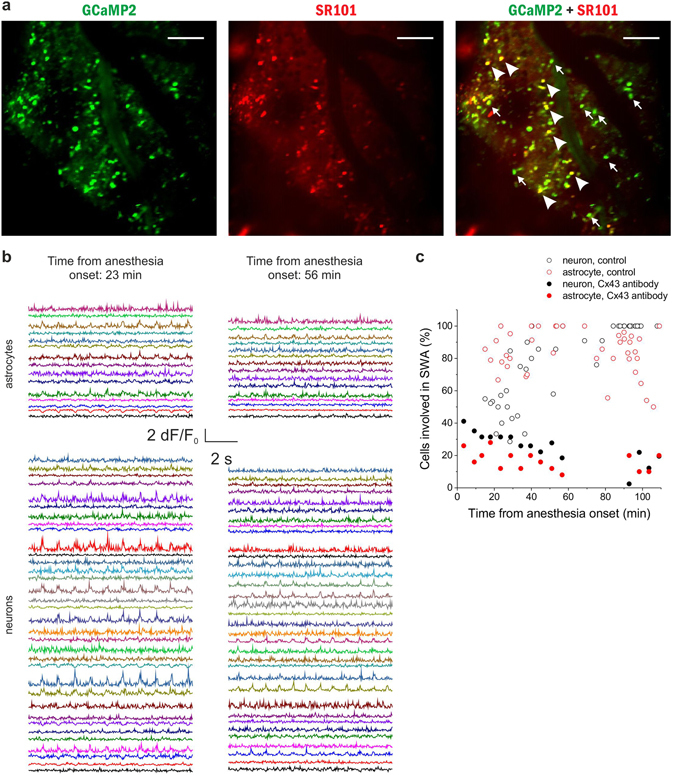
Figure 7
Specific blockade of the astrocytic gap junction subtype Cx43 inhibits synchronization in both astrocytes and neurons in vivo . ( A ) Expression of GCaMP2 (green), labeling of astrocytes with SR101 (r...
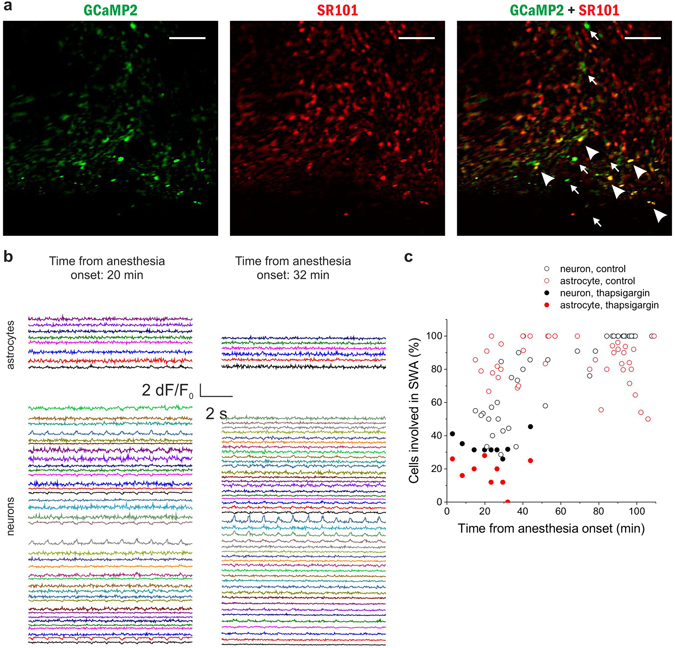
Figure 8
Specific reduction of the astrocytic Ca 2+ transients by thapsigargin inhibits synchronization in both astrocytes and neurons in vivo . ( A ) Expression of GCaMP2 (green), labeling of astrocytes with ...
Figure images are served from the NIH/NLM PubMed Central Open Access Subset or Europe PMC; copyright remains with the publishers and authors.
💬 Discussion
0 commentsNo comments yet. Be the first to start a discussion!
Leave a Comment