Abstract
The extracellular matrix (ECM) has been demonstrated to facilitate angiogenesis. In particular, fibronectin has been documented to activate endothelial cells, resulting in their transition from a quiescent state to an active state in which the cells exhibit enhanced migration and proliferation. The goal of this study is to examine the role of polymerized fibronectin during vascular tubulogenesis using a 3 dimensional (3D) cell-derived de-cellularized matrix. A fibronectin-rich 3D de-cellularized ECM was used as a scaffold to study vascular morphogenesis of endothelial cells (ECs). Confocal analyses of several matrix proteins reveal high intra- and extra-cellular deposition of fibronectin in formed vascular structures. Using a small peptide inhibitor of fibronectin polymerization, we demonstrate that inhibition of fibronectin fibrillogenesis in ECs cultured atop de-cellularized ECM resulted in decreased vascular morphogenesis. Further, immunofluorescence and ultrastructural analyses reveal decreased expression of stromal matrix proteins in the absence of polymerized fibronectin with high co-localization of matrix proteins found in association with polymerized fibronectin. Evaluating vascular kinetics, live cell imaging showed that migration, migration velocity, and mean square displacement, are disrupted in structures grown in the absence of polymerized fibronectin. Additionally, vascular organization failed to occur in the absence of a polymerized fibronectin matrix. Consistent with these observations, we tested vascular morphogenesis following the disruption of EC adhesion to polymerized fibronectin, demonstrating that block of integrins α5β1 and αvβ3, abrogated vascular morphogenesis. Overall, fibronectin deposition in a 3D cell-derived de-cellularized ECM appears to be imperative for matrix assembly and vascular morphogenesis.
🔬 Techniques
🔭 Microscopes
🧬 Organisms
💻 Software
✨ Fluorophores
🧪 Sample Preparation
🔬 Cell Lines
🏭 Microscope Brands
🧪 Reagent Suppliers
💻 Software Details
🏛️ Research Organizations (ROR)
Affiliated research institutions:
📋 Methods
Cell Lines and Culture The MDA231
(MDA) breast cancer cell line was a gift from the Physical Sciences-Oncology Bioresource Core Facility (PBCF, ATCC; Manassas, VA) and were originally obtained through the laboratory of Dr. Thea Tlsty (University of California San Francisco, San Francisco, CA). The human neonatal foreskin fibroblast (NuFF) cell line was obtained from Global Stem (Rockville, MD; #GSC-3002) at passage 9.
Human Umbilical Vein Endothelial Cells
(HUVECs) were obtained from Promocell (Heidelberg, Germany). MDA231 cells were cultured in DMEM (Life Technologies, Grand Island, NY) supplemented with 10% vol/vol FBS (Atlanta Biologicals). NuFF cell were cultured in DMEM supplemented with 10% vol/vol heat inactivated FBS (Life Technologies) and HUVECs were cultured in EGM media (Promocell) supplemented with 2% FBS (Promocell). Media was exchanged every 2–3 days and cells were passaged after reaching 80–90% confluency using 0.25% trypsin EDTA (Sigma, Allentown, PA) or 0.05% typsin EDTA (for HUVECs) (Sigma). All cell lines were maintained at 37°C in a humidified atmosphere containing 5% CO 2 .
Antibodies
Primary antibodies include: rabbit anti-human fibronectin, mouse anti-human collagen I, mouse anti-human collagen IV, rabbit anti-human laminin, mouse anti-human tenasin-C, mouse anti-human CD31 and phalloidin 488 or 546. Secondary antibodies include: goat anti-mouse Cy3, goat anti-mouse FITC and goat anti-rabbit alexa fluor 488. Refer to S1 Table for information on all antibodies including dilutions and suppliers. Blocking antibodies utilized in the study include: β 1 (clone Mab13, BD Biosciences; San Jose, CA), α 5 (clone IIa1, BD Biosciences), and α v β 3 (Clone LM609, Millipore, Billerica, MA). IgG isotype control antibodies were mouse IgG1 κ (clone MOPC-21, BD Biosciences) and rat IgG2a κ (Clone R35-95, BD Biosciences). Peptides The fibronectin inhibitor peptide pUR4B and control III-11C peptide (kindly provided by Dr. Jane Sottile, Rochester University) were obtained from cloning into Escherichia Coli and isolated as previously described [ 9 ]. Endotoxin was removed from peptides and residual levels measured as previously described [ 9 ].
Show full methods section
Cell Lines and Culture The MDA231
(MDA) breast cancer cell line was a gift from the Physical Sciences-Oncology Bioresource Core Facility (PBCF, ATCC; Manassas, VA) and were originally obtained through the laboratory of Dr. Thea Tlsty (University of California San Francisco, San Francisco, CA). The human neonatal foreskin fibroblast (NuFF) cell line was obtained from Global Stem (Rockville, MD; #GSC-3002) at passage 9.
Human Umbilical Vein Endothelial Cells
(HUVECs) were obtained from Promocell (Heidelberg, Germany). MDA231 cells were cultured in DMEM (Life Technologies, Grand Island, NY) supplemented with 10% vol/vol FBS (Atlanta Biologicals). NuFF cell were cultured in DMEM supplemented with 10% vol/vol heat inactivated FBS (Life Technologies) and HUVECs were cultured in EGM media (Promocell) supplemented with 2% FBS (Promocell). Media was exchanged every 2–3 days and cells were passaged after reaching 80–90% confluency using 0.25% trypsin EDTA (Sigma, Allentown, PA) or 0.05% typsin EDTA (for HUVECs) (Sigma). All cell lines were maintained at 37°C in a humidified atmosphere containing 5% CO 2 .
Antibodies
Primary antibodies include: rabbit anti-human fibronectin, mouse anti-human collagen I, mouse anti-human collagen IV, rabbit anti-human laminin, mouse anti-human tenasin-C, mouse anti-human CD31 and phalloidin 488 or 546. Secondary antibodies include: goat anti-mouse Cy3, goat anti-mouse FITC and goat anti-rabbit alexa fluor 488. Refer to S1 Table for information on all antibodies including dilutions and suppliers. Blocking antibodies utilized in the study include: β 1 (clone Mab13, BD Biosciences; San Jose, CA), α 5 (clone IIa1, BD Biosciences), and α v β 3 (Clone LM609, Millipore, Billerica, MA). IgG isotype control antibodies were mouse IgG1 κ (clone MOPC-21, BD Biosciences) and rat IgG2a κ (Clone R35-95, BD Biosciences). Peptides The fibronectin inhibitor peptide pUR4B and control III-11C peptide (kindly provided by Dr. Jane Sottile, Rochester University) were obtained from cloning into Escherichia Coli and isolated as previously described [ 9 ]. Endotoxin was removed from peptides and residual levels measured as previously described [ 9 ].
GFP transduction
A lentiviral vector was used for GFP transduction of ECs. Plasmids pMD2.G, CMV 11904, and iDUET 11426 were kindly provided by Dr. Linzhao Cheng (Johns Hopkins University). Methods used for transformation and transfection were based off of methods described by [ 15 ]. In brief, 10pg to 100ng of plasmids were transformed into OneShot Stlb3 cells (Life Technologies) according to the manufacturer’s instructions. A volume of 25μl of the transformed cells was plated on LB agar plates containing 100μg/ml of ampicillin and allowed to grow overnight at 37°C. The next day, colonies were selected and grown overnight in 5ml of LB medium containing 100μg/ml of ampicillin in a shaker incubator set at 37°C. The Qiagen Spin Miniprep Kit was used to isolate bacterial DNA (Qiagen, Germantown, MD). For transfection, Hek293t3 cells (ATCC, Manassas, VA) were plated at 500,000 cells in a 6 well and allowed to attach overnight. The next day, the media was exchanged to 1% serum and HEK293 cells were transfected with the following concentrations of plasmids: 2μg of CMV, 0.5μg of PMD.G, and 1μg of iDUET in lipofectamine (Life Technologies). Methods were based off of manufacturer’s instructions. After two days of transfection, the supernatant was collected and the virus concentrated using an Amicon Ultracentrifugal filter (Millipore) and subsequently stored at -80°C. For transduction, HUVECs (at passage 1) were plated in a 6-well plate at 100,000 cells/well. The virus was added at a ratio of 1:100 (vol/vol) virus to HUVEC medium and incubated at 37°C, 5% CO 2 in a humidified atmosphere for 24 hours. The media was changed after the 24-hour viral incubation. The cells were gently scraped from the wells, spun down at 800 rpm for 3 minutes, and suspended in 300μl of 1X PBS. This suspension was filtered using a 40-um mesh strainer (BD Biosciences) and transferred in 5 ml FACs tubes for sorting. HUVECs expressing a high level of GFP were sorted and isolated using FACS Aria II Sorter with a 488nm laser at the Ross Research Flow Cytometry Core Facility (Johns Hopkins University School of Medicine, Baltimore, MD). Co-cultures NuFF (passages 18–28) were co-cultured with MDA breast cancer cells for establishment of cell-derived ECM. Both cell lines were seeded on the same day in a 1:1 ratio in 4 well Nunc LabTek II Chamberslides (Sigma) using methods previously described [ 11 , 14 ]. In brief, co-cultures were maintained in one-half NuFF media and one-half MDA media with a final concentration of 10% fetal bovine serum (FBS). In some instances, chamberslides were coated with 5ug/well human fibronectin (Sigma) for 1 hour at 37°C, 5% CO 2 in a humidified atmosphere prior to cell seeding. Media was exchanged every 2–3 days and co-cultures were maintained for 7–9 days before de-cellularization. Matrix de-cellularization and seeding of HUVECs Isolation of cell-derived ECM and subsequent seeding of HUVECs for vascular morphogenesis were based off of methods described in prior published reports [ 11 , 14 ]. HUVECs were used at passages 4–5 for all analyses of vascular morphogenesis on de-cellularized ECM and were cultured in EGM media containing 2% serum. Inhibition of fibronectin polymerization NuFF/MDA co-cultures were incubated in 250nM of pUR4B or control III-11C peptides. Fresh inhibitor and control peptides were added every day along the culture period. For analysis of the contribution of HUVEC-derived fibronectin to vascular morphogenesis, HUVECs were seeded on intact, de-cellularized ECM in the presence of 500nM of pUR4B or control III-11C peptides. NuFF/MDA co-cultures and vascular structures on de-cellularized ECM were evaluated for fibronectin expression using qRT-PCR and western blot as described below.
Inhibition of collagen synthesis
NuFF cells were seeded at 45,000 cells/well in Nunc LabTek II Chamberslides and were incubated in media with or without 100nM of halofuginone (Sigma) for 24 hours. Serum concentrations were adjusted to 2.5% serum or 5% serum. Cells were fixed and evaluated using immunofluorescence (described below) for collagen I, fibronectin and tenascin-C matrix expression. Immunofluorescence staining and imaging of ECM and vascular structures De-cellularized NuFF/MDA ECM and vascular structures were fixed and prepared as previously described [ 11 , 14 ]. The de-cellularized ECM was stained with fibronectin and collagen I or IV, laminin or tenasin-C. Vascular structures were stained with either CD31, phalloidin or one of each of the ECM proteins: fibronectin, collagens I or IV, laminin or tenasin-C. ECM and vascular structures were incubated in secondary antibodies Refer to S1 Table for information on all antibodies used including dilutions and suppliers. Cellular nuclei were visualized using DAPI at a dilution of 1:1,000 (Life Technologies). All immunolabeled samples were mounted and imaged as previously described [ 11 , 14 ].
Confocal and time-lapse imaging
Live cell time-lapse images were taken from hour 7 to hour 12 following GFP-HUVEC seeding on ECM using a Zeiss LSM 510 Meta Confocor 3 (Carl Zeiss; Integrated Imaging Center; Johns Hopkins University). Fluorescent z-stack images of step size 2–3 μM were taken with a 20x objective (Zeiss) every 15 minutes for 5 hours. An argon (488nm) laser was used to obtain the fluorescent images. Multi-Time 4.0.31 (Zeiss) was used to set up the time-lapse and Zen (Zeiss) was used to set up the image configurations. During time-lapse imaging, the cells were cultured and incubated using previously mentioned conditions. Fixed, immunolabeled vascular structures were evaluated for the presence of lumens and evidence of vascular organization. A step size of 0.70μM was used and images were acquired at 40 and 63x magnification.
Scanning electron microscopy
Scanning electron microscopy was performed as previously described [ 11 , 14 ]. Three coverslips each containing de-cellularized ECM deposited from pUR4B and control III-11C treated NuFF/MDA co-cultures were evaluated for the extent of ECM expression. Real-time quantitative RT-PCR Two-step RT-PCR was performed on cDNA from NuFF/MDA co-cultures or vascular structures from HUVECs grown for 24 hours on de-cellularized NuFF/MDA ECM. NuFF/MDA co-cultures were treated daily with 250nM of pUR4B or control III-11C or were left untreated for a period of 9 days. HUVECs were treated with 500nM of pUR4B or control III-11C for a period of 24 hours or were left untreated. Total RNA was extracted, quantified, and reverse transcribed into cDNA as previously described [ 11 , 14 ]. The TaqMan Universal PCR Master Mix and Gene Expression Assay (Applied Biosystems, Foster City, CA) were used for analyses of fibronectin and the following matrix metalloproteases (MMPs): MMP1, MMP2, MMP9 and MT1-MMP (Applied Biosystems) according to the manufacturer’s instructions. The TaqMan PCR step was performed with an Applied Biosystems StepOne Real-Time PCR System (Applied Biosystems), following the manufacturer’s instructions. The relative expression of fibronectin and MMPs was normalized to the amount of β-actin or GAPDH (Applied Biosystems) in the same cDNA through use of the standard curve method described by the manufacturer. For each primer set, the comparative computerized tomography method (Applied Biosystems) was used to calculate amplification differences between untreated, control III-11C and pUR4B treated samples. The values for experiments were averaged and graphed with standard deviations. Enzyme Zymography HUVECs at passage 5 were grown on de-cellularized ECM from NuFF/MDA co-cultures. After 12 hours in EGM media supplemented with 2% serum, the media was exchanged to serum free EGM media for the remaining 12 hours of vascular assembly. Supernatant was collected, stored long term at -80°C and thawed on ice during experimental analyses. The supernatant was diluted 1:1 with Laemmli buffer without addition of reducing agents. A volume of 40μl was loaded on a 12% casein gel (Life Technologies) for MMP1 or a 10% gelatin gel (Life Technologies) for MMPs 2 and 9. The gels were run at 150V for 1.5 hours in SDS running buffer, followed by a series of four 15 minute washes in 1X Renaturation buffer (Life Technologies). The gels were transferred to 1X Denaturation Buffer (Life Technologies) for 15 minutes with gentle shaking and then placed at 37°C for incubation overnight. The following day, the gels were fixed in a solution containing 50% methanol and 10% acetic acid for 30 minutes and stained in 0.02% Coomassie (Sigma) in 50% methanol and 10% acetic acid for 2 hours. The gels were de-stained in 20% methanol, 10% acetic acid solution for 1–2 hours and transferred to deionized H 2 O and imaged using ChemiDoc TM XRS+ System (Biorad, Hercules, CA). Images were acquired using Biorad Quantity One TM software. Differences between MMPs 2 and 9 on gelatin zymograms were distinguished based on known molecular weights where ~90 kDa corresponds to proMMP9 and ~72 kDa and ~62 kDa correspond to the pro and active forms, respectively, for MMP2 [ 16 , 17 ].
Western Blot
NuFF/MDA co-cultures or vascular structures from HUVECs grown on de-cellularized co-culture ECM were utilized for western blot analyses. NuFF/MDA co-cultures were treated daily with 250nM of pUR4B or control III-11C or were left untreated for a period of 9 days. HUVECs were treated with 500nM of pUR4B or control III-11C or were left untreated for a period of 24 hours. Cells were lysed and protein was quantified as previously described [ 11 , 14 ]. A concentration of 20–30μg of protein was loaded per well into a 4–20% SDS PAGE gel (BioRad) and run under reducing conditions. Proteins were transferred to nitrocellulose membranes (Biorad), blocked for 1 hour in 3% non-fat milk (Biorad), and incubated overnight at 4°C/constant shaking with the following antibodies: anti-MT1-MMP, anti-fibronectin and GAPDH. Membranes were washed, incubated in secondary antibodies and imaged as previously described [ 11 , 14 ]. Refer to S1 Table for dilutions and suppliers for all antibodies. Cell proliferation NuFF/MDA co-cultures were treated with 250nM of pUR4B or control III-11C or were left untreated for 48 hours. After 48 hours, cell proliferation was assessed using the XTT assay (Sigma) according to the manufacture’s specifications. ECM co-localization with fibronectin The percent ECM co-localized with fibronectin was analyzed from 40x magnification images acquired from an Olympus BX60 microscope. Images of ECM co-localization were taken from 3–4 non-overlapping images from a total of 2–3 wells. The percent overlap for each ECM protein with fibronectin was obtained using the Co-localization tool in Metamorph version 6.1 (Universal Imaging Co., Downingtown, PA), a plugin which provides quantitative information regarding the overlap of two fluorescent signals in an image pair. To analyze co-localization, the images were thresholded so the positively stained regions were highlighted. Thresholded images were compared to the original image to ensure accuracy of thresholding. The area of overlap in the entire image pair was then analyzed. The percentage of overlap in one image versus the other (e.g. collagen overlap with fibronectin) was recorded and expressed as the percent co-localization. Blocking integrins α 5 β 1 and α v β 3 on HUVECs To inhibit vascular cell interaction with fibronectin, HUVECs were seeded in the presence of 20μg/ml each of the following blocking integrins: α 5 , β 1 , and α v β 3 [ 18 ]. To address the contribution of α v β 3 to vascular cell interaction with fibronectin, HUVECs were seeded with 20 μg/ml of α v β 3 with and without 20 μg/ml each of α 5 and β 1 [ 18 ]. IgG isotype control antibodies were utilized at 20μg/ml. Vascular structures were maintained for 24 hours in culture, prior to fixation and staining as described above.
Vascular quantification
Vascular structures were quantified from non-overlapping high magnification phalloidin stained images using the threshold function in ImageJ. Using this tool, images were first converted to a 16 bit gray scale image, were automatically threshoIded, and analyzed for the percent area covered by capillary-like structures (CLS) [ 14 ]. To illustrate the differences in pixel intensities of luminal CLS as opposed to planar sheets of ECs, we have calculated the average pixel intensities of regions with and without CLS. This analysis was conducted on 3 non-overlapping regions in each of 11 to 12 images from control III-11C and pUR4B treated ECs, respectively. To confirm that the brighter structures were indeed CLS, we used confocal imaging to generate z stacks. Analyzing z stacks of at least 15 confocal images, we documented the presence of lumens in these brighter structures and the lack of lumens in the dimmer sheets of planar ECs. This approach proved to be sufficient to determine the presence of luminal CLS and served for the purpose of this study [ 11 , 14 ]. For studies on the effect of Fn inhibition during vascular morphogenesis, eight to twelve non-overlapping images were taken from each well in two wells in a total of three slides. For studies on the effect of anti-integrins on vascular morphogenesis, 9–12 non-overlapping images from each condition were evaluated.
Particle tracking
GFP-HUVEC cell migration was tracked using the Manual Tracking plugin (Fabrice P. Cordières, Institut Curie, France) in ImageJ (NIH). The x/y calibration was set to 0.877 μm/pixel. The center of the cell was used as a reference point for each cell in each frame. Cells that entered or exited the field of view during the 5-hour tracking time interval were excluded. Cells that underwent apoptosis or proliferation were also disregarded during the tracking process. Between 60 and 100 cells were tracked per condition per experiment. Each experiment was repeated three times and each condition was in duplicate. The time interval was 15 minutes for a total of 5 hours.
Cell migration parameters
The cell migration parameters were calculated using a custom Matlab (The Mathworks, Natick, MA) code. The XY coordinates and the distance of each particle per frame retrieved by Manual Tracking were imported into Matlab. The migration parameters calculated were total distance traveled (of 5 hours), velocity between each frame, average velocity (of 5 hours), total displacement (of 5 hours), and mean square displacement. The total distance traveled per cell was calculated by summing the interval distances, D t o t a l = ∑ i = 1 N D i where D total represents the total distance traveled, N is the number of distances, i represents each individual frame, and D i is the distance traveled for each frame. The velocity was calculated by dividing the interval distances by the interval time of 15 minutes, V i = D i △ t where V i is the interval velocity, and Δt represents the time interval (15 minutes). The following equation was used to calculate the average velocity, V a v g = 1 N ∑ i = 1 N V i where V avg represents the average velocity and N represents the number of total velocities. The total displacement was calculated using the following equation, d n e t = ( x f − x i ) 2 + ( y f − y i ) 2 where d net represents the net displacement of a cell, x f is the final x position, x i is the initial x position, y f is the final y position, and y i is the initial y position. Mean square displacement is a parameter often used to characterize the motility of cells along with the previously mentioned parameters. It was calculated using the following equation, M S D = 〈 [ r ( t + τ ) − r ( t ) ] 2 〉 where MSD presents the mean square displacement, r(t) is the position of the particle at time t, τ is the lag time between the two positions.
Statistical Analyses
Statistical analysis was performed using GraphPad Prism 4.02 (GraphPad Software Inc., La Jolla, CA). GraphPad Prism 4.02 was used to perform ttests, One Way ANOVA with Turkey’s posttest, and Two Way ANOVA with Bonferroni’s posttest. Significance levels were set at *p≤0.05, **p≤0.01, and ***p≤0.001. Unless otherwise indicated, all graphical data are reported ±SD.
Supporting Information S1 Fig Vascular structures grown atop de-cellularized matrix express several ECM proteins. Low magnification immunofluorescence images of vascular structures depict the overall presentation of ECM proteins collagens I and IV, tenascin-C and fibronectin following vascular morphogenesis of ECs on de-cellularized co-culture ECM. (TIF) Click here for additional data file. S2 Fig Fibronectin inhibition does not significantly affect fibronectin gene and protein expression in ECs following vascular morphogenesis. (A) Baseline fibronectin expression in co-culture and EC media. Results show fibronectin expression in the absence of cell produced fibronectin. (B) qRT-PCR and (C) western blot of fibronectin expression in ECs treated with pUR4B and control III-11C peptides at the time of seeding on de-cellularized co-culture ECM. *p≤0.05; **p≤0.01; ***p≤0.001. (D) Images of phalloidin-stained vascular structures before and after threshold using ImageJ. Thresholded images were used for analysis of the percent area occupied by CLS. Arrows indicate the presence of CLS in non-thresholded images. (TIF) Click here for additional data file. S3 Fig CLS analyses using the angiogenesis tool in Metamorph. Images of CLS were generated using the angiogenesis tool in Metamorph. Images are from pUR4B (inhibitor) and control III-11C treated ECs cultured for 24 hours atop de-cellularized ECM matrices. The white regions are indicative of vascular structures while the green regions are indicative of nodes or vascular junctions. These nodes occupy a majority of the highlighted regions in both images. For comparison, the same images are shown before ( top panel ) and after thresholding ( bottom panel ), which was used to identify structures based on differences in pixel intensity. (TIF) Click here for additional data file. S4 Fig Fibronectin inhibition reduces the intensity of fibronectin expression in vascular structures.
Confocal images of vascular structures treated with pUR4B and control
III-11C peptides at the time of seeding on de-cellularized ECM. Images for pUR4B and control III-11C illustrate fibronectin expression in the first and last 3 sets of z stacks for vascular structures. Image 1 corresponds to the top of the well while image 6 corresponds to the bottom of the well. The intensity of fibronectin expression was greatest for vascular structures treated with control III-11C and lowest for vascular structures treated with the pUR4B inhibitor. Images were obtained using the same microscope settings. (TIF) Click here for additional data file. S5 Fig Fibronectin inhibition eliminates fibronectin fibrillogenesis in the co-culture matrix but does not alter fibronectin gene or protein expression. (A) Representative phase contrast images of pUR4B treated and untreated NuFF/MDA231 co-cultures prior to de-cellularization. (B) Representative immunofluorescence images of fibronectin in de-cellularized ECM from untreated, control III-11C treated and pUR4B treated co-cultures. (C) qRT-PCR and (D) western blot of fibronectin expression in control III-11C treated and pUR4B treated co-cultures. (E) Analysis of cell proliferation in untreated, control III-11C treated and pUR4B treated co-cultures. *p≤0.05; **p≤0.01; ***p≤0.001. (TIF) Click here for additional data file. S6 Fig Inhibition of collagen I deposition does not alter fibronectin fibril formation in co-cultures. (A) Representative immunofluorescence images of NuFF cells treated with 100nM of halofuginone for 24 hours. Collagen I fibrils are observed with fibronectin fibrils in control NuFF cells, but are absent in halofuginone treated NuFF despite the presence of extracellular fibronectin fibrils. (B) Immunofluorescence images of control NuFF cells illustrate the absence of tenascin-C where fibronectin fibrils are observed. HF: Halofuginone. (TIF) Click here for additional data file. S7 Fig Final trajectories of GFP+ ECs seeded on the various treatment conditions. (A) ECs were transduced with lentiviral GFP and were sorted into GFP+ and GFP- subpopulations. Corresponding phase contract and fluorescence images were taken of both populations. These images depict the high fluorescence observed for the GFP+ subpopulation and the lack of fluorescence observed for the GFP+ subpopulation. Scale bars = 100μM. (B) The migration of the GFP+ ECs was monitored by tracking their positions every 15 minutes for a total of 5 hours. These images show the cells’ trajectories after the 5-hour time period. The top panel depicts trajectories with cells and the bottom panel depicts trajectories without the cells. The ECs are in grey scale while different colored lines represent the trajectories of random selected cells. The 5-hour trajectories were used to determine the total distance traveled by the ECs on each of the scaffolds. (TIF) Click here for additional data file. S8 Fig Inhibition of fibronectin fibrillogenesis in the de-cellularized matrix prevents vascular organization. Confocal images were taken of GFP+ EC organization following growth on Chambers, III-11C-ECM and pUR4B-ECM. All images were acquired 12 hours post-seeding. Differences in vascular organization were evident from each of the tested conditions. ECs on Chambers and pUR4B-ECM have a sheet-like morphology with no evidence of nuclear alignment. ECs on III-11C-ECM exhibit vascular organization, evident by the presence of nuclear alignment into branched-like structures. These organized structures are indicated with white arrows. Scale bars = 100μM. (TIF) Click here for additional data file.
S1 Table
List of antibodies and dilutions used in study. (DOCX) Click here for additional data file.
📊 Figures
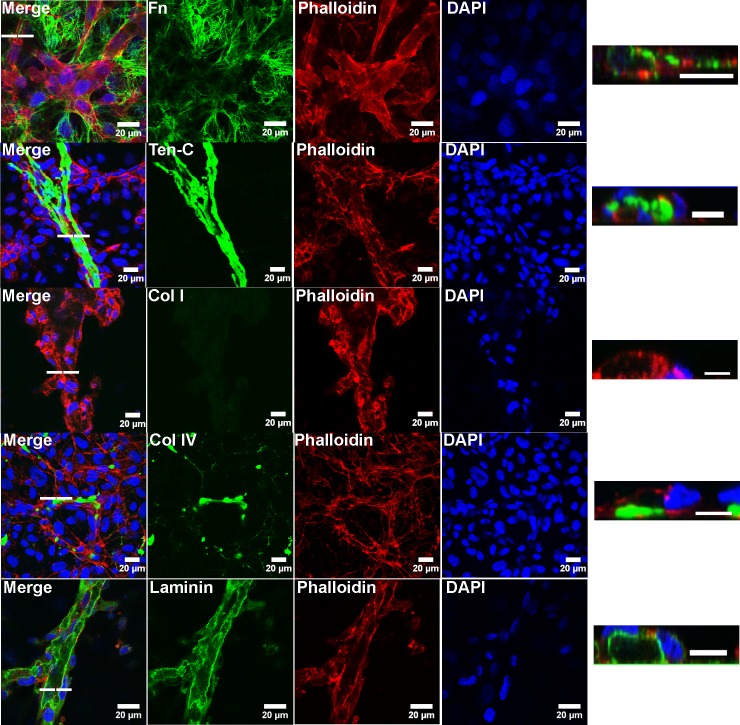
Fig 1
Vascular structures on de-cellularized matrix express high fibronectin.
Confocal images of vascular structures illustrate the localization of ECM proteins following vascular morphogenesis of ECs cultured atop de-cellularized co-culture ECM. Images of vascular lumens, indi...
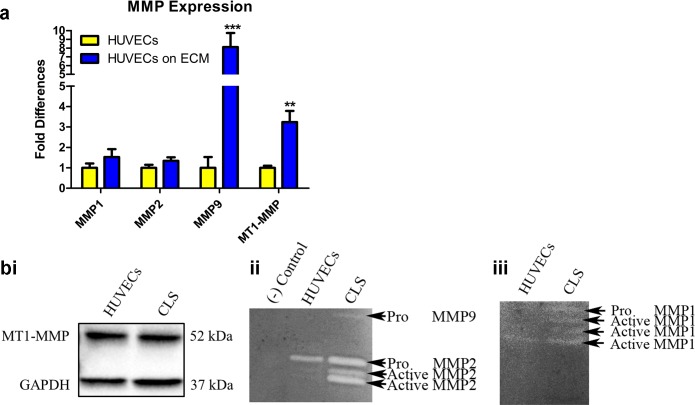
Fig 2
Vascular structures on de-cellularized matrix express active MMPs.
(A) qRT-PCR illustrated up-regulated expression of MMPs in CLS (ECs on ECM) as compared to ECs cultured on tissue culture plastic. Significance was assessed based on the following p values: *pu22640.0...
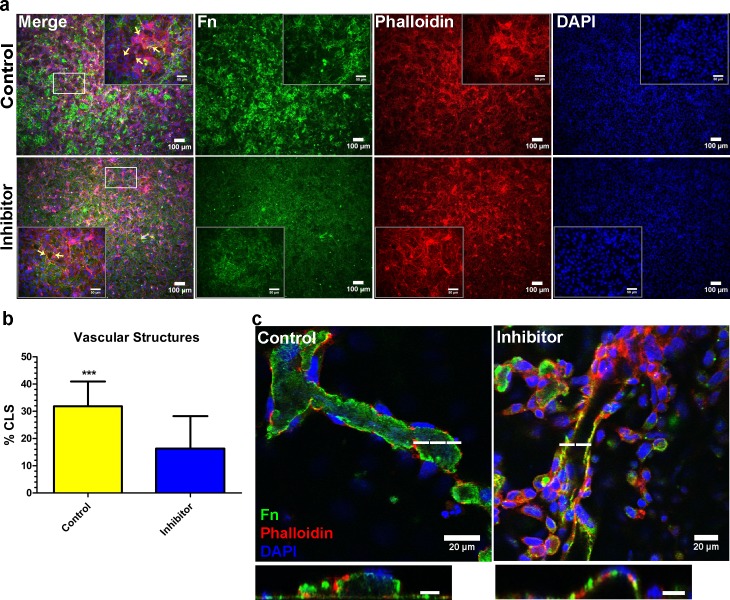
Fig 3
Fibronectin inhibition during vascular morphogenesis reduces CLS formation.
(A) Representative immunofluorescence images of vascular structures treated with 500u03bcM pUR4B or control, III-11C peptides at the time of EC seeding on ECM. Corresponding high magnification images ...
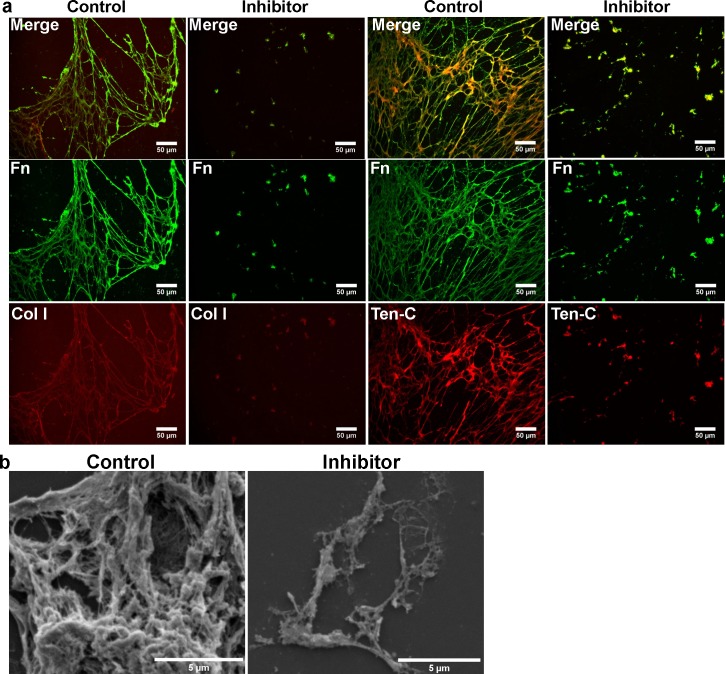
Fig 4
Fibronectin inhibition reduces the deposition of matrix proteins from co-cultures.
(A) Representative immunofluorescence images of de-cellularized matrix from pUR4B and control III-11C treated co-cultures reveal the absence of collagen I and tenascin-C in co-culture ECM lacking a po...
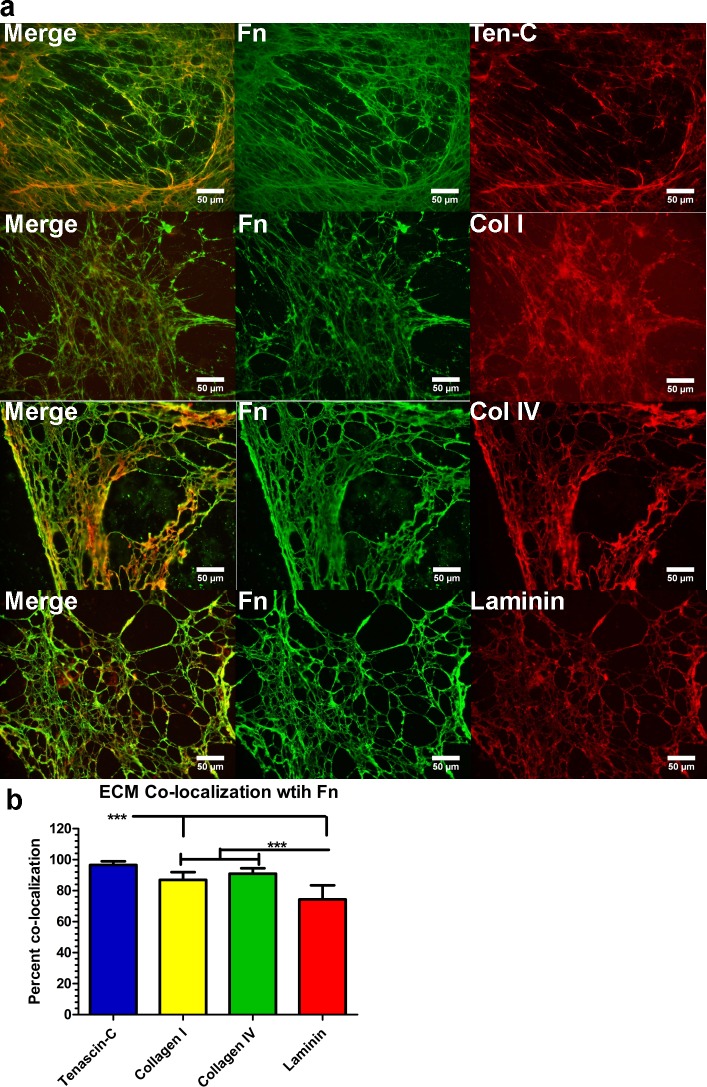
Fig 5
Matrix proteins are highly co-localized with a polymerized fibronectin matrix.
(A) Representative immunofluorescence images of matrix proteins co-localized with the polymerized fibronectin matrix show co-localization of collagens I and IV, laminin and tenascin-C with fibronectin...
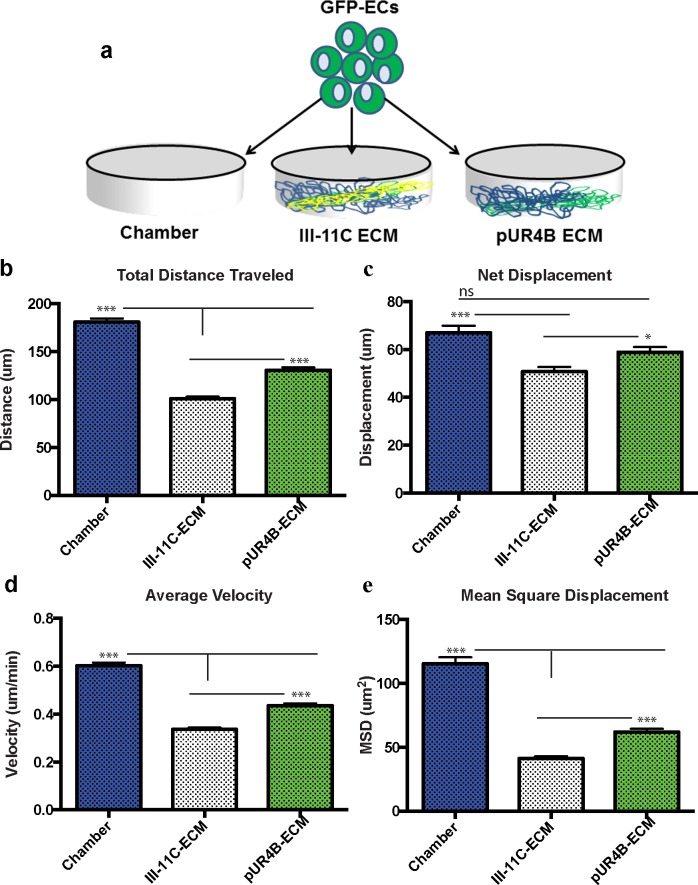
Fig 6
Vascular kinetics is altered following culture of GFP+ ECs atop pUR4B or III-11C ECM.
(A) GFP+ ECs were seeded on Chambers, III-11C-ECM and pUR4B-ECM and were assessed for differences in vascular kinetics between hours 7 and 12 post-seeding. Graphs depict (B) total distance traveled, (...
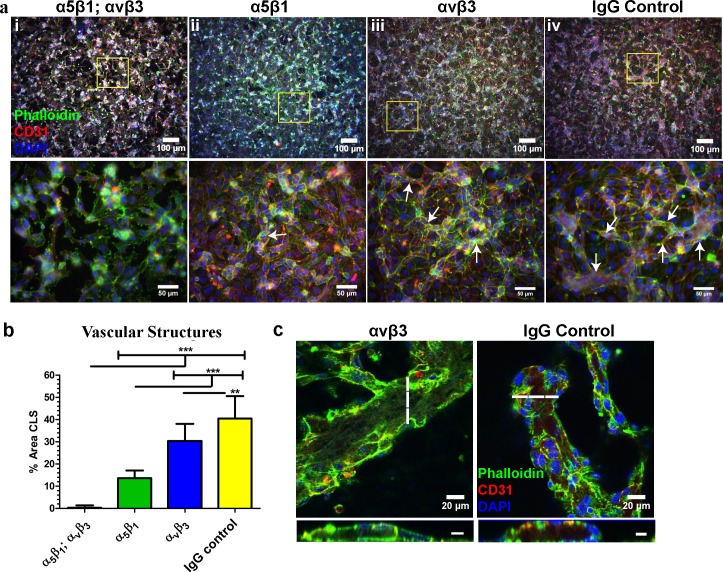
Fig 7
Inhibition of vascular integrin adhesion to a polymerized fibronectin matrix disrupts CLS formation.
(A) Representative immunofluorescence images of vascular structures treated with blocking antibodies to the fibronectin integrins u03b1 5 u03b2 1; u03b1 v u03b2 3, u03b1 5 u03b2 1 , and u03b1 v u03b2 ...
Figure images are served from the NIH/NLM PubMed Central Open Access Subset or Europe PMC; copyright remains with the publishers and authors.
💬 Discussion
0 commentsNo comments yet. Be the first to start a discussion!
Leave a Comment