Abstract
BACKGROUND: Aggregation and cytotoxicity of mutant proteins containing an expanded number of polyglutamine (polyQ) repeats is a hallmark of several diseases, including Huntington's disease (HD). Within cells, mutant Huntingtin (mHtt) and other polyglutamine expansion mutant proteins exist as monomers, soluble oligomers, and insoluble inclusion bodies (IBs). Determining which of these forms constitute a toxic species has proven difficult. Recent studies support a role for IBs as a cellular coping mechanism to sequester levels of potentially toxic soluble monomeric and oligomeric species of mHtt. METHODOLOGY/PRINCIPAL FINDINGS: When fused to a fluorescent reporter (GFP) and expressed in cells, the soluble monomeric and oligomeric polyglutamine species are visually indistinguishable. Here, we describe two complementary biophysical fluorescence microscopy techniques to directly detect soluble polyglutamine oligomers (using Htt exon 1 or Htt(ex1)) and monitor their fates in live cells. Photobleaching analyses revealed a significant reduction in the mobilities of mHtt(ex1) variants consistent with their incorporation into soluble microcomplexes. Similarly, when fused to split-GFP constructs, both wildtype and mHtt(ex1) formed oligomers, as evidenced by the formation of a fluorescent reporter. Only the mHtt(ex1) split-GFP oligomers assembled into IBs. Both FRAP and split-GFP approaches confirmed the ability of mHtt(ex1) to bind and incorporate wildtype Htt into soluble oligomers. We exploited the irreversible binding of split-GFP fragments to forcibly increase levels of soluble oligomeric mHtt(ex1). A corresponding increase in the rate of IBs formation and the number formed was observed. Importantly, higher levels of soluble mHtt(ex1) oligomers significantly correlated with increased mutant cytotoxicity, independent of the presence of IBs. CONCLUSIONS/SIGNIFICANCE: Our study describes powerful and sensitive tools for investigating soluble oligomeric forms of expanded polyglutamine proteins, and their impact on cell viability. Moreover, these methods should be applicable for the detection of soluble oligomers of a wide variety of aggregation prone proteins.
🔬 Techniques
🔭 Microscopes
💻 Software
✨ Fluorophores
🧪 Sample Preparation
🔬 Cell Lines
🏭 Microscope Brands
🧪 Reagent Suppliers
📷 Detectors
💻 Software Details
🏛️ Research Organizations (ROR)
Affiliated research institutions:
📋 Methods
Methodology/Principal Findings When fused to a fluorescent reporter (GFP) and expressed in cells, the soluble monomeric and oligomeric polyglutamine species are visually indistinguishable. Here, we describe two complementary biophysical fluorescence microscopy techniques to directly detect soluble polyglutamine oligomers (using Htt exon 1 or Htt ex1 ) and monitor their fates in live cells. Photobleaching analyses revealed a significant reduction in the mobilities of mHtt ex1 variants consistent with their incorporation into soluble microcomplexes. Similarly, when fused to split-GFP constructs, both wildtype and mHtt ex1 formed oligomers, as evidenced by the formation of a fluorescent reporter. Only the mHtt ex1 split-GFP oligomers assembled into IBs. Both FRAP and split-GFP approaches confirmed the ability of mHtt ex1 to bind and incorporate wildtype Htt into soluble oligomers. We exploited the irreversible binding of split-GFP fragments to forcibly increase levels of soluble oligomeric mHtt ex1 . A corresponding increase in the rate of IBs formation and the number formed was observed. Importantly, higher levels of soluble mHtt ex1 oligomers significantly correlated with increased mutant cytotoxicity, independent of the presence of IBs.
Experimental design
Two different approaches were employed to quantitate global changes in the monomeric mHtt pool and detect soluble oligomers in live cells. To study changes in the total population of mHtt ex1 , we measured changes in protein mobility, and by extension molecular size, with Fluorescence Recovery after photobleaching (FRAP). For FRAP, GFP-tagged proteins are expressed in live cells and imaged with a scanning confocal microscope. A discrete region of interest (ROI) in a cell is irreversibly photobleached with high intensity laser light. Movement of unbleached fluorescent molecules into the ROI is quantitated over time and analyzed to determine the diffusion coefficient ( D ) of the fluorescent molecule [36] . D (µm 2 /s) is inversely proportional to environmental viscosity and the size of the molecule (hydrodynamic radius or R h ) or an associated molecular complex [37] . Previously, FRAP analysis revealed that polyQ proteins, when incorporated into IBs, exhibit exceptionally low mobility [38] . However, these results provide no indication of the mobility of the polyQ protein prior its incorporation into IBs. While FRAP can report changes in molecular size, it provides no information on the composition of molecular complexes. Decreased mobility of mHtt proteins could represent mHtt ex1 oligomers, assemblies with other cellular proteins, such as chaperones or a mixture of both [39] . To specifically detect Htt oligomers, we employed split-GFP technology, also termed bimolecular fluorescence complementation (BiFC). Two non-fluorescent fragments of green fluorescent protein (GFP) can associate to form a single fluorescent GFP, but only when they are fused to two proteins capable of interacting with each other [40] , [41] , [42] , [43] . Split-GFP is sufficiently sensitive to report weak or transient interactions even for small populations of interacting proteins that could be otherwise obscured in sensitized emission FRET experiments [41] . The irreversible nature of the split-GFP interaction also allows trapping of otherwise transient interactions [44] . Therefore, this feature can be used to enrich the pool of oligomeric Htt ex1 in living cells [45] . Using FRAP and split-GFP, we sought to detect changes in soluble Htt ex1 oligomer levels in live cells and correlate oligomer formation with mHtt ex1 toxicity.
Show full methods section
Methodology/Principal Findings When fused to a fluorescent reporter (GFP) and expressed in cells, the soluble monomeric and oligomeric polyglutamine species are visually indistinguishable. Here, we describe two complementary biophysical fluorescence microscopy techniques to directly detect soluble polyglutamine oligomers (using Htt exon 1 or Htt ex1 ) and monitor their fates in live cells. Photobleaching analyses revealed a significant reduction in the mobilities of mHtt ex1 variants consistent with their incorporation into soluble microcomplexes. Similarly, when fused to split-GFP constructs, both wildtype and mHtt ex1 formed oligomers, as evidenced by the formation of a fluorescent reporter. Only the mHtt ex1 split-GFP oligomers assembled into IBs. Both FRAP and split-GFP approaches confirmed the ability of mHtt ex1 to bind and incorporate wildtype Htt into soluble oligomers. We exploited the irreversible binding of split-GFP fragments to forcibly increase levels of soluble oligomeric mHtt ex1 . A corresponding increase in the rate of IBs formation and the number formed was observed. Importantly, higher levels of soluble mHtt ex1 oligomers significantly correlated with increased mutant cytotoxicity, independent of the presence of IBs.
Experimental design
Two different approaches were employed to quantitate global changes in the monomeric mHtt pool and detect soluble oligomers in live cells. To study changes in the total population of mHtt ex1 , we measured changes in protein mobility, and by extension molecular size, with Fluorescence Recovery after photobleaching (FRAP). For FRAP, GFP-tagged proteins are expressed in live cells and imaged with a scanning confocal microscope. A discrete region of interest (ROI) in a cell is irreversibly photobleached with high intensity laser light. Movement of unbleached fluorescent molecules into the ROI is quantitated over time and analyzed to determine the diffusion coefficient ( D ) of the fluorescent molecule [36] . D (µm 2 /s) is inversely proportional to environmental viscosity and the size of the molecule (hydrodynamic radius or R h ) or an associated molecular complex [37] . Previously, FRAP analysis revealed that polyQ proteins, when incorporated into IBs, exhibit exceptionally low mobility [38] . However, these results provide no indication of the mobility of the polyQ protein prior its incorporation into IBs. While FRAP can report changes in molecular size, it provides no information on the composition of molecular complexes. Decreased mobility of mHtt proteins could represent mHtt ex1 oligomers, assemblies with other cellular proteins, such as chaperones or a mixture of both [39] . To specifically detect Htt oligomers, we employed split-GFP technology, also termed bimolecular fluorescence complementation (BiFC). Two non-fluorescent fragments of green fluorescent protein (GFP) can associate to form a single fluorescent GFP, but only when they are fused to two proteins capable of interacting with each other [40] , [41] , [42] , [43] . Split-GFP is sufficiently sensitive to report weak or transient interactions even for small populations of interacting proteins that could be otherwise obscured in sensitized emission FRET experiments [41] . The irreversible nature of the split-GFP interaction also allows trapping of otherwise transient interactions [44] . Therefore, this feature can be used to enrich the pool of oligomeric Htt ex1 in living cells [45] . Using FRAP and split-GFP, we sought to detect changes in soluble Htt ex1 oligomer levels in live cells and correlate oligomer formation with mHtt ex1 toxicity.
Materials and Methods
Cell lines Neuro-2a (N2a), U-2 OS, and HEK 293t cells were obtained from ATCC. Cells were grown in 8-well Lab-tek chambers (Nunc; Rochester, NY) in RPMI media (Mediatech; Manassas, VA) containing 10% fetal bovine serum (Hyclone from Thermo Scientific; Rockford, IL), glutamine and penicillin/streptomycin (Invitrogen; Carlsbad, CA), in a 5% CO 2 incubator at 37°C. N2a cells were routinely differentiated by incubating the cells with 5µM dbcAMP (N6′, 2′- O -dibutyrilaenosine-3′:5′-cyclic monophosphate sodium salt) (Sigma-Aldrich; St. Louis, MO) for two days.
Constructs and transfection
Htt ex1 Q23, Q73 and Q145 constructs were obtained from the Coriell Institute for Medical Research and the CHDI Foundation. Htt ex1 fragments were amplified by PCR using the following primers: forward primer GATCAGATCTGCCACCATGGCGACCCTGGAAAAG reverse primer GATCACCGGTCCTGGTCGGTGCAGCGG and subcloned into the BglII and Age1 site of monomeric pEGFP-N1 vector. Split-GFP constructs were generated by PCR using pEGFP-N1 as a template with the following primers: Split-GFP 1–157 was amplified using the forward primer GCAAATGGGCGGTAGGCG reverse primer GATCGCGGCCGCTTACTGCTTGTCGGCCATG and subcloned into Age1 and Not1 of SFpEGFP-N1. Split-GFP 158–238 was amplified using the forward primer GATCACCGGTCCGGGAGCAAGAACGGCATCAAG reverse primer GGTTCAGGGGGAGGTGT and subcloned into Age1 and Not1 of pSuperfolderGFP-N1 [66] . The ER DEVD tdTomato vector was generated by PCR amplification of tdTomato [82] using the following primers: forward primer GATCACCGGTATGGTGAGCAAGGGC reverse primer GGTTCAGGGGGAGGTGT and subcloned the resulting fragment into ER-DEVD-mStrawberry [77] using the Age1 and BsrG1 sites. The Nalp1b allele 2 split-GFP was generated by PCR by amplifying Nalp1b using the forward primer GATCGCTAGCGCCACCATGGAACAATCTCAG reverse primer GATCCCCGGGCACCGGTACGCGTAGA The resulting fragment was cloned into split-GFP-N1 vectors using the Nhe1 and Xma1 sites. DNA constructs were transfected into N2a cells using Lipofectamine 2000 transfection reagent (Invitrogen) according to manufacturer instructions.
Aggregation assay and quantification
N2a cells were plated and differentiated for two days prior transfection with Htt ex1 -GFP or split-GFP constructs. Cells were imaged at various time points following transfection. Imaged were collected using fluorescence microscopy with a widefield microscope, Axiovert 200, (Carl Zeiss Microimaging Inc., Thornwood, NY) 63× oil NA 1.4 objective, 450–490 excitation/500–550 emission bandpass filter) and a Retiga 2000R camera (QImaging; Surrey, BC). The percentage of cells containing at least one or more IBs was quantified. FRAP and FLIP Cells were imaged in phenol red–free RPMI supplemented with 10mM HEPES and 10% FBS. Live cells were imaged on a 37°C environmentally controlled chamber of a Duoscan confocal microscope system (Carl Zeiss Microimaging) with a 63× NA 1.4 oil objective and a 489 nm 100 mW diode laser with a 500–550 nm bandpass filter for GFP. FRAP and FLIP experiments were performed by photobleaching a region of interest at full laser power of the 489 nm line and monitoring fluorescence loss or recovery over time. No photobleaching of the adjacent cells during the processes was observed. Diffusion coefficient ( D ) measurements were calculated as described previously [36] , [83] . Photoactivation N2a cells were transfected with Htt ex1 -PA-GFP constructs for 24h and image on confocal microscope as previously described. Photoactivation experiments were performed by bleaching a small ROI within the cells with a 405 nm laser while constantly imaging cells with a 489 nm laser to detect activated state of PA-GFP.
Quantitative fluorescence microscopy
Cells were fixed with freshly diluted 3.7% formaldehyde in PBS for 15 min at RT, permeabilized with PBS with 0.1% Triton X-100. Blocking was performed in 10% fetal bovine serum in 1× PBS. Subsequently, cells were labeled with anti-monomeric polyglutamine antibody 3B5H10 (Sigma Aldrich), followed by Alexa 555-conjugated anti-rabbit IgG secondary antibodies. Cells were imaged using fluorescence microscopy with an Axiovert 200 widefield microscope (Carl Zeiss Microimaging Inc.) with a 63× oil NA 1.4 objective, 450–490 excitation/500–550 emission bandpass filter. Image analysis was performed with ImageJ (National Institutes of Health; Bethesda, MD). An important technical note is that the high fluorescence intensity of IBs saturates the CCD detector in the GFP channel, obscures the fluorescent signal of soluble GFP construct levels, and thus limits our ability to quantitate soluble GFP construct levels in IBs containing cells. Therefore, most of our study focuses on cells prior to the appearance of IBs. Alternatively, cells containing IBs are scored in general terms of having or not having IBs, without any attempt to quantitate absolute GFP intensity levels in those cells. Cell death Cells were cotransfected with Htt ex1 -GFP and ER-DEVD-tdTomato constructs. Alternatively, cells were transfected with ER-DEVD-tdTomato and treated for 3 h with 5 µM staurosporine (EMD Biosciences; Gibbstown, NJ). Fluorescent images were acquired with a widefield fluorescent microscope as previously described. For the ER DEVD-tdTomato, fluorescent intensity within the nucleus and the ER were obtained with ImageJ. Caspase activity was calculated by obtaining the ratio of mean fluorescence intensity of the nucleus divided by the intensity of the ER. Increase in caspase activity in mHtt expressing cells was quantified by calculating the % of cells with Nucleus/ER ratio higher than the average value obtained for Q23 Htt ex1 -GFP. SDS-PAGE and immunoblot N2a cells were plated in 12 well plates, differentiated and transfected with either Htt ex1 constructs fused to GFP or split-GFP. Cells were rinse twice with PBS and cells were lysed in 50 µl of sample buffer containing 1% SDS, 0.1 M Tris, pH8.0. Lysate were run on 12% Tris-tricine gels and transferred to nitrocellulose membrane, Antibodies used included anti-GFP and anti-RFP (generous gifts from Ramanujan S. Hegde), and HRP-labelled anti-rabbit (Jackson Immunoresearch Laboratories). Immunoprecipitations For immunoprecipitations, N2a cells expressing Htt ex1 constructs in 6-well plates were washed twice with 1× PBS and lysed with IP buffer (1% Triton X-100, 50mM Hepes, pH 7.4, 100mM NaCl) containing EDTA-free protease inhibitor cocktail (Roche). Lysates were clarified for 10 min at maximum speed in a microcentrifuge at 4°C and incubated for 2 h at 4°C with agarose conjugated anti-GFP beads (MBL ltd.). The beads were washed four times in IP buffer, once in distilled water, eluted with SDS-PAGE sample buffer, and analyzed on 12% Tris-glycine gels, followed by blotting, staining, and development as for immunoblots. Native gel N2a cells were plated in 12 well plates, differentiated and transfected with either Htt ex1 constructs fused to GFP or split-GFP. Cells were rinsed twice with native buffer (20mM Hepes, 150 mM NaCl and protease inhibitor cocktail). Then cells were lysed in cold native buffer containing 0.2% triton X-100. Sample were clarified by centrifugation and loaded on a 7.5% Tris-glycine native gel. Tris-glycine buffer was used as running buffer and gels were allowed to migrate for 4 h. Proteins were subsequently transferred on nitrocellulose membrane and processed for immunoblot for anti-GFP.
Supporting Information Figure S1 The mobility of Htt ex1 revealed by GFP photoactivation. N2a cells were transfected with Q23, 73 or 145 Htt ex1 -PA-GFP for 24 h.
Photoactivation a small
ROI within the cytoplasm was performed with a 405 nm laser. By 5 s postactivation, the photoactivated pool of Htt ex1 -PA-GFP has diffused throughout the entire cytoplasm. When IBs (bottom Q145 panels) were photoactivated, no significant redistribution of the mHtt ex1 -PA-GFP to the rest of the cytoplasm was observed. (TIF) Click here for additional data file. Figure S2 D values (µm 2 /s) of single cells transiently transfected with Htt ex1 -GFP constructs containing 23, 73 or 145 polyQ repeats for 16 h and analyzed by FRAP in 293 and U-2 OS cells. * p
📊 Figures
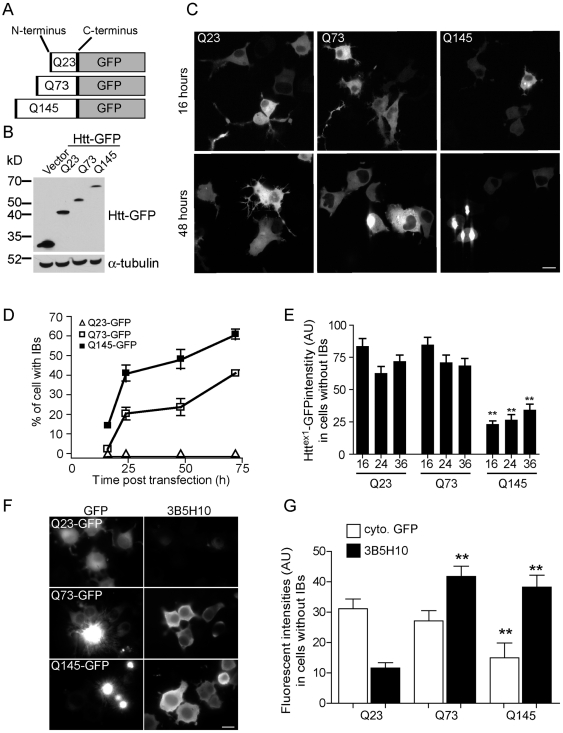
Figure 1
Increased number of polyQ repeats correlates with formation of Htt ex1 -GFP inclusion bodies.
( A ) Diagram showing the Htt ex1 -GFP constructs containing 23, 73 and 145 polyQ repeats. ( B ) Western blot showing the relative sizes of the Q23, 73 and 145 Htt ex1 -GFP constructs relative to the ...
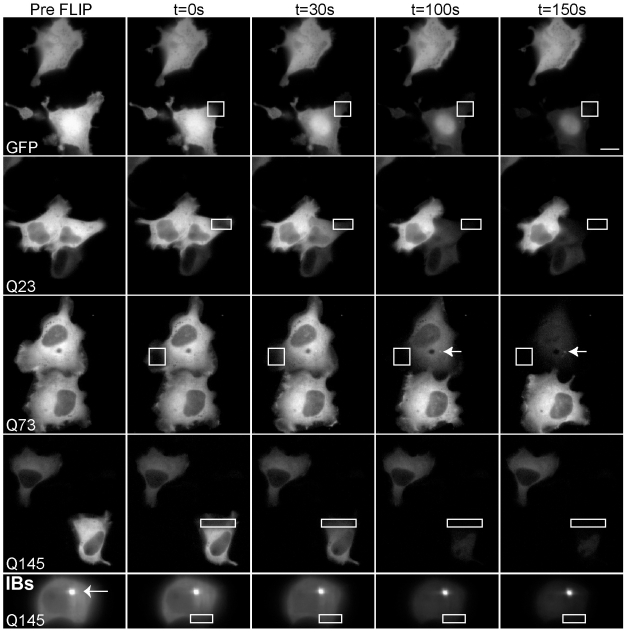
Figure 2
Mobility of Htt ex1 -GFP constructs.
FLIP analysis of Htt ex1 -GFP mobility in the cytoplasm of N2a cells transfected for 24 h. Repetitive photobleaching of cells within the cytoplasm, in a small ROI (white outline box), was performed. T...
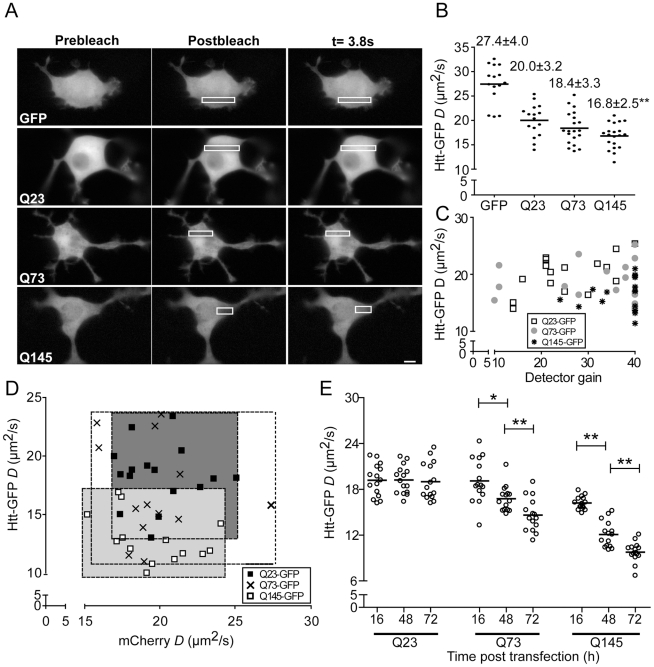
Figure 3
FRAP analysis reveals incorporation of Htt ex1 -GFP mutants into microcomplexes.
( A ) Fluorescent images of N2a cells transiently transfected 16 h (to minimize the number of IBs) with Htt ex1 -GFP constructs containing 23, 73 or 145 polyQ repeats arte shown before (prebleach), im...
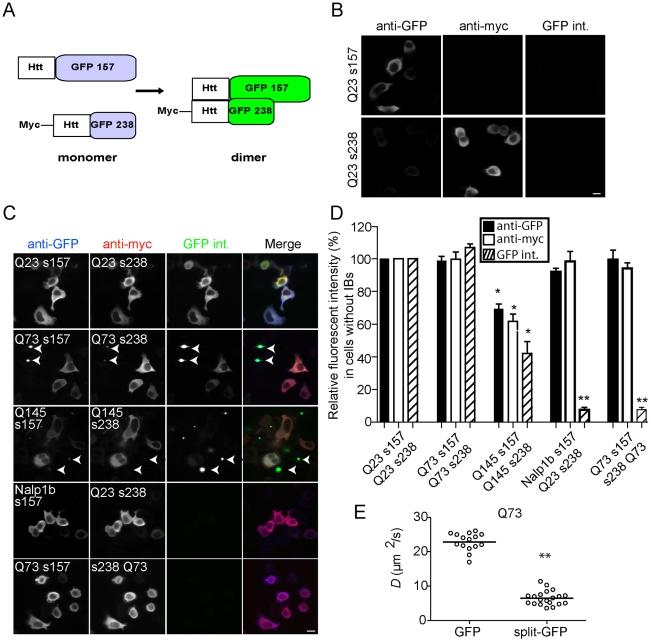
Figure 4
Visualization of Htt ex1 -GFP oligomers using split-GFP.
( A ) Illustration of the fusion of wt and mHtt ex1 to either 157-GFP or 238-GFP. ( B ) Cells transfected with Q23 s157 or Q23 s238 separately, stained with anti-GFP or anti-myc, and imaged for GFP fl...
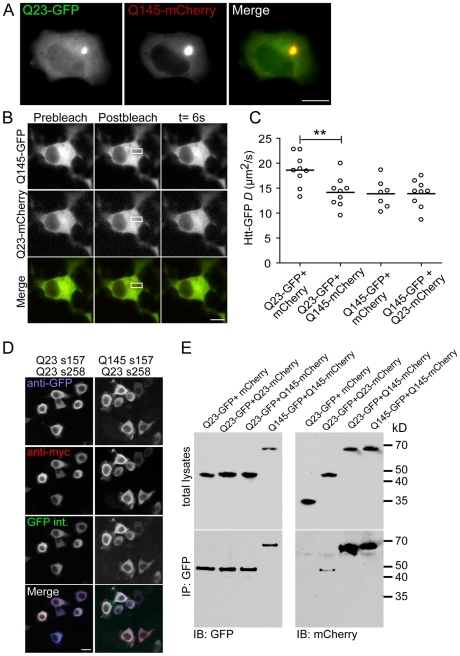
Figure 5
Incorporation of wt Htt ex1 -GFP into mutant oligomers.
( A ) Representative fluorescent images of N2a cells cotransfected with Htt ex1 Q23-GFP and Q145-mcherry for 48 h. ( B ) Fluorescent images of N2a cells transiently cotransfected with Htt ex1 Q23-GFP ...
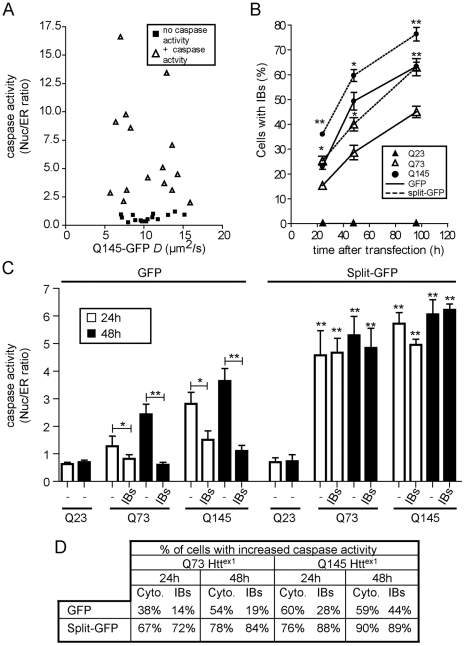
Figure 6
Fusion of mHtt to split-GFP results in increased IBs formation and cell death.
( A ) D values (u00b5m 2 /s) for N2a cells transiently cotransfected with mHtt ex1 Q145-GFP and ER-DEVD-tdTomato. ( B ) Quantitation of percentage of cells containing IBs for indicated times posttrans...
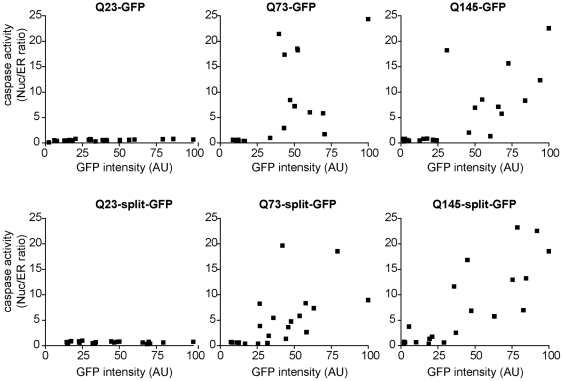
Figure 7
Levels of soluble cytoplasmic mHtt ex1 are a negative predictor of cell death.
N2a cells were cotransfected with Q23, 73 or 145 Htt ex1 fused to GFP or split-GFP and ER-DEVD tdTomato for 48 h. GFP or split-GFP intensities and the nuclear/ER ratio of the apoptosis reporter were q...
Figure images are served from the NIH/NLM PubMed Central Open Access Subset or Europe PMC; copyright remains with the publishers and authors.
💬 Discussion
0 commentsNo comments yet. Be the first to start a discussion!
Leave a Comment